D
D
E
E
V
V
E
E
L
L
O
O
P
P
M
M
E
E
N
N
T
T
O
O
F
F
A
A
M
M
O
O
D
D
U
U
L
L
A
A
R
R
I
I
Z
Z
E
E
D
D
M
M
O
O
D
D
E
E
L
L
F
F
O
O
R
R
A
A
M
M
U
U
L
L
T
T
I
I
-
-
P
P
R
R
O
O
C
C
E
E
S
S
S
S
F
F
O
O
O
O
D
D
M
M
A
A
N
N
U
U
F
F
A
A
C
C
T
T
U
U
R
R
I
I
N
N
G
G
S
S
Y
Y
S
S
T
T
E
E
M
M
U
U
S
S
I
I
N
N
G
G
H
H
I
I
E
E
R
R
A
A
R
R
C
C
H
H
I
I
C
C
A
A
L
L
T
T
I
I
M
M
E
E
D
D
C
C
O
O
L
L
O
O
U
U
R
R
E
E
D
D
P
P
E
E
T
T
R
R
I
I
N
N
E
E
T
T
S
S
R
Ra
af
fi
iu
u
A
A.
.
G
Ga
an
ni
iy
yu
u
11,
,
O
Ol
la
ad
do
ot
tu
un
n
O
O.
.
O
Ok
ke
ed
di
ir
ra
an
n
11,
,
B
Bu
us
si
ir
ra
at
t
O
O.
.
M
Mu
ur
ra
ai
in
na
a
22,
,
T
Ta
ao
of
fe
ee
eq
q
A
A.
.
B
Ba
ad
dm
mu
us
s
331 Ladoke Akintola University of Technology, Ogbomoso, Dept. of Computer Science & Engineering 2 National Open University of Nigeria, Iwo Study Centre, Osun State
3 Federal University Oye-Ekiti, Department of Computer Engineering
Corresponding Author: Taofeeq Badmus, [email protected] ABSTRACT: Concerted efforts are being made yearly by
researchers to improve food manufacturing systems through modelling in order to meet current and future market demands. However, most existing empirical studies are limited to development of non-modular models for multi-process food manufacturing systems. Hence, in this paper, a Hierarchical Timed Coloured Petri Net model, which could accommodate future modifications, was developed for Gari manufacturing system. The model comprises Peeling, Washing, Grating, Fermentation, Dewatering, Pulverization, Garifying, Cooling, Sifting and Packaging modules. The model was simulated to determine the average times used and utilized-resources rates for productions of 200, 400 and 600 kg of Gari, and to study what could happen to production times in the possibility of additional resources for productions of 800 and 1000 kg of Gari. The model was validated at 5% significant level using statistical t-Test. The model could be efficiently utilized to study and improve Gari production working plan.
KEYWORDS: Petri Nets, Food, Gari production, Module, Process, Model.
1. INTRODUCTION
Food production industry is one of the manufacturing sectors that contribute to the development of a nation ([RII14]). Aside from hydrocarbon of which Nigeria is the sixth largest exporter of crude oil and has the second largest known deposit of natural gas in the world, Nigeria also has comparative advantage in the Agricultural sector where varieties of crops and animals are produced and reared respectively. In the time past, the food products produced by small medium enterprises (SMEs) in Nigeria that have high demand in the domestic market and also for export was cocoa based products. However, other SMEs such as Gari industry also contribute significantly to the Gross Domestic Products (GDP) income of Nigeria economy not only because it meets the needs of Nigerian citizens but also meets the international demands.
Modelling technique has been widely applied in
studying food manufacturing systems which include gari production, bakery production line and pasta production. Model is an abstraction of a real system. It can be used to analyze a food manufacturing system in order to understand the behavior of the system and identify the associated bottlenecks inhibiting the optimal productions.
Simulation is a suitable method to experiment gari manufacturing system model in a bid to improve the performance of the production systems. One of the advantages of simulation over other methods is that it paves way for possible modifications of system model without disturbing the actual system. The effects of changes in variables over many weeks, months or years can be obtained from simulation in a short time ([B+10]). Moreover, in experimenting the system models, the experiment environment can be controlled and repeated many times to get an accurate result.
Petri nets (PN) is a modelling language in computing which can be used to model multi-process systems which include food manufacturing systems. PN is a graphical and mathematical tool for describing and studying systems that are characterized as being concurrent, synchronous, asynchronous, distributed, parallel, deterministic and stochastic ([Mur89]; [G+15]). PN formalism can be extended by colour, hierarchy and time concepts ([VN92]; [JKW07]). An extended PN (High Level Petri Nets) such as Hierarchical Timed Coloured Petri Net (HTCPN) can be used to model complex production systems and decompose the model into modules for future modifications ([G+16]).
2. REVIEW OF RELATED WORKS
and future manufacturing system such as food manufacturing system. Simulation technique has been widely applied in the food manufacturing system, including pasta production, bakery production line, juice production and cassava chips production. In [RT04], simulation models were developed in order to analyze and solve supply chain problems faced by pasta manufacturer. The weaknesses of the supply chain network of pasta production were identified. In [HHB10], simulation models are used to improve the performance of bakery production with the aim to reduce the wasted time and energy consumptions. The results of rescheduling the production planning of bakery products reduce the wasted time and energy consumption and help in reducing workers working times. The simulation model of juice production line was developed by ([U+10]). The simulation model was developed to analyze the used of production line and to identify bottlenecks. Two scenarios are proposed. The best scenario is based on the lowest cost contribution and the ability to realize the current and future market demand.
[KPG10] took up scheduling problem in a yogurt production line and formed a mixed integer Linear Problem formulation of the scheduling problem. They employed a cost based objectives function and used a hybrid discrete and continuous time representation. [Fon10] proposed system which basically focused on simulation of the palm oil production lines of selected case via Activplant computer simulation tool. The aim of the study was to define the requirements and methods of simulation implementation for this selected case to improve its throughput and delivery performance in batch production.
[RII14] presented an integrated simulation and data envelopment analysis in improving cassava chips food production system. Also, [Xin15] used simulation to establish a model of milk pasteurizing process for the system using ARENA simulation software to simulate the model.
Conclusively, in order to study and improve food production systems, such as bakery production, pasta production, juice production and cassava chips production, it is found that most existing researches conceptualized on non-modular models which could not accommodate future modifications. Thus, in order to bridge the aforementioned research gap, this paper developed a modularized Hierarchical Timed Coloured Petri Nets model for a food manufacturing system using Gari production processes as a case study.
3. METHODOLOGY
The following sub-sections detailed the method of study employed in this paper.
3.1 The Modelling Approach
In this paper, Hierarchical Timed Coloured Petri Nets (HTCPN) formalism stated in (1) was used to model the production processes of Gari at the food industry under consideration. HTCPN are tuples defined as:
𝐻𝑇𝐶𝑃𝑁 =
(𝑆, 𝑆𝑁, 𝑆𝐴, 𝑃𝑁, 𝑃𝑇, 𝑃𝐴, 𝐹𝑆, 𝐹𝑇, 𝑃𝑃, 𝑅, 𝑟0) (1)
where:
i. S is a finite set is a finite set of pages, a. ∀𝑠 ∈ 𝑆: s is a non-hierarchical
coloured Petri net. b. ∀𝑠1, 𝑠2 ∈ 𝑆: 𝑠1≠ 𝑠2⟹
(𝑃𝑠1∪ 𝑇𝑠1∪ 𝐴𝑠1) ∩ (𝑃𝑠2∪ 𝑇𝑠2∪
𝐴𝑠2) = 𝜙
ii. 𝑆𝑁 ⊆ 𝑇 is a set of substitution nodes.
iii. 𝑆𝐴 is a page assignment function. No page is a subpage of itself.
iv. 𝑃𝑁 ⊆ 𝑃 is a set of port nodes.
v. 𝑃𝑇 is a port type function. 𝑃𝑇: 𝑃𝑁 → {𝑖𝑛, 𝑜𝑢𝑡, 𝑖/𝑜, 𝑔𝑒𝑛𝑒𝑟𝑎𝑙}.
vi. 𝑃𝐴 is a port assignment function. It is defined from SN into binary relations.
a. ∀𝑡 ∈ 𝑆: 𝑃𝐴(𝑡) ⊆ 𝑋(𝑡)x𝑃𝑁𝑆𝐴(𝑡)
b. ∀𝑡 ∈ 𝑆𝑁, ∀(𝑝1, 𝑝2) ∈ 𝑃𝐴(𝑡): 𝑃𝑇(𝑝2) ≠ 𝑔𝑒𝑛𝑒𝑟𝑎𝑙 ⇒ 𝑆𝑇(𝑝1, 𝑡) = 𝑃𝑇(𝑝2)
c. ∀𝑡 ∈ 𝑆𝑁, ∀(𝑝1, 𝑝2) ∈ 𝑃𝐴(𝑡): 𝐶(𝑝1) = 𝐶(𝑝2)⋀𝐼(𝑝1) = 𝐼(𝑝2)
vii. 𝐹𝑆 ⊆ 𝑃𝑆 is a set of fusion sets. ∀𝑓𝑠 ∈ 𝐹𝑆, ∀(𝑝1, 𝑝2) ∈ 𝑓𝑠: 𝐶(𝑝1) = 𝐶(𝑝2)⋀𝐼(𝑝1) = 𝐼(𝑝2)
viii. 𝐹𝑇 is a fusion type function. 𝐹𝑇: 𝐹𝑆 → {𝑔𝑙𝑜𝑏𝑎𝑙, 𝑝𝑎𝑔𝑒, 𝑖𝑛𝑠𝑡𝑎𝑛𝑐𝑒}.
ix. 𝑃𝑃 ∈ 𝑆𝑀𝑆 is a multi-set of prime pages.
x. R is a set of time values, also called time stamps.
xi. ro is an element of R called the start time.
[(JKW07)]
3.2 Description of the Case Study
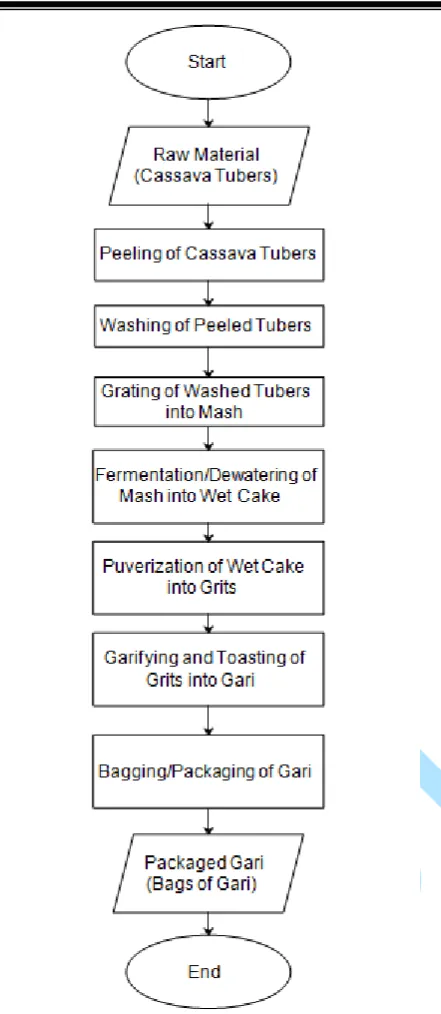
Fig. 1. Flowchart of Gari Production Processes
The first step in producing Gari is peeling process using peeling machine. The next step is to wash the peeled tubers. After washing process is done, grating machine (grater) is loaded with the washed tubers while the engine is running to crush the tubers into a mash. It was observed that after the grating process, the ratio of quantity of cassava tubers to cassava mash is 10:3 (that is, the quantity of cassava mash is now 0.3 times the quantity of the cassava tubers). Then the next process involves putting the grated mash in porous sack which is left on the factory floor
to ferment for a few days (usually between 3 – 5 days). After fermentation, the bagged cassava mash is then loaded on to a hydraulic press in order to reduce water content of the cassava mash.
The fermentation and de-watering processes converted the mash into wet cakes and the ratio of cassava mash to wet cakes is 5:4 (that is, the quantity of wet cakes is now 0.8 times the quantity of the cassava mash). The wet cakes formed after dewatering and fermentation process are then pulverized into small pieces – known as grits using grater. After pulverization, the grits are fried and toasted using automated machine called garifyer to produce toasted granules popularly known as Gari in West Africa. The conversion ratio of quantity of grits to toasted granules (Gari) is 12:11 (that is, the quantity of Gari produced is now approximately 0.92 times the quantity of the grits). After garifying process, the toasted Gari is then collected into a clean basin and spread on a raised platform lined with clean polythene material or white cloth to cool to room temperature. After garifying process, the toasted Gari is then sieved using sifter to obtain Gari of uniform size. The amount of Gari left after sifting is approximately 0.91 times the amount of Gari before sieving. The final step in the production of Gari is bagging/packaging. It involves filling the gari in packaging material usually in sacks using needle and threads.
3.3 Data Collection and Analysis
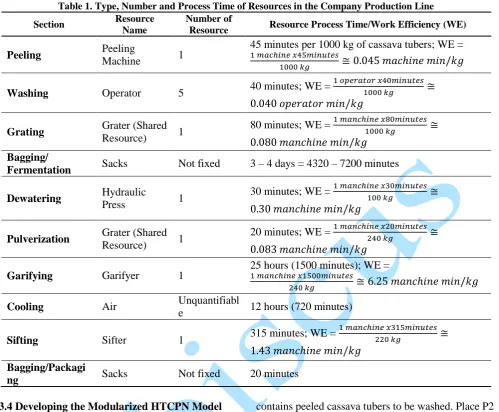
Table 1. Type, Number and Process Time of Resources in the Company Production Line
Section Resource
Name
Number of
Resource Resource Process Time/Work Efficiency (WE)
Peeling Peeling
Machine 1
45 minutes per 1000 kg of cassava tubers; WE =
1 𝑚𝑎𝑐ℎ𝑖𝑛𝑒 𝑥45𝑚𝑖𝑛𝑢𝑡𝑒𝑠
1000 𝑘𝑔 ≅ 0.045 𝑚𝑎𝑐ℎ𝑖𝑛𝑒 𝑚𝑖𝑛/𝑘𝑔
Washing Operator 5 40 minutes; WE =
1 𝑜𝑝𝑒𝑟𝑎𝑡𝑜𝑟 𝑥40𝑚𝑖𝑛𝑢𝑡𝑒𝑠
1000 𝑘𝑔 ≅
0.040 𝑜𝑝𝑒𝑟𝑎𝑡𝑜𝑟 𝑚𝑖𝑛/𝑘𝑔
Grating Grater (Shared
Resource) 1
80 minutes; WE = 1 𝑚𝑎𝑛𝑐ℎ𝑖𝑛𝑒 𝑥80𝑚𝑖𝑛𝑢𝑡𝑒𝑠
1000 𝑘𝑔 ≅
0.080 𝑚𝑎𝑛𝑐ℎ𝑖𝑛𝑒 𝑚𝑖𝑛/𝑘𝑔
Bagging/
Fermentation Sacks Not fixed 3 – 4 days = 4320 – 7200 minutes Dewatering Hydraulic
Press 1
30 minutes; WE = 1 𝑚𝑎𝑛𝑐ℎ𝑖𝑛𝑒 𝑥30𝑚𝑖𝑛𝑢𝑡𝑒𝑠
100 𝑘𝑔 ≅
0.30 𝑚𝑎𝑛𝑐ℎ𝑖𝑛𝑒 𝑚𝑖𝑛/𝑘𝑔
Pulverization Grater (Shared
Resource) 1
20 minutes; WE = 1 𝑚𝑎𝑛𝑐ℎ𝑖𝑛𝑒 𝑥20𝑚𝑖𝑛𝑢𝑡𝑒𝑠
240 𝑘𝑔 ≅
0.083 𝑚𝑎𝑛𝑐ℎ𝑖𝑛𝑒 𝑚𝑖𝑛/𝑘𝑔
Garifying Garifyer 1 25 hours (1500 minutes); WE = 1 𝑚𝑎𝑛𝑐ℎ𝑖𝑛𝑒 𝑥1500𝑚𝑖𝑛𝑢𝑡𝑒𝑠
240 𝑘𝑔 ≅ 6.25 𝑚𝑎𝑛𝑐ℎ𝑖𝑛𝑒 𝑚𝑖𝑛/𝑘𝑔
Cooling Air Unquantifiabl
e 12 hours (720 minutes)
Sifting Sifter 1 315 minutes; WE =
1 𝑚𝑎𝑛𝑐ℎ𝑖𝑛𝑒 𝑥315𝑚𝑖𝑛𝑢𝑡𝑒𝑠
220 𝑘𝑔 ≅
1.43 𝑚𝑎𝑛𝑐ℎ𝑖𝑛𝑒 𝑚𝑖𝑛/𝑘𝑔
Bagging/Packagi
ng Sacks Not fixed 20 minutes
3.4 Developing the Modularized HTCPN Model for Gari Production Processes
The modularized HTCPN model was structured in hierarchical levels and developed using top-down approach. The top page of the developed modularized model represents highest hierarchical level and provides an overview of the entire Gari production processes as depicted in Fig. 1. At the highest hierarchical level, the structure of the HTCPN model consists of a top page (Gari Production Processes) and ten sub-pages (modules): the Peeling Process, the Washing Process, the Grating Process, the Fermentation Process, the Dewatering Process, the Pulverization Process, the Garifying Process, the Cooling Process, the Sifting Process and the Bagging/Packaging Process modules. Each module was represented in the top page by a special transition called substitution transitions (rectangles with double border lines).
In the top page of the developed HTCPN model, there are nine socket places (P1, P2…P9). The socket places represent the intermediate state of semi-finished products such as cassava mash and grits during production of Gari. Precisely, socket place P1
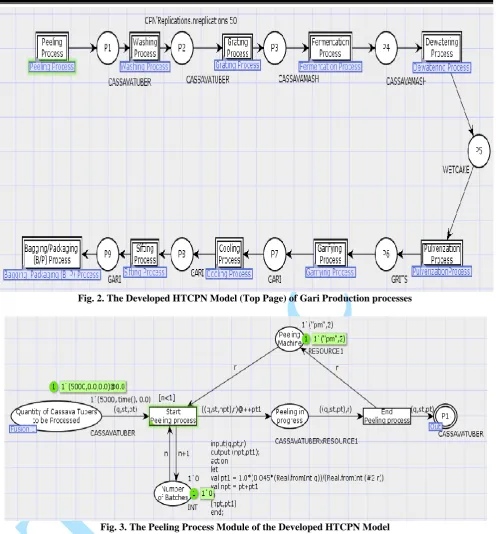
contains peeled cassava tubers to be washed. Place P2 holds cassava tubers waiting to undergo grating process. Place P3 holds grated cassava tubers (cassava mash) waiting to undergo fermentation process. Place P4 contains quantity of cassava mash to be dewatered. Places P5 and P6 hold dewatered cassava mash (wet-cake) to be pulverized into grits and fried (garified) into Gari respectively. Places P7 and P8 contain Gari to be cooled and sieved respectively. Place P9 contains quantity of Gari waiting to be bagged and packaged.
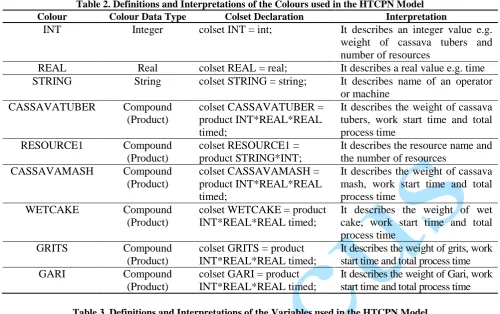
Based on HTCPN formalism, the definition and interpretations of colours and variables employed in the HTCPN model are enumerated in Tables 2 and 3, respectively. Also, the descriptions of the major places used in the model are summarized in Table 4 while that of major transitions are as enumerated in Table 5. The assumptions made in developing the model are:
i. One time stamp unit represents one minute in the HTCPN model.
Table 2. Definitions and Interpretations of the Colours used in the HTCPN Model
Colour Colour Data Type Colset Declaration Interpretation
INT Integer colset INT = int; It describes an integer value e.g. weight of cassava tubers and number of resources
REAL Real colset REAL = real; It describes a real value e.g. time STRING String colset STRING = string; It describes name of an operator
or machine
CASSAVATUBER Compound
(Product)
colset CASSAVATUBER = product INT*REAL*REAL timed;
It describes the weight of cassava tubers, work start time and total process time
RESOURCE1 Compound
(Product)
colset RESOURCE1 = product STRING*INT;
It describes the resource name and the number of resources
CASSAVAMASH Compound
(Product)
colset CASSAVAMASH = product INT*REAL*REAL timed;
It describes the weight of cassava mash, work start time and total process time
WETCAKE Compound
(Product)
colset WETCAKE = product INT*REAL*REAL timed;
It describes the weight of wet cake, work start time and total process time
GRITS Compound
(Product)
colset GRITS = product INT*REAL*REAL timed;
It describes the weight of grits, work start time and total process time
GARI Compound
(Product)
colset GARI = product INT*REAL*REAL timed;
It describes the weight of Gari, work start time and total process time Table 3. Definitions and Interpretations of the Variables used in the HTCPN Model
Variable Variable type Variable Declaration Interpretation
n, q, nq Integer var n, q, nq:INT; They describe information such as weight of unprocessed cassava and processed cassava, and number of resources
r Compound (String
and Integer)
var r:RESOURCE1; It describes the name of resource and the number of resources
r1 Unit var r1:RESOURCE; It represents the resources whose
number is not fixed and quantified st,pt,npt,ft,pt1 Real var st,pt,npt,ft,pt1:REAL; They describes timing in the model
Table 4. Definitions and Interpretations of the Places used in the HTCPN Model
Place Description
Quantity of Cassava Tubers to be Processed
Models amount of cassava tubers to be processed into Gari
Number of Batches Models number of batches of cassava tubers to be processed into Gari Peeling Machine Models a state in which the peeling machine is idle
Peeling in progress Models a state in which the peeling machine is busy
Operator Models a state in which the operators are idle
Washing in progress Models a state in which the operators are busy
Grater Models a state in which the grating machine is idle
Grating in progress Models a state in which the grating machine is busy Fermentation in progress Models a state in which fermentation process is in progress Hydraulic press Models a state in which the hydraulic press is idle
Dewatering in progress Models a state in which dewatering process is in progress Pulverizing in progress Models a state in which pulverization process is in progress
Garifyer Models a state in which the garifyer is idle
Garifying in progress Models a state in which garifying process is in progress Cooling in progress Models a state in which cooling operation is in progress
Sifter Models a state in which the sifter is idle
Sifting in progress Models a state in which sifting operation is in progress
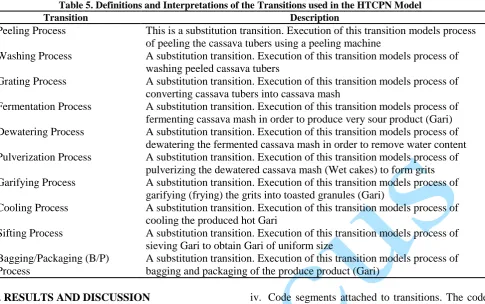
Table 5. Definitions and Interpretations of the Transitions used in the HTCPN Model
Transition Description
Peeling Process This is a substitution transition. Execution of this transition models process of peeling the cassava tubers using a peeling machine
Washing Process A substitution transition. Execution of this transition models process of washing peeled cassava tubers
Grating Process A substitution transition. Execution of this transition models process of converting cassava tubers into cassava mash
Fermentation Process A substitution transition. Execution of this transition models process of fermenting cassava mash in order to produce very sour product (Gari) Dewatering Process A substitution transition. Execution of this transition models process of
dewatering the fermented cassava mash in order to remove water content Pulverization Process A substitution transition. Execution of this transition models process of
pulverizing the dewatered cassava mash (Wet cakes) to form grits Garifying Process A substitution transition. Execution of this transition models process of
garifying (frying) the grits into toasted granules (Gari)
Cooling Process A substitution transition. Execution of this transition models process of cooling the produced hot Gari
Sifting Process A substitution transition. Execution of this transition models process of sieving Gari to obtain Gari of uniform size
Bagging/Packaging (B/P) Process
A substitution transition. Execution of this transition models process of bagging and packaging of the produce product (Gari)
4. RESULTS AND DISCUSSION
Fig. 2 shows the developed modularized HTCPN model for Gari production processes of the considered food production system.
The developed HTCPN model is characterized by the following features:
i. A top page (Gari Production Processes) which provides an overview of the entire production processes.
ii. Ten modules (Peeling, Washing, Grating, Fermentation, Dewatering, Pulverization, Garifying, Cooling, Sifting and Packaging modules) that modelled the sequential processes of converting cassava tubers into Gari. Timestamps denoted by @++d (where d is called the delay) attached to transitions or added to arc expressions in the model to represent the time it took a process to complete as a result of occurrence of an activity (execution of transition).
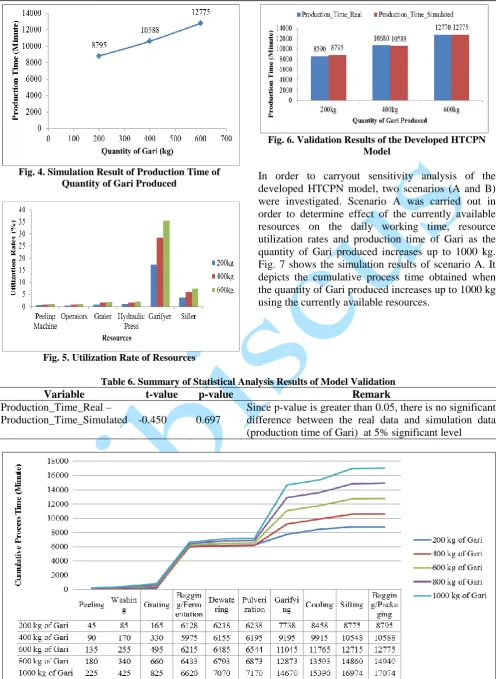
iii. Guard attached to transition which is a Boolean expression and which must be true to enable the transition. For example, the guard ([n<=1]) attached to transition Start Peeling process in the Peeling process module (depicted in Fig. 3) means that the Number of Batches (denoted by variable n) of cassava tubers to be processed into Gari should not be more than 1.
iv. Code segments attached to transitions. The code segmented is divided into three parts: input, output and action. The action part of the code segment contains the CPN ML code to perform some activities that process the input (input) and returns a value (output). For example, the code segment represented in (2) was added to transition Start Peeling process in the peeling process module to perform peeling process and returns the time ( variable pt1) used to peel the cassava tubers depending on the number of resources (variable r), the quantity of cassava tubers (variable q) and rate of peeling (0.045
min/kg). The code segment also returns the
computed job flow time (npt) which is equal to the job old process time (pt) plus the job new process time (pt1).
input(q,pt,r) output (npt,pt1);
action let
val pt1 = 1.0*(0.045*(Real.fromInt q))/
(Real.fromInt (#2 r)) (2)
val npt = pt+pt1 in
Fig. 2. The Developed HTCPN Model (Top Page) of Gari Production processes
Fig. 3. The Peeling Process Module of the Developed HTCPN Model
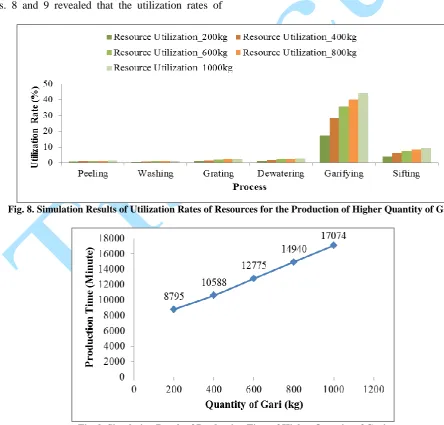
The simulation results of the developed HTCPN model as depicted in Fig. 4 revealed that the average time utilized to produce 200, 400 and 600 kg of Gari were 8795, 10588 and 12775 minutes, respectively. Besides, Fig 5 revealed simulation results of utilization of resources in the considered food production company (DNLN). The simulation results as depicted in Fig. 5 revealed that utilization rates of Peeling Machine, Operators, Grater, Hydraulic Press, Garifyer and Sifter were respectively (0.52, 0.46, 0.92, 1.03, 17.22 and 3.64 %), (0.86, 0.76, 1.52, 1.71, 28.51 and 6.02 %) and (1.06, 0.94, 1.89, 2.12, 35.39 and 7.47 %) for production of 200, 400 and 600 kg of Gari respectively. This shows that in all the cases of production, garifyer had highest utilization rate
followed by sifter as against utilization rates of other resources. Thus, garifyer and sifter are one of the critical resources in the production process.
Fig. 4. Simulation Result of Production Time of Quantity of Gari Produced
Fig. 5. Utilization Rate of Resources
Fig. 6. Validation Results of the Developed HTCPN Model
In order to carryout sensitivity analysis of the developed HTCPN model, two scenarios (A and B) were investigated. Scenario A was carried out in order to determine effect of the currently available resources on the daily working time, resource utilization rates and production time of Gari as the quantity of Gari produced increases up to 1000 kg. Fig. 7 shows the simulation results of scenario A. It depicts the cumulative process time obtained when the quantity of Gari produced increases up to 1000 kg using the currently available resources.
Table 6. Summary of Statistical Analysis Results of Model Validation
Variable t-value p-value Remark
Production_Time_Real –
Production_Time_Simulated -0.450 0.697
Since p-value is greater than 0.05, there is no significant difference between the real data and simulation data (production time of Gari) at 5% significant level
Precisely, the simulation results as depicted in Fig. 7 revealed that the cumulative process times for the production of 200, 400, 600, 800 and 1000 kg of Gari starting from the peeling process till the end of grating process were 165 minutes (2 hours, 45 minutes), 330 minutes (5 hours, 30 minutes), 495 minutes (8 hours, 15 minutes), 660 minutes (11 hours) and 825 minutes (13 hours, 45 minutes) respectively. This shows that as the quantity of Gari increases beyond 600 kg, the cumulative process time tends to be higher than the daily working time (600 minutes: 10 hours). Thus, the critical resources identified at this stage were peeling machine and grater because these two resources account for about 76 % of the cumulative process time starting from the peeling process till the end of grating process.
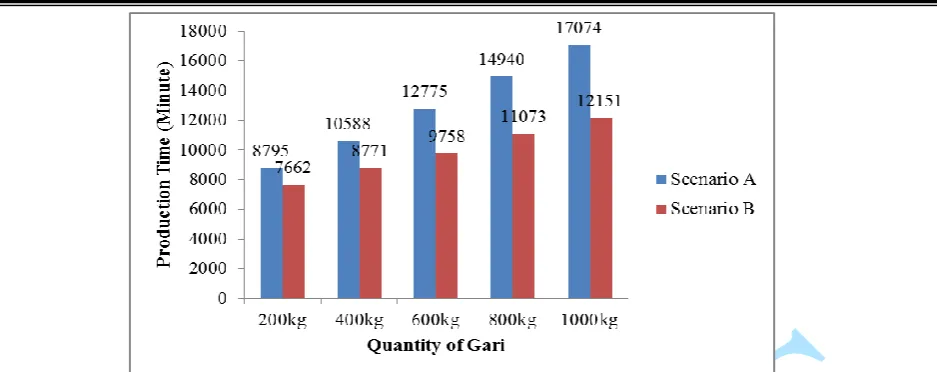
Figs. 8 and 9 respectively show the simulation results of utilization rates of resources and the production times obtained when the quantity of Gari produced increases up to 1000 kg using the currently available resources. The simulation results as depicted in both Figs. 8 and 9 revealed that the utilization rates of
resources and the production times of Gari increases as the quantity of Gari to be produced increases. Thus, there is need for improvement on these two performance metrics (Utilization rates of resources and production times). In doing so, Scenario B was examined by varying the number of critical resources (Peeling machine, Grater, Garifyer and Sifter) used for production. Fig 10 shows the comparison between Scenario A and Scenario B and also shows that by increasing the number of Peeling machine, Grater, Garifyer and Sifter each by one, the production time of 200, 400, 600, 800 and 1000 kg of Gari decreases by 13, 17, 24, 26 and 29 % respectively. Thus, if the management of the considered food production company wants to maximize their production, the only scenario that will not have adverse effect on the daily working time of the production process is the case of increasing the number of identified critical resources in the food production system by one. That is Scenario B.
Fig. 8. Simulation Results of Utilization Rates of Resources for the Production of Higher Quantity of Gari
Fig. 10. Comparison between Simulation Results of Production Time of Higher Quantity of Gari under Currently Available Resources (Scenario A) and Increase in Number of Resources (Scenario B)
5. CONCLUSIONS
In this paper, Hierarchical Time Coloured Petri Net (HTCPN) formalism has been used to develop a modularized model for a multi-process food production system using production of Gari at Deep Launch Nigeria Limited, Ogbomoso as a case study. The simulation results of the developed HTCPN model revealed that by increasing the number of identified critical resources (Garifyer and shifter) in the food production system as the quantity of Gari to be produced increases, the production time of the quantities of food produced decreases. Besides, the developed HTCPN model revealed valid representation of production process of Gari in the food production company. This is evident from the result of the statistical analysis, which shows that there were no significant differences between the simulated and the average time utilized to produce 200, 400, 600, 800 and 1000 kg of Gari from the production time obtained from the real system at 5% level. Thus, the developed modularized HTCPN model could accurately describe the production process of Gari in the food production company or any other related food production system. The developed HTCPN model could be used to accommodate future modifications through its associated modules for Gari production processes or other related multi-process food manufacturing system. Besides, the model could as well serve as a reference model for Gari production manager to study and plan working time, based on the quantity of Gari to be produced.
REFERENCES
[B+10] J. Banks, J. S. Carson, B. L. Nelson, D. Nicol - Discrete-Event System Simulations, 5th Edition, Prentice Hall, 2010.
[Fon10] C. A. Fonche - Manufacturing,
Simulation and Implementation of
Concurrent Engineering to Improve Production: A Case Study in Palm Oil
Industry, Master of Science in
Mechanical Engineering, Eastern Mediterranean University, Gazimağusa, North Cyprus, 2010.
[FR04] J. W. Fowler, O. Rose - Grand Challenges in Modelling and Simulation
of Complex Manufacturing Systems, The
Society for Modelling and Simulation International, vol. 80: 469 – 476, 2004. [G+15] R. A. Ganiyu, S. O. Olabiyisi, T. A.
Badmus, O. Y. Akingbade -
Development of a Timed Coloured Petri Nets Model for Health Centre Patient
Care Flow Processes, International
Journal of Engineering and Computer Science, India, vol., 4: 9954 – 9961, 2015.
[G+16] R. A. Ganiyu, E. O. Omidiora, A. O. Olaoluwa, T. A. Badmus - Simulation Based Analysis of the Hierarchical Timed Coloured Petri Net Model of the
Nigerian Voting System, IOSR Journal
[HHB10] F. Hecker, W. Hussein, T. Becker -
Analysis and Optimization of a Bakery
Production Line using ARENA,
International Journal of Simulation, vol. 9: 208–216, 2010.
[JKW07] K. Jensen, L. M. Kristensen, L. Wells
- Coloured Petri Nets and CPN Tools for
and validation of concurrent systems,
International Journal on Software Tools for Technology Transfer, vol. 9: 213 – 254, 2007.
[KPG10] G. M. Kopanos, L. Puigjaner, M. C. Georgiadis - Optimal Production Scheduling and Lot-Sizing in Dairy
Plants: The Yogurt Production Line,
Industrial & Engineering Chemistry Research, vol. 29: 701 – 718, 2010. [Mur89] T. Murata - Petri nets: properties,
analysis and application, Bachelor of
Proceedings of the IEEE, vol. 77: 541 – 580, 1989.
[RT04] G. Reiner, M. Trcka - Customized supply chain design: Problems and alternatives for a production company in the food industry: a simulation based
analysis, International Journal of
Production Economics, vol. 89: 217 – 229, 2004.
[RII14] R. Rani, W. Ismail, I. Ishak - An
integrated simulation and data
envelopment analysis, World Journal of
Modelling and Simulation, vol. 10: 136 – 147, 2014.
[U+10] A. Ur-Rehman, K. Marwan, K. Al-Otaibi, M. Al-Mubarak - Modeling of juice production line using simulation, In Proceedings of the IEEE 17th International Conference on Industrial Engineering and Engineering Management, 1555 – 1559, 2010. [VN92] N. Viswanadham, Y. Narahari -
Performance Modelling of Automated
Manufacturing Systems, Prentice-Hall,
Englewood Cliffs, USA, 1992.
[Xin15] N. Z. Xin - Modeling of Milk Production
Process using Simulation, Bachelor of