
117
BIBECHANA
ISSN 2091-0762 (Print), 2382-5340 (Online)Journal homepage: http://nepjol.info/index.php/BIBECHANA
Publisher: Department of Physics, Mahendra Morang A.M. Campus, TU, Biratnagar, Nepal
Spatial orientation of galaxies in supercluster S[227+006+0078]
Janak Ratna Malla1*, Walter Saurer2, Binil Aryal3**1Amrit Campus, T.U., Kathmandu
2Institute of Astro-particle Physics, Innsbruck university, Austria2 3Central Department of Physics, kirtipur ,Kathmandu
Email: *[email protected], **[email protected]
Article Information:
Received: August 21, 2019 Accepted: December 07, 2019
Keywords: SDSS Supercluser Redshift Galaxy
ABSTRACT
We present a study of spin vector orientation of 1218 SDSS (Sloan Digital Sky Survey) galaxies in Supercluster S [227+006+0078] having redshift 0.07 to 0.09. The database of these galaxies is taken from SDSS (Sloan Digital Sky Survey) 7th and 9th data release. We have converted two dimensional data to three dimensional by Godlowskian Transformation using position angle-inclination angle method. We intend to find non-random effects in the spatial orientation of galaxies in the Supercluster. No preferred alignment of angular momentum vectors is noticed, supporting Hierarchy model of galaxy formation.
1.Introduction
Modern cosmology is based on two fundamental assumptions: First, the dominant interaction on cosmological scales is gravity, and second, the cosmological principle is a good approximation to the Universe. The cosmological principle states that the universe, smoothed over large enough scales, is essentially homogeneous and isotropic. ‘Homogeneity’ has the intuitive meaning that at a given time the universe looks the same everywhere, and ‘isotropy’ refers to the fact that for any observer moving with the local matter the universe looks (locally) the same in all directions. Von Weizsacker and Gamow (1951 & 1952) verified that the observed rotation of the galaxies is important for cosmology: the fact that the galaxies rotate may be clue to the physical conditions under
Janak Ratna Malla / BIBECHANA 17 (2020) 117-122
118 100 Mpc, but on smaller scales we observe huge deviations from the mean density in the form of galaxies, galaxy clusters, and the cosmic web being made of sheets and filaments of galaxies. How do structures grow in the universe and how can we describe them? The most accepted view on the formation and evolution of large scale structure is that it was formed as a consequence of the growth of primordial fluctuations by gravitational instability [6]. In the current favored model, smaller structures collapse first and are later incorporated in larger collapsing structures in a bottom-up scenario that provides a natural explanation for the formation of galaxies, clusters, filaments and Superclusters [7] .
There are three predictions about the spatial orientation of spin vectors of galaxies. These are the `pancake model', the `hierarchy model,' and the `primordial vorticity theory.' The `pancake model' [8, 9] predicts that the angular momentum vectors of galaxies tend to lie within the cluster plane. According to the `hierarchy model' [2], the directions of the angular momentum vectors should be distributed randomly. The `Primordial Vorticity Theory' [10,11] predicts that the spin vectors of galaxies are distributed primarily perpendicular to the cluster plane.
In this paper, we analyze spatial orientation of angular momentum vectors of 1218 galaxies in the SDSS supercluster S [227+006+0078]. The methods and results are described in the following chapters.
Godlowskian Transformation
The three dimensional orientation of the angular momentum vectors of a galaxy is characterized by two angles: the polar angle (between the galactic SV and a reference plane (here equatorial plane), and the azimuthal angle between the projection of a galactic SV on to this reference plane and the X-axis within this plane. The detail derivations of the expressions of the angles and are given in Flin & Godłowski [12] . When using equatorial coordinate system as reference, then
and can be obtained from measurable quantities
as follows:
cos
sin
sin
sin
cos
sin
i
i
p
(1)
(cos ) cos cos sin sin sin sin sin cos cos
sin 1 i i p p
(2)
where , iis the inclination angle, the angle between the normal to the galaxy plane and the observer’s line-of-sight, α- is right ascension, δ is declination and p is position angle. The inclination angle can be computed from the formula
) * 1 ( ) * ( cos 2 2 2 2 q q q i (3)
This expression is valid for oblate spheroids [13]. Here, q and q* represent the measured axial ratio (b/a) and the intrinsic flatness of the galaxy, respectively. Hiedmann et al.[14] showed that the values of q* range from 0.083 for Sd spirals to 0.33 for ellipticals. For the galaxies with unknown morphology q*= 0.20 is assumed Holmberg [13].
2. Method of analysis
Here we describe the procedure for the removal the selection effects to obtain the isotropic distributions for both andas given by Aryal & Saurer [15]. Theoretically, the isotropic distribution curve for polar angle is cosine and that for azimuthal angle is the average distribution curve, with the restriction that the database is free from selection effect. Aryal & Saurer [15] concluded that any selections imposed on the database may cause severe changes in the shapes of the expected isotropic distribution curves. In their method, a true spatial distribution of the galaxy rotation axis is assumed to be isotropic. Then, due to the projection effects, i can be distributed as sin i, B can be distributed cosB, the variables α and p can be distributed randomly, and the equation (1,2) can be used to calculate the corresponding values of polar () and azimuthal (). We run simulations in order to define expected isotropic distribution curves for both the and distributions. The isotropic distribution curves are based on simulations including 107 virtual
119 distributed by creating 107 virtual galaxies for
respective parameters. We use these numbers to make input file and the expected distribution by running simulation in MATLAB 15.0.
Our observations (real observed data set) are compared with the isotropic distribution curves (obtained from simulation) in both and distributions. For this comparison we use four different statistical tests: chi-square probability, First order Fourier Coefficient (11/(11)), Fourier
Probability (P >1) and auto correlation-test
(C/C()).
3. Results and Discussion
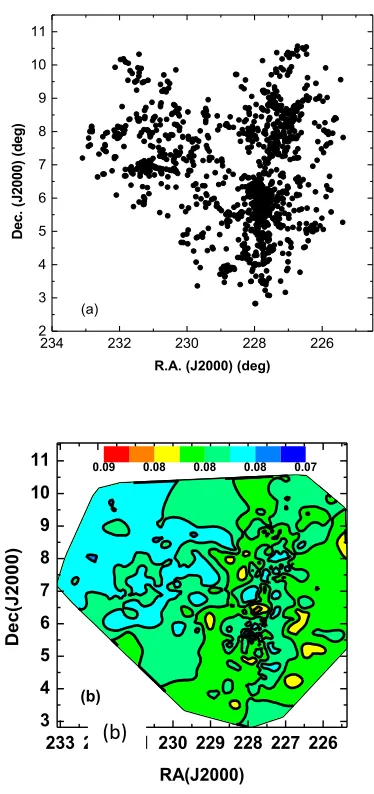
Figure 1(a) shows all sky distribution of galaxies in the Superclusters S [227+006+0078] several groups of galaxies can be seen. These groups can form a substructure, ultimately a cluster of galaxies. Figure 1(b) shows redshift distribution of galaxy in this supercluster where we can see low redshifted galaxies in the substructure region. High redshifted galaxies are found to be distributed randomly. Any deviation from expected isotropic distribution will be tested using four statistical parameters, namely chi-square probability (P>2), autocorrelation coefficient (C/C()), first order Fourier coefficient (11/(11)) and first order
Fourier probability (P >1). For anisotropy, the
limit of chi-square probability P(>2) is <0.050, auto correlation coefficient (C/C()) is >1.0, first order Fourier coefficient (11/(11)) is >1.5 and
Fourier probability P(>1) is <0.150 respectively.
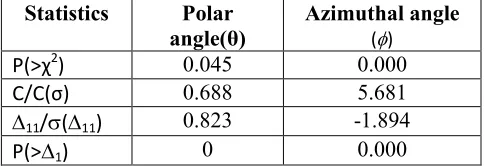
Any `hump' (more solutions than the expected) or `dip' ( less solutions than the expected) in the histogram will be discussed as a local effect in the samples. The statistics for the polar and azimuthal angle distributions is given in Table 1 . In the statistics of , a negative value of first order Fourier coefficient suggests that the spin vectors of galaxies tend to be oriented perpendicular with respect to the equatorial coordinate system. Similarly, a positive value of first order Fourier
coefficient suggests that the spin vectors of galaxies tend to be oriented parallel with respect to the
234 232 230 228 226
2 3 4 5 6 7 8 9 10 11
(a)
D
ec
. (
J2
00
0)
(
d
eg
)
R.A. (J2000) (deg)
233 232 231 230 229 228 227 226 3
4 5 6 7 8 9 10 11
D
e
c
(J
2
0
0
0
)
RA(J2000)
0.07 0.08 0.08 0.08 0.09
(b)
Fig. 1 : (a) All Sky distribution of galaxies and (b) red shift distribution map.
equatorial coordinate system. Whereas, in the statistics of , a positive (11/(11) with significant
value suggests that the spin vector projections of galaxies tend to point radially with respect to the center of the equatorial coordinate system. Similarly, a significant negative value of (11/(11) implies that the spin vector projection
of galaxies tend to orient tangentially with respect to the equatorial coordinate system.
Janak Ratna Malla / BIBECHANA 17 (2020) 117-122
120 In addition to the statistical tests, we also study the `humps' and `dips' in the polar and azimuthal angle distributions. The solid curve, in the histogram of the -distribution, represents the expected isotropic distribution whereas dashed curve is the cosine distribution. The solid circles with ±1error bars represent the observed distribution. The shaded portion represents the range 0o<<45o. A hump (or dip) in the smaller suggests that the spin vectors of galaxies tend to orient parallel (or perpendicular) with respect to the equatorial coordinate system. Similarly, a hump (or dip) in the larger 45osuggests that the spin vectors of galaxies tend to orient perpendicular with respect to the equatorial coordinate system. In figure 2, there is a hump on polar angle distribution at θ = 46.This hump is due to 13 more expected solution than observed solutions in the range 45o. Similarly, a hump (or dip) in the larger indicates that the spin vectors of galaxies tend to be oriented perpendicular with respect to the equatorial coordinate system .In the histogram of the -distribution, solid curve represents the expected isotropic distribution whereas dashed curve is the average distribution. The solid circles with ±±1 error bars represent the observed distribution. The shaded portion represents the range --45o<<+45o. The humps and dips in the histograms of -distribution are not so easy to interpret as compared
to -distributions. It is because the range of is
-90o to +90o. In the histogram of the -distribution,
= 0o means spin vector projections tend to point
radially towards the center of the equatorial coordinate system. A hump in the middle (central eight bins) of the histogram suggests that the spin vector projections of galaxies tend to point towards the center of the chosen co-ordinate system. Similarly, a hump at first four and last four bins indicates that the spin vectors projections of galaxies tend to be oriented tangentially with respect to the chosen reference co-ordinate system. A hump in the middle (central eight bins) of the plot suggests that the spin vector projections of
galaxies tend to point towards the center of the chosen co-ordinate system.
Table 1: Statistics of the polar and azimuthal angle distributions of galaxies in the Supercluster S(227+006+0078). The first column represents the statistics used, P(>2) represents the chi-square probability (second row). Similarly, C/C() represents the auto-correlation coefficient(third row). The last two rows give the first order Fourier coefficient (11/(11) and first order Fourier
probability P(>1).
The statistics for the θ-distribution of galaxies of Supercluster S [227+006+0078] is shown in the Table 1. The statistics for the polar angle distribution in this sample shows that the value of chi-square probability (P(>χ2) to be 0.045
(Smaller than the significant level 0.050 i.e., 5.0%). The auto-correlation coefficient (C/C(σ))is found to be 0.688 (Smaller than 1σ limit). The first order Fourier coefficient (Δ11/σ(Δ11)) is found to be
0.0823 (smaller than 1.5σ the limit). The first order Fourier probability (P>( Δ1)) is found to be 0
(Smaller than 0.15 i.e.,15%). Except first order Fourier coefficient and chi-square probability, other statistical tests suggest anisotropy. Isotropy in the first order Fourier coefficient test suggests that the direction of departure from isotropy.
The statistics of the φ-distribution of galaxies of Supercluster S [227+006+0078] is shown in the Table 1. The statistics for the azimuthal angle distribution in this sample shows that the value of chi-square probability (P(>χ2)) to be 0.0 i.e.,
0(Smaller than the significant level 0.050 i.e., 5.0%). The auto-correlation coefficient (C/C(σ)) is found to be 5.681 (greater than 1σ limit). The first
Statistics Polar
angle(θ)
Azimuthal angle
()
P(>χ2) 0.045 0.000
C/C(σ) 0.688 5.681
11/(11) 0.823 -1.894
121 order Fourier coefficient (Δ11/σ(Δ11))is found to be
-1.894 (smaller than 1.5σ the limit). The first order Fourier probability (P>( Δ1)) is found to be 0.0
(Smaller than 0.15 i.e., 15%). Except first order Fourier coefficient, other statistical tests suggest anisotropy. Isotropy in the first order Fourier coefficient test suggests that the direction of departure from isotropy.
0 20 40 60 80 100
-10 0 10 20 30 40 50 60
observed expected cosine
nu
m
be
r
of
ga
laxi
es
polar angle()
-100 -80 -60 -40 -20 0 20 40 60 80 100 -20
0 20 40 60 80 100 120 140 160
observed expected average
N
umbe
r
of
ga
lax
ies
azimuthal angle()
Fig. 2: The polar () and azimuthal () angle distributions of galaxies in the Supercluster S[227+006+0078]. The solid line represents the expected isotropic distributions. The dash lines represent the cosine and average distributions respectively. The solid circles with ±1 error bars are represent the observed distribution.
4. Conclusion
We have studied the preferred alignment of spin vector orientation of 1218 SDSS galaxies of
Supercluster S [227+006+0078] that have redshift in the range 0.07 to 0.09. We used the method proposed by Flin & Godlowski [12] in order to compute two-dimensional data to three dimensional galaxy rotation axis (polar & azimuthal angles). We have carried out random simulation by creating 107
virtual galaxies and adopting the method proposed by Aryal & Saurer [15] in order to find theoretical distribution of galaxy rotation axes. We have compared the differences between theoretical distributions and observed distributions using three statistics, namely chi-square, auto-correlation and the Fourier. The distribution of spin vector and spin vector projections of total SDSS galaxies that have redshift in the range 0.07 to 0.09 are found to be random in all samples, our results support Hierarchy model [2].
However, a local effect that causes the humps and dips in the angular momentum distribution is observed in different samples. In the deep field, density fluctuation is expected and observed in the local scale. Existence of Superclusters in the region of interest cannot be ruled out. We have used equatorial system as a physical reference in order to study non-random effects concerning galaxy orientation. Hierarchy model predicts that the choice of co-ordinate system do not alter preferred alignments.
References
[1] G. Gamow, E. Teller, On the origin of great
Nebulae, Phys. Rev. 55 (1939) 654. https://doi.org/10.1103/phys Rev.88.654.
[2] P. J. E. Peebles, Origin of the angular momentum of Galaxies, The Astrophysical Journal 155(1969)393.
http://adsabs.harvard.edu/full/1969ApJ...155..393P [3] V. Weizsaker, The evolution of Galaxies and stars,
The Astrophysical Journal 114 (1951) 165. https://adsabs.harvard.edu/full/1951
Apj..114..165V.
[4] G. Gamow, The role of Turbulence in the Evolution of the Universe, Phys. Rev. 86 (1952) 251. https://doi.org/10.1103/phys Rev.88.251. [5] D. G. York, J. Adelman, J. E. Anderson, The Sloan
Janak Ratna Malla / BIBECHANA 17 (2020) 117-122
122 [6] S. Codis, A. Jindal, N. E. Chisari, D. Vibert, Y.
Dubois, C. Pichon, J. devriendt, Galaxy orientation with the cosmic web across cosmic time, Monthly Notices Royal Astron. Soc. Monthly 481 (2018) 4753-4774.
https://academic.oup.com/mnras/articleabstract/48 1/4/4753/5104417redirected
[7] P. Pajowska, W. Godłowski, Z. H. Zhu, J. Popiela, E. Panko, P. Flin, Investigation of the orientation of galaxies in clusters: the importance, methods and results of research, Journal of Cosmology and Astroparticle Physics 02 (2019) 005. https://doi.org/10.1088/1475-7516/2019/02/005 [8] A. G. Doroshkevich, The orientation of rotation of
galaxies, Astrophysical Letters 14 (1973) 1113. [9] A. G. Doroshkevich, S. F. Shandarin, Spatial
structure of protoclusters and the formation of Galaxies, Monthly Notices Royal Astron. Soc. 184(1978)643–660.
https://doi/10.1093/mnras/184.3.643. [10] L. M. Ozernoy, M. S. Longair, J. Einasto, Large
scale structure of the Universe, IAU Symp. 79 (1978) 409.
[11] R. Stein, Galaxy formation from Primordial Turbulence, Astron. & Astrophys. 35 (1974) 17 -29.
https://adsabs.harvard.edu/full/1974.26 A..35..175. [12] P. Flin, W. Godlowski, The Orientation of Galaxy
Groups and formation of the local Supercluster, Monthly Notices Royal Astron. Soc. 222 (1986) 525. https://doi.org/10.1093/mnras/222.3.525
[13] E. Holmberg, On the apparent diameters and the orientation in space of extragalactic Nebulae, Medd. Lund. Astron. Obs. 117 (1946) 3-82. [14] J. Heidmann , N. Heidmann , G. de Vaucouleurs,
Inclination and absorption effects on the apparent diameters, optical luminosities and neutral hydrogen radiation of galaxies-III. Theory and applications, Memories of the Royal Astron. Soc.75 (1972) 121.
[15] B. Aryal, W. Saurer, Comments on the expected isotropic distribution curves in the galaxy orientation studies, Astronom. Astrophys. lett. 364 (2000)L97-L100.
![Fig. 2: The polar () and azimuthal () angle distributions of galaxies in the Supercluster S[227+006+0078]](https://thumb-us.123doks.com/thumbv2/123dok_us/8977432.1886800/6.612.92.279.207.539/fig-polar-azimuthal-angle-distributions-galaxies-supercluster-s.webp)
