Http://www.ijetmr.com©International Journal of Engineering Technologies and Management Research [198]
INVESTIGATION OF COUNTER-CURRENT FLOW LIMITATION FOR
AIR-WATER IN A PWR HOT LEG EXPERIMENTAL LOOP FOR
DIFFERENT GEOMETRY
Youssef Morghi 1, Amir Zacarias Mesquita *1, Jesus Puente 2, Ana Rosa Baliza 3
1
Centro de Desenvolvimento da Tecnologia Nuclear (CDTN/Cnen - MG), Av. Presidente Antônio Carlos, 6.627, Campus da UFMG – Pampulha, 31270-901 Belo Horizonte - Minas Gerais, Brasil
2
Centro Federal de Educaçao Tecnologica Celso Suckow da Fonseca, Cefet Campus Angra dos Reis – RJ, Brasil
3
Eletrobrás Termonuclear S.A. – Eletronuclear, Rodovia Procurador Haroldo Fernandes Duarte - BR101/RJ,S/N km 521,56 – Itaorna
Abstract:
Gas/liquid two-phase stratified flows in horizontal channels are frequently encountered in nuclear reactors, oil and gas pipelines, steam generators, refrigeration equipment, reflux condensers, packed columns, and heat pipes. The phenomenon known as countercurrent flow limitation, or flooding, is the limiting condition where the flow rates of neither the gas nor the liquid can be further increased without changing the flow pattern. This is the condition where the maximum air mass flow rate at which the down-flowing water mass flow rate is equal to the inlet water mass flow rate. This limiting condition, also known as onset of flooding, can occur in vertical or horizontal geometry. This work is a review of recent experimental investigations of countercurrent flow limitation (CCFL) for various hot-leg geometries of pressurized water reactors (PWRs). We compare results with those obtained from the Nuclear Technology Development Centre (CDTN) in 2005. Recent experimental results in the literature are in good agreement with the 2005 findings.
Keywords: CCFL; Flooding; Deflooding; Two-Phase Flow; LOCA; SBLOCA; PWR; Hot Leg.
Cite This Article: Youssef Morghi, Amir Zacarias Mesquita, Jesus Puente, and Ana Rosa
Baliza. (2018). “INVESTIGATION OF COUNTER-CURRENT FLOW LIMITATION FOR AIR-WATER IN A PWR HOT LEG EXPERIMENTAL LOOP FOR DIFFERENT
GEOMETRY.” International Journal of Engineering Technologies and Management
Research, 5(2), 198-212. DOI: https://doi.org/10.29121/ijetmr.v5.i2.2018.164.
1. Introduction
Http://www.ijetmr.com©International Journal of Engineering Technologies and Management Research [199]
1996; Kang et al., 1999; Navarro, 2005; Wintterle et al., 2008; Deendarlianto et al., 2010; Miniami et al., 2010; Al Issa, 2014). CCFL can occur in the hot-leg of a PWR reactor during a loss of coolant accident (LOCA), a small break loss of coolant accident (SBLOCA), or during a loss of residual heat removal in the system (loss of RHR).
The Three Mile Island accident in 1979 highlighted the importance of CCFL for reactor safety. Because of CCFL, no coolant flowed from the pressurizer to the primary circuit during the accident at Unit 2.
CCFL has been extensively studied over the past several decades, with various experimental facilities having been built to study the phenomenon. These experimental facilities have the same characteristics as a PWR hot leg. We performed a review of the CCFL literature based on experimental and analytical results regarding CCFL with different scaling and geometric characteristics, and with various liquid and air velocities.
2. Materials And Methods
2.1.The Onset of Countercurrent Flow Limitation (CCFL) or Flooding Phenomenon
CCFL occurs when liquid and gas flow in opposite directions. A stratified countercurrent flow gas and liquid is only stable for a certain range of mass flow rates. If the gas mass flow rate increases too much, the liquid flow stops, is carried over by the gas, and flows partially or completely in the opposite direction.
CCFL onset corresponds to the limiting condition where neither the gas nor the liquid flow rates can be further increased without changing the flow pattern and limiting the liquid flow rate (Wongwises, 1996, 1998a; Navarro, 2005). Alternatively, CCFL onset can be thought of as the limiting point of stability of the countercurrent flow indicated by the maximum air mass flow rate at which the down-flowing water mass flow rate is equal to the inlet water mass flow rate (Deendarlianto et al., 2008). This limiting condition, known also as onset of flooding, can occur in vertical or horizontal geometry.
Http://www.ijetmr.com©International Journal of Engineering Technologies and Management Research [200]
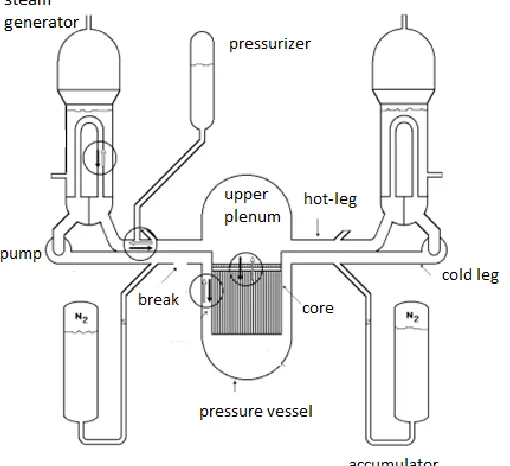
Figure 1: Typical places where a CCFL can occur in a PWR facility (Navarro 2005).
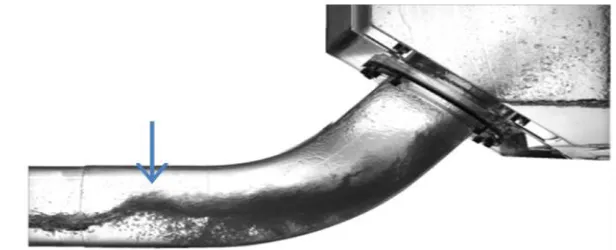
Experiments have shown that CCFL takes place when gas velocity increases. Disturbances begin to appear at the liquid-gas interface. Small waves initiate and grow. Finally, there is the appearance of instabilities, hydraulic jump, wave growth, droplet entrainment, and chaotic interface movement (Figs. 2, 3, 4, 5).
Figure 2: The appearance of hydraulic jump near the water exit (Al Issa and Macian, 2014).
Http://www.ijetmr.com©International Journal of Engineering Technologies and Management Research [201]
.
Figure 4: A wave near the bend (Al Issa and Macian, 2014)
Figure 5: Droplets (Al Issa and Macian, 2014)
2.2.Experimental Investigations
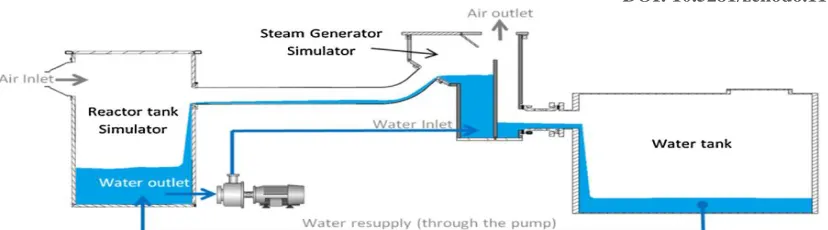
To investigate CCFL, many experimental systems have been built (Fig. 6, 7, 8) (Navarro 2005, Deendarlianto et al. 2011, Al Issa and Macian, 2014). Water and air, at room temperature and atmospheric pressure, are the working fluids. The arrangements use similar experimental systems to change the geometrical characteristics and velocities of gas and water. These experimental systems have the same characteristics as a PWR hot leg.
After the onset of flooding, a portion of the water is impeded by the air, precipitates in the lower tank, and accumulates in the right side of the upper tank until reaching a level defined by a separator plate (H).
Http://www.ijetmr.com©International Journal of Engineering Technologies and Management Research [202]
Figure 6: Diagram of experimental circuit (Navarro 2005).
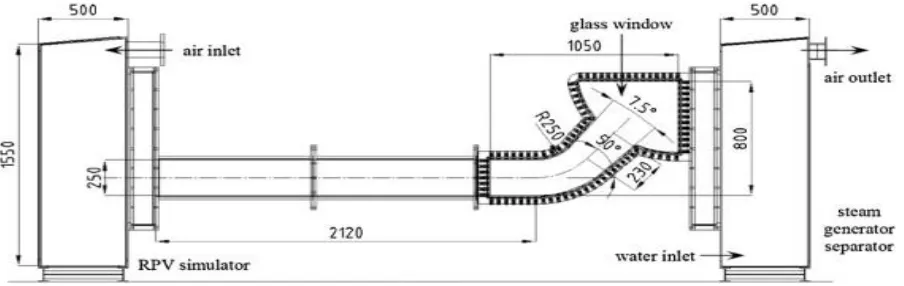
Deendarlianto et al. (2011) used a horizontal rectangular channel to an inclined riser as a model of a PWR hot leg. The flow was captured by a high-speed camera in the bent region of the hot leg during a series of flooding and deflooding experiments. Owing to the rectangular cross-sectional geometry, pictures of the flow provided a detailed view of the stratified interface as well as of the distribution of dispersed structures (droplet and bubbles). CCFL, or the onset of flooding, was found by analyzing the water levels measured in the separators.
Figure 7: Schematic view of the hot leg model test section (Deendarlianto, et al, 2011).
Http://www.ijetmr.com©International Journal of Engineering Technologies and Management Research [203]
Figure 8: A cross section in COLLIDER showing water and air flow directions (Al Issa and Macian, 2014).
Other important investigations of CCFL in a flow path, consisting of a horizontal tube connected to an inclined riser, are displayed in Table 1 (Deendarlianto et al., 2011).
Table 1: Dimensions of the hot-leg geometry in so previous CCFL investigations
CCFL Investigati
ons
L(m) D
(mm )
I θ L/D I/D JG
(m/s)
JL
(m/s)
Geometry
Ohnuki et al. (1988)
0.01- 0.4 26- 76 0.038- 0.6 40 45 0.38-5.9 1.5- 11.76 Air 0.6-9.6 (D=26) 4.3-100 (D=51) 7.1-12.4 (D=76) Steam 7.3 (D=51) 7.74-17.9 (D=76) 0-0.34 0-0.124 0-0.083 Circular Wongwises (1996) 0.55 7|0.8 32|1. 41| 2.82
64 1.215 50
75 90 8.7 13 22 44
19 2.2-15.4 0|0.0124|0.02
48| 0.0311
Circular
Kang et al. (1999)
0.7-3.38 8
40 0.0648 35
17.5-84.7
16.2 0.3316-9.2840 0.013-0.2255 Circular
0.92 8-3.38 8
80
0-0.623 0-0.3 5 11.6-42.3 5
7.79 0.7985-6.1009 0.0033-0.3747 Circular Navarro (2005) 0.1|0. 30.5| 0.8
54 0.1|0.3 |0.5 30| 50| 70| 90 1.85-14.8 1.85-9.26
0.6-8 0.022-0.22 Circular
0.35| 0.8
36 0.35|0. 8
50 9.72-22.2 2
9.72-22.22
0.6-8 0.022-0.22 Circular
0.42| 0.8
44 0.1 50
9.54-18.1 8
Http://www.ijetmr.com©International Journal of Engineering Technologies and Management Research [204] Deendarlian
to et al. (2010)
2.12 50 0.23 50 8.48 0.92 0.18-0.34kg/s 0.1-0.9 kg/s Rectangula r
Miniami et al. (2010)
0.43 50 0.6 50 8.6 12 0-7.4 0.09|0.17|0.2
6
Circular
Al Issa and Macian, (2014)
1.8 190 0.356 50 9.47 1.87 Δ JG
*0,5 = 0,01 for almost a constant time periods (≈30s)
0.085-0.305 Circular
These experimental results are used to predict a flooding equation. The most frequently used correlation for flooding was given by Wallis (1961). He expressed his experimental data, obtained in circular vertical sections, as follows:
(𝑗𝐺∗)1⁄2+ 𝑀(𝑗 𝐿∗)
1 2
⁄ = 𝐶 (1)
Where 𝑗𝐺∗ And 𝑗𝐿∗ are the dimensionless superficial velocities of gas (air) and liquid (water), respectively. For the phase K, this gives:
𝑗𝐾∗ = 𝑗𝐾√𝑔𝐷(𝜌𝜌𝐾
𝐿−𝜌𝐺) (2)
where Jk is the superficial velocity of the k-phase (k = l (liquid); k = g (gas)), ρk is the respective
density, D is the characteristic length of the flow channel (D = diameter for circular sections), and g is the gravitational constant. In this model, M and C are constants, which are adjusted to the experimental results. In the Wallis experiments, M assumed values from 0.8 -1.0, and 0.7 < C < 1. This correlation has been used frequently by investigators to correlate experimental results obtained not only in vertical pipes, but in other geometric forms and constants assuming the following ranges: 0.6 < M < 1.2 and 0.3 < C < 1.
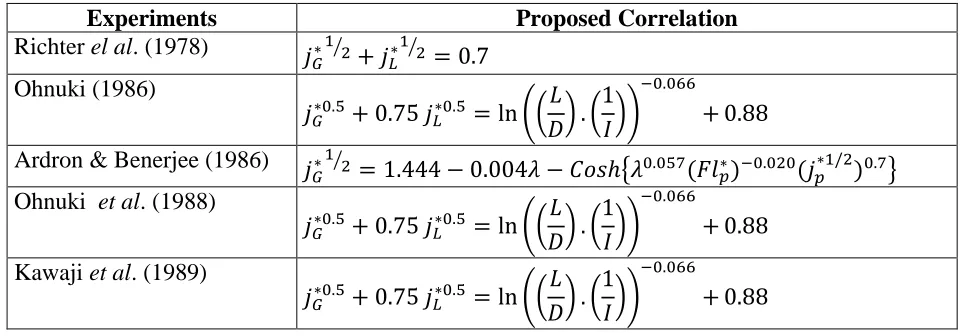
Some important investigations of flooding in a flow path consisting of a horizontal tube connected to an inclined riser, are listed in Table 2. (Al Issa and Macian, 2011).
Table 2: Investigations of flooding in a flow path with a horizontal tube connected to an inclined riser.
Experiments Proposed Correlation
Richter el al. (1978) 𝑗
𝐺∗ 1 2⁄ + 𝑗𝐿∗1 2⁄ = 0.7 Ohnuki (1986)
𝑗𝐺∗0.5+ 0.75 𝑗𝐿∗0.5= ln ((𝐿 𝐷) . (
1 𝐼))
−0.066
+ 0.88
Ardron & Benerjee (1986) 𝑗
𝐺∗ 1 2⁄ = 1.444 − 0.004𝜆 − 𝐶𝑜𝑠ℎ{𝜆0.057(𝐹𝑙𝑝∗)−0.020(𝑗𝑝 ∗1/2
)0.7} Ohnuki et al. (1988)
𝑗𝐺∗0.5+ 0.75 𝑗𝐿∗0.5= ln ((𝐿 𝐷) . (
1 𝐼))
−0.066
+ 0.88
Kawaji et al. (1989)
𝑗𝐺∗0.5+ 0.75 𝑗𝐿∗0.5= ln ((𝐿 𝐷) . (
1 𝐼))
−0.066
Http://www.ijetmr.com©International Journal of Engineering Technologies and Management Research [205]
Wongwises (1996) 𝑗𝐺∗0.5+ 0.798 𝑗𝐿∗0.5= 0.619
Chun and Yu (1999)
𝑗𝐺∗0.5+ 0.397𝑗𝐿∗0.5 = 0.603 − 0.00234 (𝐿 𝐷)
Kang et al. (1999)
𝑗𝐺∗0.5+ 0.397𝑗𝐿∗0.5 = 0.603 − 0.00234 (𝐿 𝐷)
Navarro (2005) 𝑗𝐺∗0.5+ 0.2452𝑗𝐿∗0.5= 0.5963 − 1.17𝑗𝐿∗
Minami et al. (2010) 𝑗𝐺∗0.5+ 0.64𝑗𝐿∗0.5= 0.7
Deendarlianto et al. (2008, 2011)
𝑗𝐺∗0.5+ 0.64𝑗𝐿∗0.5= 0.58
Al Issa and Macian, (2014)
𝑗𝐺∗ 1 2⁄ + 𝛼0(0.38 + 4.14 exp (− 𝛼0
0.14)) 𝑗𝐿
∗ 1
2 ⁄
= 0.6𝛼00.6− 0.00234𝐿 𝐷 ,
3. Results and Discussions
Navarro (2005) performed several experiments with various hot-leg geometries for the bend and riser connecting to the upper tank (Fig. 3). These experiments include various water and air flow rates for each test section configuration (LH, LI, D, θ, H, Table 1). Table 1 also shows the ranges
of superficial velocities of the injected and precipitated water (JL, JLi), and of the air (JG). Navarro
(2005) verified that:
a) The onset of flooding does not depend only on the dimensional characteristics of the test section, but also depends on the injected water flow rate. Depending on this flow rate, various mechanisms may lead to onset of flooding, which can occur at different positions of the test section: at the horizontal pipe, close to the bend at low flow rates, due to formation of a hydraulic jump; at the lower end at intermediate flow rates, with the formation of a slug in this position; and at the upper extremity, due to area reduction of air flow at higher injected flow rates.
0.0 0.1 0.2 0.3 0.4 0.5
0.35 0.40 0.45 0.50 0.55 0.60 0.65
jgi*1/2 jgt*1/2
onset of flooding
zero liquid penetration j gi
*1
/2 , j
gt
*1
/2
jli*1/2
LH=0,5m
L
I=0,1m
D=0,054m m
Http://www.ijetmr.com©International Journal of Engineering Technologies and Management Research [206]
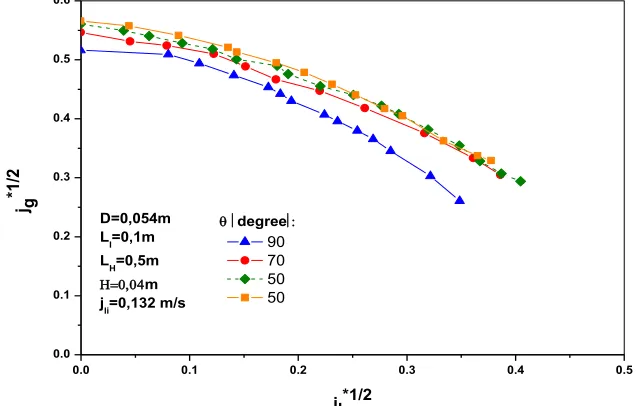
b) The limitation phase with partial delivery, however, does not depend on injected water flow rate, and is influenced only by the dimensional characteristics of the test section. From the analysis of the influences of the geometric characteristics of the test section on the flooding curve with partial delivery, the following conclusions are drawn: for a fixed air velocity, an increase in the horizontal length or in the inclined length of the flow channel provokes an increase in the amount of water carried out by the air, while an increase of diameter leads to a decrease of the carried water. Little difference was observed among the curves with inclinations lower than 90º. For this inclination, however, the amount of carried water tends to be larger than that of other angles for a fixed air velocity.
0.0 0.1 0.2 0.3 0.4 0.5
0.0 0.1 0.2 0.3 0.4 0.5 0.6
90 70 50 50 j g
*1
/2
jl*1/2
D=0,054m LI=0,1m LH=0,5m
m
jli=0,132 m/s
degree
Figure 10: Effect of inclined length of the test section on partial delivery (Navarro, 2005).
0.0 0.1 0.2 0.3 0.4 0.5
0.0 0.1 0.2 0.3 0.4 0.5 0.6
jg*1/2=-1.1232jl* - 0.2212jl*1/2
+ 0.5649 r2
= 0.9961 j g
*1
/2
jl*1/2 LI=0.1m
LH=0.5m D=0.054m = 50°
m
Http://www.ijetmr.com©International Journal of Engineering Technologies and Management Research [207]
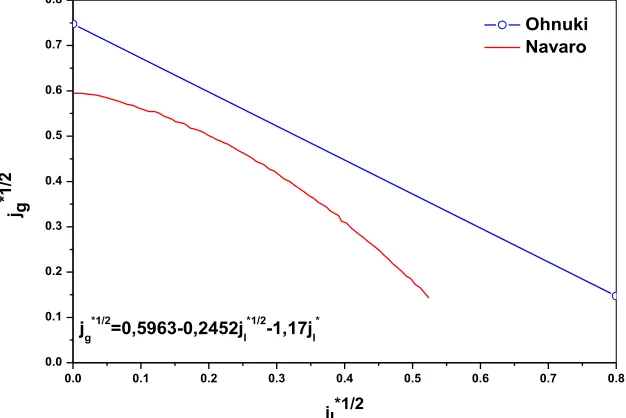
c) A new flooding correlation was derived by regression through the experimental points in the dimensional ranges: 1.85 < LI/D < 9.25; 1.85 < LH/D < 22.2; 30º < θ < 90º. Although the developed correlation had been obtained from experiments in small scale reproductions of hot legs of PWRs, for (j∗g)1/2 < 0.5, the model presents reasonable agreement with experimental results obtained in the real scale of a PWR, and for jg*1/2 > 0.45. It agrees well with the model obtained by Kim et al. (2001) by regression through experimental results of several investigators.
0.0 0.1 0.2 0.3 0.4 0.5 0.6 0.7 0.8
0.0 0.1 0.2 0.3 0.4 0.5 0.6 0.7 0.8
Ohnuki Navaro
j g
*1
/2
jl*1/2
jg*1/2=0,5963-0,2452jl*1/2-1,17jl*
Figure 12: Comparison of the Navarro model with the Ohnuki model, applied to the dimensions of a PWR hot leg (Navarro, 2005).
Miniami et al. (2010) studied CCFL in hot-leg geometry that had characteristics according to Table 1.
CCFL characteristics were found to be strongly connected with flow patterns. Two partial delivery lines with different Wallis constants were identified: an inclined line and a horizontal line. The difference comes from different CCFL mechanisms that occur at the riser and at the horizontal segment (Fig. 10).
Http://www.ijetmr.com©International Journal of Engineering Technologies and Management Research [208]
Figure 14 shows that the CCFL mechanism depends upon water flow rate in the Minami experiments.
Figure 14: Flow pattern map while increasing gas velocity (Minami et al., 2010).
During the experiment, different flow patterns along with a pattern map while increasing gas velocity were observed.
Figure 15: Various flow patterns while increasing gas velocity (Minami et al., 2010).
Deendarlianto et al. (2010) showed that initiation of flooding coincides with formation of liquid slugs that develop near the bend. The onset of flooding is affected by system pressure: the higher the system pressure, the higher the air mass flow rate needed to initiate flooding. Moreover, a slight hysteresis was found between the flooding and deflooding experiments that increases for higher water flow rates (Figure 16).
0.00 0.25 0.50 0.75 1.00
0.20 0.25 0.30 0.35 0.40 0.45
^mL,D[kg/s]
0,3 MPa 0,15 MPa
^m
G
[kg
/s]
0.0 0.1 0.2 0.3
0.4 0.5 0.6 0.7 0.8
(JL,D*) 1/2
[-]
0,15 MPa 0,3 MPa
(
JG
*)
1/2[-]
Figure 16: Experimental flooding data for system pressures of 0.15 and 0.30 MPa (Deendarlianto
Http://www.ijetmr.com©International Journal of Engineering Technologies and Management Research [209]
0.00 0.25 0.50 0.75 1.00
0.15 0.20 0.25 0.30 0.35 0.40 0.45
^mL,D[kg/s]
Flooding Deflooding
^m
G
[k
g/
s]
Figure 18: Flooding and deflooding points in experiments performed at system pressure of 0.30 MPa (Deendarlianto et al., 2010)
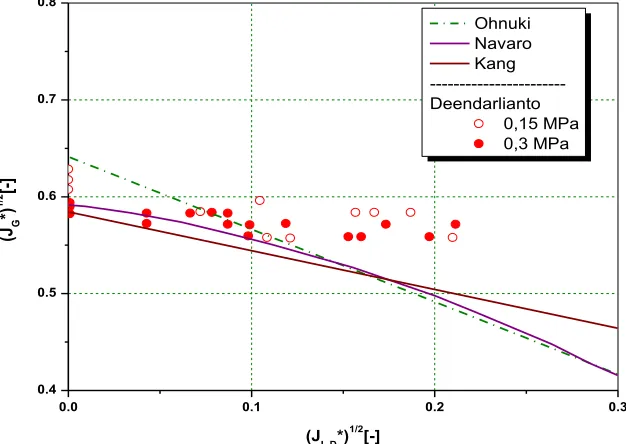
These experimental data were compared with some CCFL correlations for various pipe system geometries found in the literature (Fig. 15). For this comparison, we see that the Wallis-parameter (j*k) can be applied to rectangular cross-sections by using the channel height as
length, instead of the diameter.
0.0 0.1 0.2 0.3
0.4 0.5 0.6 0.7 0.8
(JL,D*)1/2[-]
Ohnuki Navaro Kang ---Deendarlianto 0,15 MPa 0,3 MPa
(J G
*)
1/2 [-]
Figure 19: Comparison between some correlations
Http://www.ijetmr.com©International Journal of Engineering Technologies and Management Research [210]
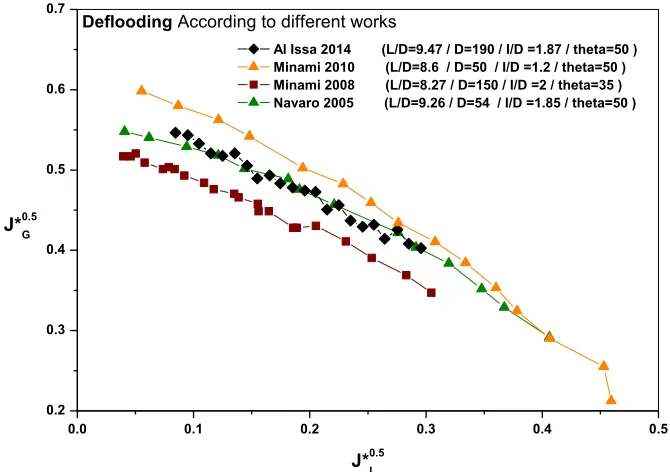
A summary of experimental onset of CCFL curves (or flooding curves) and deflooding curves for all experiments discussed are shown in Figures 20 and 21.
0.0 0.1 0.2 0.3 0.4 0.5 0.6 0.7
0.0 0.1 0.2 0.3 0.4 0.5 0.6 0.7
J*0.5G
J*0.5L
Al Issa 2014 (L/D=9.47 / D=190 / I/D =1.87 / theta=50 ) Deedarlianto 2011 3 bar (L/D=8.48 / D=250 / I/D =1.81 / theta=50 ) Minami 2010 (Horizontal CCFL) (L/D=8.6 / D=50 / I/D =1.2 / theta=50 ) Minami 2010 (L/D=9.47 / D=750 / I/D =1.87 / theta=50 ) Navaro 2005 (L/D=9.26 / D=54 / I/D =1.85 / theta=50 ) Kang 1999 (L/D=25.0 / D=80 / I/D =7.8 / theta=35 ) Wongwises 1996 (L/D=22.0 / D=64 / I/D =7.8 / theta=50 )
Onset of CCFL According to different works
Figure 20: Onset of CCFL according to various publications
The results of Navarro (2005) show good agreement with all other experiments, including the results for rectangular cross-section (Deedarlianto et al., 2011).
0.0 0.1 0.2 0.3 0.4 0.5
0.2 0.3 0.4 0.5 0.6 0.7
J*0.5 G
J*0.5L
Al Issa 2014 (L/D=9.47 / D=190 / I/D =1.87 / theta=50 ) Minami 2010 (L/D=8.6 / D=50 / I/D =1.2 / theta=50 ) Minami 2008 (L/D=8.27 / D=150 / I/D =2 / theta=35 ) Navaro 2005 (L/D=9.26 / D=54 / I/D =1.85 / theta=50 )
Deflooding According to different works
Figure 21: Deflooding limit derived from various experiments
Http://www.ijetmr.com©International Journal of Engineering Technologies and Management Research [211]
4. Conclusions & Recommendations
The air–water countercurrent flow limitation has been investigated worldwide in many geometries of PWR hot legs in various experimental set-ups (velocity of air, velocity of water, pressure).
Flooding correlation was proposed in many studies. The Wallis equation was developed using circular vertical sections. However, it has been used for circular horizontal sections according to Deendarlianto et al., (2011). The Wallis-parameter can be applied to rectangular cross-sections using the channel height as length, instead of the diameter.
Comparing recent results to those of Navarro (2005), for flooding and deflooding curves, we observe good agreement between recent studies and those of Navarro (2005). Any differences that are observed are probably due to different experimental set-ups and geometrical parameters.
Acknowledgements
This work was supported by the following Brazilian institutions: Nuclear Technology Development Centre (CDTN), Brazilian Nuclear Energy Commission (Cnen), Research Support Foundation of the State of Minas Gerais (Fapemig), Brazilian Council for Scientific and Technological Development (CNPq, program PEC-EG), Coordination for the Improvement of Higher Education Personnel (Capes), Federal Center for Technological Education Celso Suckow da Fonseca (Cefet), and Eletrobrás Termonuclear S.A. (Eletronuclear).
References
[1] Al Issa, S., Macian, R. A review of CCFL phenomenon. Annals of Nuclear Energy. Vol. 38, p. 1795-1819. 2011. DOI: 10.1016/j.anucene.2011.04.021.
[2] Al Issa, S., Macian, R. Experimental investigation of countercurrent flow limitation (CCFL) in a large-diameter hot-leg geometry: A detailed description of CCFL mechanisms, flow patterns and high-quality HSC imaging of the interfacial structure in a 1/3.9 scale of PWR geometry. Nuclear Engineering and Design. Vol. 280, p. 550-563. 2014. DOI: 10.1016/j.nucengdes.2014.08.021. [3] Ardron, K.H., Banerjee, S. Flooding in an elbow between a vertical and a horizontal or
near-horizontal pipe: Part II: Theory. Int. J. Multiphase Flow. Vol. 12 (4), p. 543–558. 1986. DOI: 10.1016/0301-9322(86)90059-5.
[4] Deendarlianto, et al. Erratum to “Experimental study on the air/water countercurrent flow limitation in a model of the hot leg of a pressurized water reactor”. Nuclear Engineering and Design. Vol. 241, p. 3359-3372. 2011. DOI: 10.1016/j.nucengdes.2011.02.028.
[5] Deendarlianto, et al. Gas-liquid countercurrent two-phase flow in a PWR hot leg: A comprehensive research review. Nuclear Engineering and Design. Vol. 243, p.214-233. 2012. DOI: 10.1016/j.nucengdes.2011.11.015.
[6] Deendarlianto, et al. Experimental study on the air/water countercurrent flow limitation in a model of the hot leg of a pressurized water reactor. Nuclear Engineering and Design. Vol. 238, p 3389-3402. 2008. DOI: 1 0.1016/j.nucengdes.2008.08.003.
[7] Gargallo et al. Countercurrent flow limitations during hot leg injection in pressurized water reactors. Nuclear Engineering and Design. Vol.235, p 785–804.2005.
Http://www.ijetmr.com©International Journal of Engineering Technologies and Management Research [212] [8] Kawaji, M., et al. Countercurrent flooding in an elbow between a vertical pipe and a downwardly
inclined pipe. 1989. In: Proceedings of the Fourth NURETH, Karlsruhe, Germany, 20–27. [9] Minami, N. et al. Countercurrent gas-liquid flow in a PWR hot leg under reflux cooling (I) air–
water tests for 1/15-scale model of a PWR hot leg. Journal of Nuclear Science and Technology. 47 (2), 142–148. 2010. DOI: 10.1080/18811248.2010.9711938.
[10] Navarro M.A. Study of countercurrent flow limitation in a horizontal pipe connected to an inclined one. Nuclear Engineering and Design. Vol. 235, p.1139-1148. 2005. 10.1016/j.nucengdes.2005.02.010.
[11] Ohnuki A. Experimental study of countercurrent two-phase flow in horizontal tube connected to inclined riser. J. Nuclear Science and Technology. Vol 23, 219-232. 1986. DOI: 10.1080/18811248.1986.9734975.
[12] Ohnuki A., Adachi, H., Murao, Y. Scale effects on countercurrent gas-liquid flow in a horizontal tube connected to an inclined riser. Nuclear Engineering and Desing. Vol 107, p 283–294. 1988. DOI: 10.1016/0029-5493(88)90036-2.
[13] Vallée, C. et al. Experimental investigation and CFD simulation of horizontal stratified two-phase flow phenomena. Nuclear Engineering and Design. Vol. 238, p. 637-646. 2008. DOI: 10.1016/j.nucengdes.2007.02.051.
[14] Vallée, C. et al. Countercurrent flow limitation in a model of the hot leg of a PWR - Comparison between air/water and steam/water experiments. Nuclear Engineering and Design. Vo. 245, p. 113-124. 2012. DOI: 10.1016/j.nucengdes.2012.01.001.
[15] Wallis, G.B. One-Dimensional Two-Phase Flow. McGraw Hill, New York, p. 320–339. 1969. [16] Wongwises S. Effect of inclination angles and upper end conditions on the countercurrent flow
limitation in straight circular pipes. Int. Commun. Heat Mass Transfer. Vol. 25 (1), p.117-125. 1998a. DOI: 10.1016/S0735-1933(97)00143-7.
[17] Wongwises S. Two-phase countercurrent flow in a model of a pressurized water reactor hot leg. Nuclear Engineering and Design. Vol. 166, p.121-133. 1996. DOI: 10.1016/0029-5493(96)01272-1.
*Corresponding author.