Available Online at www.ijpret.com 105
INTERNATIONAL JOURNAL OF PURE AND
APPLIED RESEARCH IN ENGINEERING AND
TECHNOLOGY
A PATH FOR HORIZING YOUR INNOVATIVE WORK
PCA FUSION WITH IMAGE ENHANCEMENT FOR FACE RECOGNITION
MR. P. V. SONTAKKE1, MR. K. B. KOTANGALE2, MR. S. S. AYANE3
1. Asst. Prof., Pimpri Chinchwad College of Engineering, Nigdi, Pune. 2. Asst. Prof., Pimpri Chinchwad College of Engineering, Nigdi, Pune. 3. Asst. Prof., Pimpri Chinchwad College of Engineering, Nigdi, Pune.
Accepted Date: 21/06/2015; Published Date: 01/07/2015
\
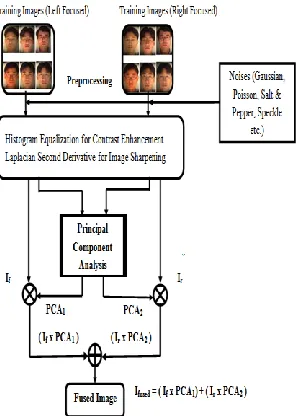
Abstract: - Image fusion is of great importance in biometric applications. This paper presents the PCA based image fusion technique to enhance illumination varying facial images used for face recognition system. Image fusion using Principal Component Analysis has been implemented and demonstrated in MATLAB software. Image enhancement algorithms such as Histogram equalization for contrast enhancement and Laplacian second derivative for image sharpening are applied on the facial image database before the calculation of the PCA component for fusion. For robustness of system various additive and multiplicative noises in the images such as Gaussian, Poisson, Salt and pepper, Speckle are introduced in the images. A comparative study is done with a PCA fusion method and PCA fusion method with image enhancement algorithms. The evaluation is done on the basis of quality parameters calculations, face recognition rate and concludes that the PCA fusion method with image enhancement algorithms shows better performance as compare to rest of the two algorithms.
Keywords: Principal Component Analysis, Image Fusion, Image Enhancement, Noises
Corresponding Author: MR. P. V. SONTAKKE
Access Online On:
www.ijpret.com
How to Cite This Article:
P. V. Sontakke, IJPRET, 2015; Volume 3 (11): 105-112
Available Online at www.ijpret.com 106
INTRODUCTION
Principal Component Analysis Algorithm is a well known algorithm for dimension reduction and feature extraction. It is a way of identifying patterns in data, and expressing the data in such a way as to highlight their similarities and differences. Since patterns in data can be hard to find in data of high dimension, where the luxury of graphical representation is not available, PCA is a powerful tool for analyzing data. The other main advantage of PCA is that once you have found these patterns in the data, and you compress the data, i.e. by reducing the number of dimensions, without much loss of information. It is widely used in image classification and image compression. PCA involves the calculation of the eigen value decomposition of a data covariance matrix or singular value decomposition of a data matrix, usually after mean centering the data for each attribute. Principal component analysis (PCA) involves a mathematical procedure that transforms a number of possibly correlated variables into a smaller number of uncorrelated variables called principal components.
PCA is mathematically defined as an orthogonal linear transformation that transforms the data to a new coordinate system such that the greatest variance by any projection of the data comes to lie on the first coordinate (called the first principal component), the second greatest variance on the second coordinate, and so on. PCA is theoretically the optimum transform for given data in least square terms. For a given set of points in Euclidean space, the first principal component (the eigenvector with the largest eigenvalue) corresponds to a line that passes through the mean and minimizes sum squared error with those points. The second principal component corresponds to the same concept after all correlation with the first principal component has been subtracted out from the points. Each eigenvalue indicates the portion of the variance that is correlated with each eigenvector. Thus, the sum of all the eigenvalues is equal to the sum squared distance of the points with their mean divided by the number of dimensions. PCA essentially rotates the set of points around their mean in order to align with the first few principal components. This moves as much of the variance as possible (using a linear transformation) into the first few dimensions. The values in the remaining dimensions, therefore, tend to be highly correlated and may be dropped with minimal loss of information.
FUSION ALGORITHM:
Available Online at www.ijpret.com 107 are calculated from the Eigen vector corresponding to the largest eigenvalues of the covariance matrices of each source.
Let the source images (image to be fused) be arranged in two-column vectors. The steps followed to project this data into a 2-D subspace are:
1. Organize the data in to column vectors. The resulting matrix Z is of dimension 2 x n.
2. Compute the empirical mean along each column. The empirical mean vector Me has a dimension of 1 x 2.
3. Subtract the empirical mean vector Me from each column of the data matrix Z. The resulting matrix X is of dimension 2 x n.
4. Find the covariance matrix C of X i.e. C=XXT mean of expectation = Cov(X).
5. Compute the eigenvectors V and eigenvalues D of C and sort them by decreasing eigenvalue. Both V and D are of dimension 2 x 2.
6. Consider the first column of V which corresponds to larger eigenvalue to compute N1 and N2 as:
N1= V (1) / ∑V and N2 = V (2) / ∑V (1)
The information flow diagram of PCA-based image fusion algorithm is shown in fig. below. The input images (images to be fused) If(x,y) and Ir(x,y) are arranged in two column vectors and their empirical means are subtracted. The resulting vector has a dimension of n x 2, where n is length of the each image vector. Compute the eigenvector and eigenvalues for this resulting vector are computed and the eigenvectors corresponding to the larger eigenvalue obtained. The normalized components N1 and N2 (i.e., N1 + N2 = 1) are computed from the obtained eigenvector. The fused image is:
Ifused(x,y) = N1 If(x,y) + N2 Ir(x,y) (2)
IMAGE ENHANCEMENT TECHNIQUES:
Histogram Equalization for contrast enhancement
Available Online at www.ijpret.com 108
Fig 1: - Histogram Equalization Process
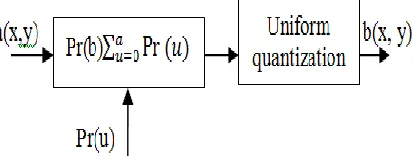
EQUALIZING THE HISTOGRAM:
Input histogram P1 (a) shown as probability density.
First output histogram P2(b)
Cumulative input histogram F1 (a0, increasing from 0 to 1,
Where F (a) =DmF1 (a) has been selected.
Linear cumulative output histogram F2 (b).
LAPLACIAN SECOND ORDER DERIVATIVE FOR IMAGE SHARPENING:
We are interested in isotropic filters, whose response is independent of the direction of the discontinuities in the image to which the filter is applied. Isotropic filters are rotation invariant, in the sense that rotating the image and then applying the filter gives the same results as applying the filter to the image first and then rotating the result.
It can be shown that the simplest isotropic derivative operator is the Laplacian; which, for a function (image) f(x, y) of two variables, is defined as
∆2f = ∂2f
∂x2+
∂2f
∂y2 (3)
Because derivatives of any order are linear operations, the Laplacian is a linear operator.
Available Online at www.ijpret.com 109 G(x,y) = F(x,y) + C*∆2F(x,y)+ (4)
C=1 if centre value of the filter mask is positive.
Else C= -1, F(x,y): image to process.
Mask =
−1 −1 −1
−1 8 −1
−1 −1 −1
Using MATLAB functions:
Result_img= conv2(original_img,mask);
R= Result_img(2: (ht-1), 2 :(wt-1));
Final= Original_img + R
Adding original image to the Laplacian restored the overall intensity variations in the image, with the Laplacian increasing the contrast at the locations of intensity discontinuities. Small details are enhanced and background tonality preserved.
PROPOSED SYSTEM BLOCK DIAGRAM:
Available Online at www.ijpret.com 110
RESULTS:
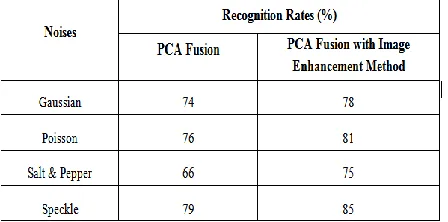
Table 1 (Comparative Recognition Rates)
Table 2: Quality Parameters Calculations
NOMENCLATURE
CORR Correlation
MI Mutual Information
SSIM Measure of Structural Similarity
RMSE Root Mean Square Error
UQI Universal Quality Index
SF Spatial Frequency
PSNR Peak Signal to Noise Ratio
CONCLUSION
Available Online at www.ijpret.com 111 image sharpening is used for different image fusion performance metrics with reference image have been evaluated. The PCA fusion algorithm shows degraded performance but Image fusion with Image enhancement technique shows better performance. Because the change of illumination effect is reduced by Histogram Equalization method, i.e. This Technique uniformly distributes the illumination effect and preserves the entropy of image. And sharpening algorithm is used for sharpening the edges of face images, so that it will increase the accuracy of recognition. Here the Edge and Contrast are the salient features of the facial images; these salient features i.e. Edge is improved by Laplacian Gaussian method and Contrast by Histogram Equalization method, Which results in improvement in recognition rate.
REFERENCE
1. V.P.S. Naidu and J.R. Raol, “Pixel-level Image Fusion using Wavelets and Principal Component Analysis” Defense Science Journal, Vol. 58, No. 3, May 2008, pp. 338-352 Ó 2008, DESIDOC.
2. “A new fusion scheme for multifocus images based on focused pixels detection” by Huafeng Li, Yi Chai, Zhaofei Li, Machine vision and Applications DOI 10.1007/s00138-013-0502-4, Springer-verlag Berlin Heidelberg 2013.
3. “PCA based Image Fusion of Face and Iris Biometric Features” by S. Anu H Nair, P. Aruna & M. Vadivukarassi, International Journal on Advanced Computer Theory and Engineering (IJACTE) ISSN (Print):2319-2526, Volume-1, ussye-2, 2013.
4. “A new fusion scheme for multifocus images based on focused pixels detection” by Huafeng Li, Yi Chai, Zhaofei Li, Machine vision and Applications DOI 10.1007/s00138-013-0502-4, Springer-verlag Berlin Heidelberg 2013.
5. Ujwala Patil, Uma Mudengudi, “Image fusion using hierarchical PCA” by 2011 International Conference on Image Information Processing (ICIIP 2011)
6. http://www.imagefusion.org/
7. Indian face database www.cs.umass.edu/vidit/ face database.
Available Online at www.ijpret.com 112 9. “A new fusion scheme for multifocus images based on focused pixels detection” by Huafeng Li, Yi Chai, Zhaofei Li, Machine vision and Applications DOI 10.1007/s00138-013-0502-4, Springer-verlag Berlin Heidelberg 2013.