Turkish Journal of Fisheries and Aquatic Sciences 17:1089-1098(2017)
www.trjfas.org ISSN 1303-2712 DOI: 10.4194/1303-2712-v17_6_02
RESEARCH PAPER
© Published by Central Fisheries Research Institute (CFRI) Trabzon, Turkey in cooperation with Japan International Cooperation Agency (JICA), Japan
Interpreting the Dynamic Submergence of Tuna Purse Seine: an Alternative
Controllable Study by at-Lake Model Experiment to Sea-Trial
Introduction
Compared to other methods of evaluating a fishing net performance, full-scale sea trials are advantageous in that they provide the actual operation performance of the gear in real working conditions. However, full scale sea trials are very expensive and difficult to complete as the test executive programs in most cases due to so many uncontrollable factors, such as environmental variables, operational parameters, as well as limitations inherent to the observation equipment. These problems can be mitigated by employing physical model tests in tank or natural waters, which are less expensive and require less manpower and material resources, allowing a series of tests under artificially controlled conditions (Kim, 2000; Kim et al., 2007). Model nets can be designed to analyze changes in gear performance under appropriately simulated working conditions based on relevant similarity criteria, so as to predict full-scale net performance during actual operation.
In a previous series of research projects, Konagaya (1966, 1971a, 1971b, 1971c, and 1971d) conducted model tests on purse seines in terms of
sinking performance and the characteristics of different materials, mesh sizes, and hanging ratios; results showed that: 1) a purse seine with smaller d/l (where d is bar diameter, l is half-mesh size) sinks more rapidly than that with larger one; 2) the sinking speed of the bottom margin is proportional to the square root of the leadline weight; 3) a model net with a larger hanging ratio has a higher sinking speed; 4) a purse seine made of higher density netting sinks more rapidly than one made with lower density netting; and 5) the sinking depth of a model net reaches a maximum at 4/10 or 5/10 pursing duration, so standby time should be prolonged up to a certain point before pursing. Kim, Imai, and Park (1995) and Kim and Park (1995) later confirmed that high-density model net material has a better sinking performance than that with lower density one.
In another previous study, Katlandagho and Imai (1986) studied two model mackerel purse seine nets of different scale ratios (A: 1/76.7, B: 1/141.1) based on Tauti’s law, and found that the sinking speeds of the two model nets reached the maximum at 53% and 40% of the shooting duration, respectively, before dropping down. Iitaka (1964) found that the entire leadline edge of model purse seine net sank at the
Hao Tang
1,
Liuxiong Xu
1,2,3,4,*, Cheng Zhou
5,
Xuefang Wang1,2,3,41 College of Marine Sciences, Shanghai Ocean University, Shanghai 201306, P. R. China.
2 National Engineering Research Center for Oceanic Fisheries, Shanghai 201306, P. R. China.
3 Shanghai Collaborative Innovation Center for Oceanic Fisheries, Shanghai 201306, P. R. China.
4 Shanghai Education Commission “Summit and Highland” Discipline Construction for Fisheries Sciences, Shanghai 201306, P. R. China.
5 College of Fisheries, Zhejiang Ocean University, Zhoushan316000, P. R. China.
* Corresponding Author: Tel.: +86.21 61900309; Fax: +86.21 61900304 E-mail: [email protected]
Received 15 November 2016 Accepted 22 March 2017
Abstract
Gear performance evaluation for tuna purse seine using both full-scale sea trials and model testing was designed in the study. A model tuna purse seine of 1:20 scale was constructed and tested in Lake Qiandao, China in 2013; and the field observations of its full-scale net in operation was conducted on board a typical Chinese tuna vessels during 2006; the physical model testing data were then assessed to determine the model’s ability to predict main performance parameters of full-scale net at sea. A generalized linear model (GLM) was employed to standardize and compare sinking performance between the model net and its prototype. It was found that increase in leadline weight or setting speed of net was conductive to improved sinking performance. The leadline weight was the most important controllable factor affecting sinking performance of the purse seine, the sinking speed in wing end position was higher in comparison to that in other position of model net. Though there is likely no fully ideal model net which can be used to accurately predict full-scale at-sea performance, our sea trials and physical model testing showed consistent results, indicating our model testing method can be used as an important complement method to successfully evaluate the purse seine performance at sea.
same ratio. Konagaya (1971d) found that model nets under no current conditions had a greater working depth than those in current, and that model nets deployed at a higher setting speed had a deeper sinking depth than those at lower setting speed. After investigated the sinking performance of small-scale purse seines with different materials and knot types, Widagdo, Lee, and Lee (2015) found that knotless polyester nets showed an optimal diving behavior.
In the above studies, all model tests were carried out using purse seines with large contraction scales based on Tauti’s law. For the sake of design simplicity, model nets are usually manufactured from a large length scale, and/or certain net materials are substituted; simplified model nets can hardly reflect the appropriate characteristics of the full scale one occurred throughout the entire fishing operation process, particularly to the tuna purse seines which are generally up to 2000 m × 300 m (cork line length × stretch depth of the net) in size. With this in mind, we conducted a physical model testing of typical Chinese tuna purse seine at-lake with sizable open water area and adequate water depth. The favorable testing condition of the lake allowed us to test large gear models and utilize advanced instruments to observe gear performance. We manufactured a tuna purse seine model net with length scale equal to 20, mesh size scale and twine diameter equal to 1 based on Tauti’s law, then performed tests to determine the variation regularity of the net’s sinking performance by varying the leadline weight and setting speed. We also compared the results from the model testing and sea trials to investigate the ability of predicting the performance of the full-scale net through the model net.
Materials and Methods
Full-Scale Net
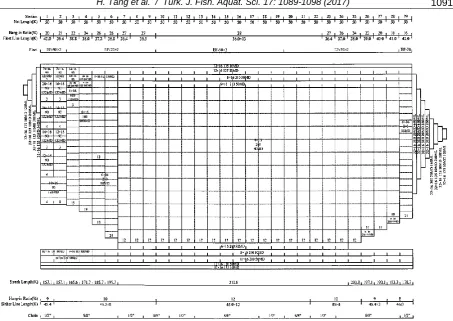
The Chinese tuna purse seiners mainly target skipjack tuna in the Western and Central Pacific Ocean (WCPO). The typical full-scale net used by Chinese tuna purse seiners had 1664.5 m of floatline with buoyancy of 809 kN, 1808.9 m of leadline with sinking weight of 13 kg/m (in air), and 311.1 m of stretched depth. The full-scale net is composed of 29 strips of nylon braided knotted netting panels, with 90 mm mesh sizes for the bunt and 260 mm for the main body. Figure 1 shows details of construction of the tuna purse seine.
Model Net
A 1:20 scale model was constructed by authors based on Tauti’s law (length scale20). In order to maintain the bending stiffness property of the netting twine, the same netting as the full-scale was used to construct the model net. It means that the scales of mesh size and twine diameter between the
model and the full-scale were equal to 1 (1), which lends convenience to the manufacturing process (Xu, Lan, Ye, & Wang, 2011). The fundamental modeling rules used in this paper may be summarized as follows:
Length scale: M F L L
(1)where, LF is the length for full-scale net; LM is the
length for model net.
Diameter and mesh size scale:
M F M F d d a a
(2)where, aF is the mesh size for full-scale net; aM is the
mesh size for model net; dF is the twine diameter for
full-scale net; dM is the twine diameter for model net.
Speed scale: F M M M F F M F M F d d V V
(3)
where, VF is the speed for full-scale net; VM is the
speed for model net; F is the density of netting materials for full-scale net; M is the density of netting materials for model net;
Fis the seawaterdensity;
Mis the fresh water density. Time scale: F M M F V V tt
(4)
where, tF is the time for full-scale net; tM is the time
for model net.
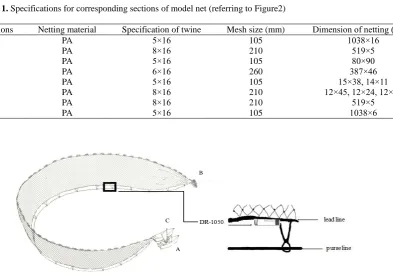
The model net, made of the same nylon strands as the full-scale net, had 80.9 m floatline with an average buoyancy of 25 N/m, 98 m leadline with a sinking weight of 0.663 kg/m (mass of sinker weight per meter), and full stretched depth of 15.6 m. The same hanging ratio was used for the model net to ensure the geometrical similarity in mesh opening of both nets. Figure 2 and Table 1 show the structure specifications of the model net.
Model Testing
m, main engine power 3.68 kW, was used to set the net; boatB (length 5 m, outrigger engine power 2.2 kW) as the skiff pulling aft wing end , boat C (length 6 m) as the net setting platform. Before each setting, the model net was stacked on board boat C, the aft wing end was towed to boat B, and boat A moved in a circular motion with the net (Figure 3).
Ten self-recording depth sensors (RBR DR-1050, Richard Brancker Research Co., Ltd, Canada) were uniformly fixed to the leadline with the main
body as a benchmark, where the DR marked “#5” measured the sinking data for middle point of the main body of the model net, and the DRs marked “#2” and “#9” measured the bunt, and the wing end respectively. The shooting duration was recorded with a stopwatch, and the setting speed was mainly controlled by changing engine revolution of boat A. The model test was carried out at five level of leadline weights (0.531 kg/m, 0.597 kg/m, 0.663 kg/m, 0.729 kg/m, and 0.795 kg/m) and four level of setting
Figure 1. Schematic diagram of the commercial tuna purse seine of braided knotted nylon netting with different large-mesh panels, MD: the number of vertical netting panel, K: unit of length (1 K = 1.515 m).
1 2 3 4 5 6 7 8 9 10 11 12 13
E
X
11
11 E
X
38
38
F X 12
FX
45
F X
24
1
2
3
4
5
6
7
8
A B
D C
G H
speeds (0.85 m/s, 0.95 m/s, 0.75 m/s, and 1.05 m/s), where 0.663 kg/m corresponds to the normal leadline weight of the actual net (Tang, Xu, Wang, Zhou, & Zhu, 2015). Measurement was repeated three times for each level, and a total of 60 trials was carried out during the model testing.
Sea Trials
We conducted full-scale net sea trials on board a typical Chinese tuna purse seiner operated within the EEZ of Papua New Guinea between October-December in 2006, the data obtained from the sea trials were used to validate the physical model testing results. Depth and sinking speed of the full-scale net were recorded by micro temperature depth sensor (TDR-2050, Richard Brancker Research Co., Ltd, Canada, 10 in total). A total of 10 TDRs were used to measure sinking data at different gear sections; the TDR marked “6#”, for example, measured the sinking data of middle point of the main body. The current speed and direction at different water layers were collected by a Doppler current-meter (JLN-628, Japan Radio Company), other data such as shooting duration, setting speed, towing line length, and purse line length, etc., were derived from the fishing operation time points recorded by a timer during sea trials.
Data Processing
First, the two-way analysis of variance
(ANOVA) with interaction was used to determine the variables (setting speed [V0], leadline weight [W]) that
help explain the gear performance of the three positions (bunt, main body, wing end) of the model net. Interaction effects were then evaluated between variables for each ANOVA.
Second, a generalized linear model (GLM) using identity link function with the Gaussian error distribution was used to determine the influence of the relevant factors on the sinking speeds of the main bodies of both the model net and the full-scale net. The variables in the model net included the setting speed (V0) and leadline weight (W). The variables in
the full-scale net included the shooting duration (T), current speed at different layers (V30, V70, V130), the
purse line length (L), the towing line length (L1),
setting speed (V0), the angle of currents between 30 m
and 70 m (A1) water depths and the angle of currents
between 70 m and 130 m(A2) water depths. The
generalized linear model is given by the following expression:
S = a0 + a1X1 +…+ anXn + (5)
where, S is sinking speed of model net or full-scale net, a0 is the constant term, a1…an are estimated
coefficients, X1…Xn are independent variables, and
~ N (0, 2).
Final models were then chosen using backward selection where each of the variables was removed to the base model upon which Akaike’s Information Criteria (AIC) was evaluated; a variable remained in
Table 1. Specifications for corresponding sections of model net (referring to Figure2)
Sections Netting material Specification of twine Mesh size (mm) Dimension of netting (T×N)
A PA 5×16 105 1038×16
B PA 8×16 210 519×5
C PA 5×16 105 80×90
D PA 6×16 260 387×46
E PA 5×16 105 15×38, 14×11
F PA 8×16 210 12×45, 12×24, 12×12
G PA 8×16 210 519×5
H PA 5×16 105 1038×6
purse line lead line
C
B DR-1050
A
test location
the final model if the fit yielded a low AIC. Bootstrap approach was applied to estimate 95% confidence interval of sinking speed (S), the fitted value of sinking speeds obtained from the optimal model were used to estimate the comparative sinking performance between the model net and full-scale net. All of the statistical procedures were performed using the R 2.9.2 statistics software package (www.r-project.org).
Results
Model Testing
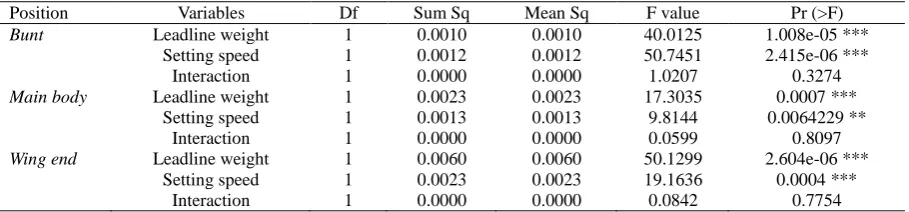
According to the normality test of sinking speed using Shapiro-Wilk’s W statistic (P>0.05), the sinking speeds at the lower margin of the bunt, main body and wing end showed totality in normal distribution. The setting speed and leadline weight were directly related to the sinking speeds at the lower margin of the bunt, main body and wing end, but the interaction items between any two variables had no significant influence on the sinking speeds of the three positions mentioned above (P>0.05). The results are shown in detail in Table 2.
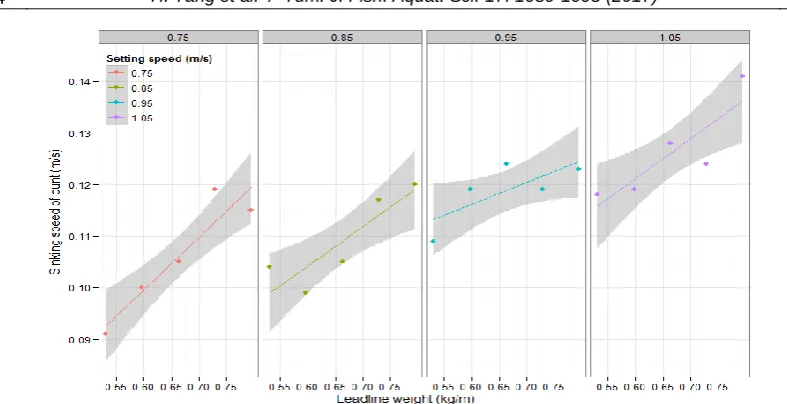
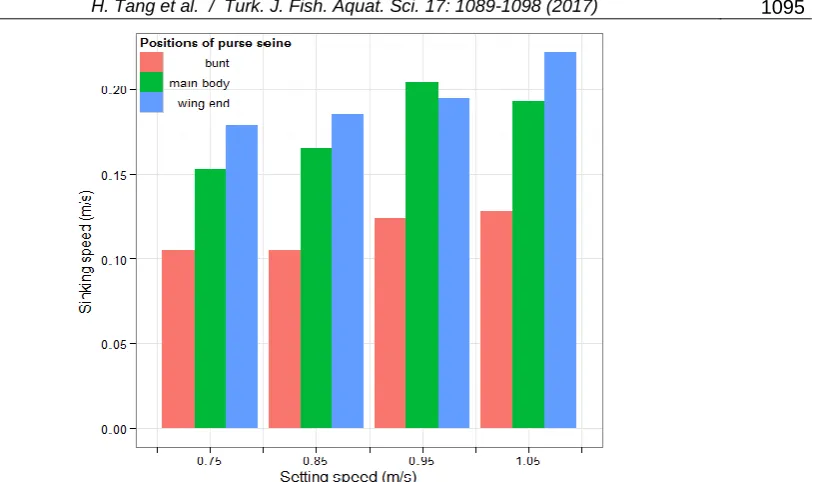
Sinking speed increases at the lower margin of the bunt, main body and wing end were directly related to the leadline weight and setting speed, as indicated in Figure 4, Figure 5 and Figure 6. Average sinking speed at the lower margin of the wing end was 0.199 m/s higher than those of the main body (0.179 m/s) and the bunt (0.115 m/s). Overall, the sinking speeds of three positions measured increased as leadline weight increased, but the greatest differences occurred at setting speed of 0.95 m/s. When at the setting speed of 1.05 m/s, we analyzed the sinking speed at lower leadline weight 0.531kg/m and higher leadline weight 0.795kg/m, and confirmed that the average sinking speed of model net at the higher leadline weight was 20.7% faster than that at lower leadline weight, bunt sank 19.5% faster (Figure 4), main body sank 18.0% faster (Figure 5), and wing end sank 24.6% faster (Figure 6), indicating wing end was most affected by the increase in sinking force.
Concerning the sinking speed trends, we found a consistent change pattern of the wing end for each case. The result showed that leadline weight was the most important factor affecting sinking speed of the
wing end. However, sinking speeds of other positions fluctuated with the leadline weight, indicating other factors, such as setting speed and other fishing parameters, affected the sinking speed.
Influence of setting speed on the sinking speed of different part of the net was different. The sinking speeds at the lower margin of bunt and wing end of the model net were significantly higher at 1.05 m/s setting speed than that at other setting speed level (P<0.05). In general, the sinking speeds of the bunt, main body and wing end tended to increase as setting speed increased (Figure 4, Figure 5 and Figure 6). When the leadline weight was kept at 0.663 kg/m, the sinking speed at setting speed 0.75 m/s and 1.05 m/s showed that the average sinking speed of model net with faster setting speed was 24.1% faster than that at the lower setting speed, the bunt sank 22.3% faster, main body sank 23.5% faster, and wing end sank 26.5% faster, indicating wing end was most affected by the increase in setting speed (Figure 7). These results suggest that increasing the setting speed appropriately enhances the sinking speed of the desired position.
GLM Standardization
The GLM analysis showed that current speed at both 30 m and 70 m, setting speed and current angles had no significant influence on the sinking speed of the full-scale net (P>0.05). The backward stepwise regression analysis showed that AIC value increases if current speed at 70 m and setting speed are eliminated, so they were necessary to establish the optimal model. All statistical analysis results are listed in Table 3.
The backward stepwise regression was examined to identify the relationships between sinking speed and two variables (leadline weight and setting speed) of model net, the result indicated that leadline weight and setting speed were two factors necessary to build the optimal model with the response variable (Table 4).
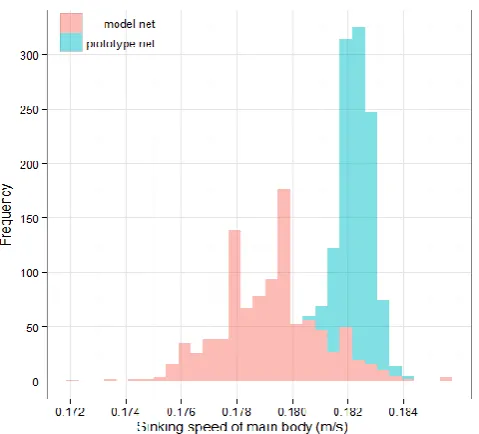
Bootstrap operation showed that the standardized sinking speed of the main body was 0.176-0.182 m/s for the model net and 0.181-0.183 m/s for the full-scale net (Figure 8) within the 95% confidence interval. These observations suggested
Table 2. Two-way analysis of variance with interaction
Position Variables Df Sum Sq Mean Sq F value Pr (>F)
Bunt Leadline weight 1 0.0010 0.0010 40.0125 1.008e-05 ***
Setting speed 1 0.0012 0.0012 50.7451 2.415e-06 ***
Interaction 1 0.0000 0.0000 1.0207 0.3274
Main body Leadline weight 1 0.0023 0.0023 17.3035 0.0007 ***
Setting speed 1 0.0013 0.0013 9.8144 0.0064229 **
Interaction 1 0.0000 0.0000 0.0599 0.8097
Wing end Leadline weight 1 0.0060 0.0060 50.1299 2.604e-06 ***
Setting speed 1 0.0023 0.0023 19.1636 0.0004 ***
Figure 4. The sinking speed of bunt positions (F) with respect to leadline weight at different setting speeds. The lines with different colors represent fitted lines by linear regressions.
Figure 5. The sinking speed of main body positions (M) with respect to leadline weight at different setting speeds.
that the sinking speed of the model net reached about 97.2% that of the full-scale net, indicating fairly consistent in results between from the sea trials and physical model tests.
Discussion
In a similar study, Feng (1990) analyzed the relationship between net setting speed and sinking speed of leadline by a mathematical model and found that the leadline slipped faster into water from the setting platform when setting speed is high. This is considered beneficial in sinking the leadline at sea. We also found that sinking speed increased as the setting speed increased and that average leadline tension varied during model testing at different setting speeds (Figure 7). They are 77.8 N, 66.9 N, 56.8 N and 50.8 N respectively at setting speed of 0.75 m/s, 0.85 m/s, 0.95 m/s and 1.05 m/s. The greater tension was not conducive to sinking the leadline, because the tension direction was toward ship B along the leadline with an upward force component (Figure 3). Basically, we found that higher setting speed was beneficial to the leadline sinking speed in terms of leadline tension.
Leadline weight is one of the most important factors that affect the sinking performance of purse seines (Konagaya, 1971b). Our physical model tests demonstrated that the sinking speed of all lower margin positions along the leadline measured tended to increase as sinking force increased, but there were some differences in the increasing value of sinking speed among different positions of the model net. Misund, Dickson, and Beltestad (1992) found that increased mesh size improves sinking performance, which helps explain the fact that the sinking speed of
the bunt (90 mm mesh size) was considerably lower than that of the wing end (260 mm mesh size).
Thorsteinsson (1973) proposed deploying a second sinker line along the lower edge of the net body to enhance leadline sinking speed, the optimum location of the second sinker line was later investigated by Feng (1997). This approach is however not currently used in tuna purse seines in practice, due to the cost and labor involved in operation. We would instead recommend deploying the sinker appropriately to improve the sinking behavior of the desired position of the tuna purse seine, this should be determined according to actual conditions and the mechanical properties of the fishing vessel.
The GLM analysis found that the current speed at 130 m water layer was an extremely important factor influencing the sinking performance of the tuna purse seine. The current speed at the 130 m layer or above in the Western and Central Pacific Ocean is usually lower (Tang et al., 2013), so would have little influence on purse seine sinking performance until a leap in speed at a deeper layer – this creates greater difficulty at much greater sinking depths, but sinking depth in the first 130 m takes up the vast majority of the sinking process (average sinking depth range is 154.89-164.57 m) at average sinking speed, which ultimately makes no difference in the sinking speed between the full-scale net and the model net.
A problem in physical model testing is the scale-size-effect of model net. Hu, Matuda, and Tokai (2001) corrected the Tauti's law by considering that the net drag coefficient is determined by the Reynolds number based on twine diameter. Scale-size-effect includes both the length scale effect and the mesh size scale effect. The length scale effect depends on
experiment conditions (e.g. flume tank size and model net exact), and affects the converted values. In fact, the Reynolds number has certain effect on experiment results of model net test, because it may result in difference in drag coefficients between model net and its prototype under different experimental conditions However, it was impossible to perform the test fully following the relevant laws due to limitations caused by experimental conditions. In this study, the same
full-scale netting was used to construct the model net, it could satisfy the Reynolds number of full-scale net and model net. In addition, If mesh size, geometrical and mechanical parameters of netting (twine diameter, tenacity) diameter of leadline and floatline, would be selected according with scale factor. It was difficult to find a suitable twine to construct model net. Fridman (1981) proposed that model test for purse seine can be used full-scale netting to construct model net, it
Table 3. The results of generalized linear model and stepwise regression (sea trials of full-scale net)
Factors Estimate Std. Error t value Pr (>|t|) AICa
Intercept 1.77e-01 3.23e-02 5.50 4.7e-07***
Shooting duration (T) 9.98e-05 4.71e-05 2.12 0.0372 * -379
Current speed at 30 m (V30) -5.53e-03 4.24e-02 -0.13 0.8965 -384
The angle of currents between 30m and 70 m (A1) 1.23e-05 4.08e-05 0.30 0.7632 -384
Current speed at 70 m (V70) -2.12e-02 1.41e-02 -1.50 0.1373 -382
The angle of currents between 70 m and 130 m (A2) -1.13e-04 5.12e-05 -2.21 0.0304 * -379
Current speed at 130 m (V130) -2.66e-02 9.29e-03 -2.86 0.0054 ** -376
Purse line length (L) -1.90e-05 7.28e-06 -2.62 0.0106 * -377
Towing line length (L1) -5.04e-05 2.22e-05 -2.27 0.0262 * -379
Setting speed (V0) 3.54e-03 1.91e-03 1.86 0.0670 -381
The optimal model equation for full-scale: S=1.77e-01+9.98e-05* T-2.12e-02* V70-1.13e-04* A2-2.66e-02* V130
-1.90e-05* L -5.04e-05* L1+3.54e-03* V0
aThe AIC value for this model as the designated factor was eliminated. With all factors reserved, AIC is equal to -382
Table 4. The results of GLM and stepwise regression (model testing of model net)
Factors Estimate Std. Error t value Pr(>|t|) AICa
Intercept 0.0377 0.0271 1.39 0.1819
Leadline weight (W) 0.1152 0.0269 4.28 0.0005 *** -115
Setting speed (V0) 0.0724 0.0225 3.22 0.0049 ** -110
The optimal model equation for model net: S=0.0377+0.1152* W+0.0724* V0
aThe AIC value for this model as the designated factor was eliminated. With all factors reserved, AIC is equal to -382
simplified the model net constructing process and maintained the bending stiffness property of the netting twine (Xu et al., 2011). Therefore, we proposed different ideas from previous ones: choosing the same d/a (twine diameter/mesh size) or full-scale netting to construct model net in the case where the geometric similarity could not be satisfied. It was not only a compelling practice, but was more effective at reducing scale effects than scaling down of the model scale. If the model net speed and full-scale speed were equal, the Reynolds number at the small scale was the same.
Purse seine sinking behavior is dependent on gear structure, sea environmental conditions, operation technology, and other factors. In most cases, the purse seine behavior is the results of the combined effect of above-mentioned factors. Many studies such as those discussed in the introduction, have only focused on the influence of certain individual factors. They have not deal with the combined influence caused by differences between multiple variables on the response variable. In view of the complexity of actual sea conditions, we attempted to compare the sea trial results with the model testing results under standardized conditions to predict and then quantify the optimal model results under particular conditions.
The setting speed of the model net was equivalent to the setting speed of the full-scale net calculated based on Tauti’s law, however, due to limitations caused by experimental conditions, it was impossible to carry out the test fully in accordance with the relevant laws. The setting speed of the model net during testing was only about 1/5 that of the full-scale operation, so, again, we used the GLM standardization approach to facilitate comparison of sinking speeds between model and full-scale net under similar conditions.
Queirolo, DeLouche, and Hurtado (2009) applied GLM to provide coefficient estimates for predicting regression models, and evaluated the performance of a new bottom trawl for the crustacean fisheries of central Chile using both dynamic simulation and model testing methods. In order to prevent inaccurate dynamic results as the model was out of range of the similarity law as it pertains to purse seine model experiments. We employed the GLM standardization approach as a mitigation measure to avoid the effect of extraneous factors on sinking speed. Firstly, the relationship between sinking performance and influence factor was presented by a generalized linear model; and second, we predicted the sinking speeds for the main bodies of both a full-scale net and model net based on an optimal model under same conditions, and then estimated their 95% confidence interval of the sinking speed of both by bootstrap method. Results showed that the sinking speed of the model net reached about 97.2% of the full-scale net, indicating that the model net effectively simulated the sinking performance of
the full-scale net.
In conclusion, this study showed that model testing provides valuable knowledge in predicting the sinking performance of full-scale tuna purse seine at sea. Specifically when used properly, we found there was a good agreement between the model testing and full-scale measurement in predicting the main performance parameters of tuna purse seine, such as sinking speed, but the ideal model net with which to accurately predict the full-scale purse seine at-sea performance likely does not exist. The model testing process we used in this study can serve as a complementary approach to purse seine design, it remains necessary to explore in detail whether the sinking trend of different positions of the model net agree with the corresponding positions of the full-scale net, and to confirm the feasibility of comparing these types of results using statistical models.
Acknowledgements
This study was supported financially by the national natural science foundation of China (Grand No. 41506151), the National High Technology Research and Development Program of China (No. 2012AA092302), the Shanghai Education Commission “Summit and Highland” Discipline Construction for Fisheries Sciences (No. B2-5005-13-0001-5), the open funding for the Key Laboratory of Sustainable Exploitation of Oceanic Fisheries Resources (No. A-0209-15-0503-6), and the Public Projects of Research on Technology and Application in Zhejiang Province (No. 2016C33083). We would like to express many thanks to Shimonoseki Research Institute staff of Nichimo Co., Ltd. for their assistance in the schematic diagram of tuna purse seine gear.
References
Feng, W.S. (1990). Experiment research on sinking
characteristic of purse seine leadline. Journal of
Dalian Fisheries University, 5, 37-43.
Feng, W.S. (1997). The distribution of sinking-load of purse
seine. Journal of Fishery Sciences of China, 5(3),
82-87.
Hu, F., Matuda, K., & Tokai, T. (2001). Effects of drag coefficient of netting for dynamic similarity on model
testing of trawl nets. Fisheries science, 67(1), 84-89.
http://dx.doi.org/10.1046/j.1444-2906.2001.00203.x.
Iitaka, Y. (1964). Studies on the mechanical characters of
purse seine in relation to its fishing efficiency (PhD thesis). Kinki University, Higashi-Osaka City, Japan. Kim, H.Y., Lee, C.W., Shin, J.K., Kim HS, Cha, B.J., &
Lee, G.H. (2007). Dynamics simulation of the behavior of purse seine gear and sea-trial verification.
Fisheries Research, 88(1), 109-119.
http://dx.doi.org/10.1016/j.fishres.2007.08.007 Kim, Y.H. (2000). Geometry of the model purse seine in
relation to enclosed volume during hauling operation.
Fisheries and aquatic sciences, 3(2), 156-162. Konagaya, T. (1966). Study on the purse seine-I. Effect of
of Scientific Fisheries, 32(6), 507-510. http://dx.doi.org/10.2331/suisan.32.507.
Konagaya, T. (1971a). Study on the purse seine-II. Effect of
the mesh and the specific gravity of webbing. Bulletin
of the Japanese Society of Scientific Fisheries, 37(1), 8-12. http://dx.doi.org/ 10.2331/suisan.37.8.
Konagaya, T. (1971b). Study on the purse seine-III. On the effect of sinkers on the performance of a purse seine.
Bulletin of the Japanese Society of Scientific Fisheries, 37(9), 861-865.
http://dx.doi.org/10.2331/suisan.37.861.
Konagaya, T. (1971c). Study on the purse seine-IV. The
influence of hanging and net depth. Bulletin of the
Japanese Society of Scientific Fisheries, 37(9), 866– 870.
http://dx.doi.org/10.2331/suisan.37.866.
Konagaya, T. (1971d). Study on the purse seine-V. Effects of the “waiting time” and the underwater current on
the pursing operation. Bulletin of the Japanese Society
of Scientific Fisheries, 37(10), 939-942. http://dx.doi.org/10.2331/suisan.37.939.
Kim, S.J., Imai, T., & Park, J.S. (1995). Characteristics on the motion of the purse seine (1): the sinking behaviour of model purse seine by different netting
material. Journal of the Korean society of Fisheries
Technology, 31(4), 362-371.
Kim, S.J., & Park, J.S. (1995). Characteristics of the motion of a purse seine (2): an analysis of the sinking characteristics of a model purse seine with different
netting materials. Journal of the Korean society of
Fisheries Technology, 31(4), 372-378.
Katlandagho, E.M., & Imai, T. (1986). Fundamental studies
on the fishing efficiency of purse seine (PhD thesis). Kagoshima University, Kagoshima, Japan.
Misund, O.A., Dickson, W., & Beltestad, A.K. (1992). Optimization of purse seines by large-meshed sections
and low lead weight. Theoretical considerations, sinking speed measurements and fishing trials.
Fisheries Research, 14(4), 305-317.
http://dx.doi.org/10.1016/0165-7836(92)90039-V. Queirolo, D., DeLouche, H., & Hurtado, C. (2009).
Comparison between dynamic simulation and physical model testing of new trawl design for
Chilean crustacean fisheries. Fisheries Research,
97(1), 86-94.
http://dx.doi.org/10.1016/j.fishres.2009.01.005. Tang, H., Xu, L.X., Wang, X.F., Zhou, C., & Zhu G.P.
(2015). Performance analysis of a tuna purse seine
model. Journal of Fishery Sciences of China, 22(3),
563-573.
http://dx.doi.org/10.3724/SP.J.1118.2015.14253. Thorsteinsson, G. (1973). Icelandic purse seines with
double leadline-construction and experience.
Proceedings of Technical Conference on Fish Finding, Purse Seining and Aimed Trawling. Reykjavik, Iceland, CFRI Press., 13 pp.
Tang, H., Xu, L.X., Wang, X.F., Zhou, C., Lan, G.C., Wang, M.F., & Ye, X.C. (2013). Evaluation of tuna purse seine performance between from model test and
on-sea measurements. Journal of Fishery Sciences of
China, 20(4), 884-892.
http://dx.doi.org/10.3724/SP.J.1118.2013.00884. Widagdo, A., Lee, C.W., & Lee, J. (2015). Calculating and
Measuring the Sinking Performance of Small-scale Purse Seine Gear in Java, Indonesia, to Improve the
Gear. Fisheries and Aquatic Sciences, 18(2), 221-227.
http://dx.doi.org/10.5657/FAS.2015.0221.
Xu, L.X., Lan, G.C., Ye, X.C., & Wang, M.F. (2011). Effect of the leadline weight and net setting speed on
sinking speed of the tuna purse seine. Journal of
Fisheries of China, 35(10), 1563-1571.