Ferruh Yücel
1, A, C, D, F, Suzan Onur Yaman
1, A–C, Demet Özbabalık
2, A, C–F,
Serhat Özkan
2, B–D, F, Gürsel Ortuğ
1, A, C,
Gazi Özdemіr
2, A, FMorphometric Measurements of MRI Findings
in Patients with Alzheimer’s Disease
1 Department of Anatomy, Faculty of Medicine, Eskişehir Osmangazi University, Turkey 2 Department of Neurology, Faculty of Medicine, Eskişehir Osmangazi University, Turkey
A – research concept and design; B – collection and/or assembly of data; C – data analysis and interpretation;
D – writing the article; E – critical revision of the article; F – final approval of article; G – other
Abstract
Background. Alzheimer’s disease (AD) is one of the most common degenerative neurological disorders among elderly people, and is associated with progressive cerebral atrophy. AD is characterized by deterioration of the memory, difficulties with language, alterations in behavior and dysfunction in daily activities.
Objectives. The purpose of the present study was to measure the total volumes of different parts of the brain of AD patients and healthy gender-matched controls using Cavalieri’s volume estimate method, and to establish some brain ratios. Moreover, the authors wanted to test this method in measuring the volumes of various parts of the brain from MRI scans.
Material and Methods. In this study, the MRI scans of 15 right-handed individuals with probable AD and 10 healthy controls were assessed. Cavalieri’s volume estimate method was applied to the brain MRI scans to calculate the volumes of various parts of the brain.
Results. While the measurements showed a marked increase in the volume of cerebral ventricles and sulci in AD patients in comparison to the gender-matched controls, the volumes of cortical gray matter and cerebral hemi-spheric brain matter were reduced considerably. However, no significant differences were detected in the volume of the cerebellum + brainstem or intracranium in AD patients. There were also no major variations between male and female values of the two groups.
Conclusions. Overall, cerebral hemisphere and cortical gray matter atrophies were the most remarkable findings among AD patients in the present study; consequently, expansions of both the ventricles and subarachnoid space were formed. Cavalieri’s volume estimate method was very efficient in calculating the volumes of different parts of brain from the MRI scans of both groups (Adv Clin Exp Med 2014, 23, 1, 91–96).
Key words: Alzheimer, brain, morphometry, Cavalieri’s principle. Adv Clin Exp Med 2014, 23, 1, 91–96
ISSN 1899–5276
ORIGINAL PAPERS
© Copyright by Wroclaw Medical University
Alzheimer’s disease (AD) is the most common cause of dementia, with a rate of approximate-ly 10% for people 65 years of age and older. The numberof older people at risk is rising as life ex-pectancy increases in most parts of the world [1]. AD is characterized by deterioration of the mem-ory, difficulties with language, alterations in be-havior and dysfunction in daily activities. Accu-rate diagnosis of AD depends on the assessment of brain pathology. Postmortem neuropathologi-cal examinations have shown that dementia of the Alzheimer type (DAT) is a progressive neurode-generative disorder associated with neuron loss and
the accumulation of neurofibrillary tangles (dense perikaryal staining) and senile plaques [2–4]. Unfortunately, this is not a practical approach for
study was to compute the total volumes of differ-ent parts of the brain of AD patidiffer-ents and healthy gender-matched controls using Cavalieri’s volume estimate method and to establish some brain ra-tios. In addition, the authors wanted to test this method in measuring the volumes of various parts of brain from MRI scans.
Material and Methods
A group of probable AD patients, diagnosed by the criteria established by the National Insti-tute of Neurological and Communicative Disor-ders and Stroke and the Alzheimer’s Disease and Related Disorders Association for the clinical diag-nosis of probable AD, were included in the present study [9]. A total of 15 AD patients (10 males, 5 fe-males) were evaluated. None of the patients had any diseases other than probable AD. In addition, they had no medical history of significant head injury or psychiatric disorder. The age range was from 62 to 77 for the men and from 50 to 81 for the women.
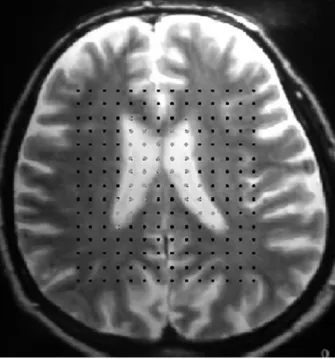
The control group consisted of the same number of males and females as in the study group; the age ranges in the control group were 59–81 for the men and 57–71 for the women. Cavalieri’s volume esti-mate method was applied to brain magnetic reso-nance imaging (MRI) scans to calculate the volume of various parts of the brain. To accomplish this, a simple point grid with a known area associated with each point (a/p) was used for each brain im-age. Each point on the area under investigation was counted as a Pi. The thickness (T) of the slice of MRI was also considered in calculating the volume of the brain region being investigated (Fig. 1). The following equation was used for calculating the ab-solute volume of each part of the brain:
V= T. a/p. ∑ Pi [10]
The average values were determined for each person, and then statistical differences between the MS and control values were determined using the Mann-Whitney rank sum test. IBM SPSS Sta-tistics Software (version 15) was used. P < 0.05 was considered significant.
Results
While cerebral ventricle and sulci cerebri vol-umes were significantly higher in AD patients compared to the gender-matched controls, cere-bral hemisphere brain matter and cortical gray matter volumes were significantly reduced. But no significant difference was detected in the cerebel-lum + brainstem and intracranial vocerebel-lumes in AD patients. There was also no significant difference between the male and female values of the 2 groups (Table 1).
Discussion
In the present study, cerebral ventricular vol-ume was 125% higher in the male AD patients com-pared to the male controls and 99% higher in the female AD patients compared to the female con-trols. While the overall cerebral ventricular volume was 66.96 cm3 in male AD patients and 61.48 cm3
in female AD patients, in the control group it was 29.71 cm3 in males and 30.94 cm3 in females,
sug-gesting that ventricular volume might be a useful marker for diagnosing AD. Similar results have been reported by many other researches [11–13]. For example, a 118% increase in AD patients was shown in the Barber’s study [13]. According to Ridha et al., there is a strong correlation between brain atrophy and ventricular enlargement, and (as those authors wrote) “cognitive scales probably reflect the correspondence between these measures of overall cerebral loss and global cognitive mea-sures in the moderate stages of AD” [14].
In addition to the increase in ventricular vol-ume, sulci cerebri volume was also higher in AD
patients. This increase was 11% and 13% in male and female patients, respectively. Moreover, cor-tical gray matter volume was reduced by 31% and 24% in male and female AD patients, respective-ly, in comparison with their gender-matched con-trols. In the AD patients, there was an addition-al decrease in cerebraddition-al hemisphere brain matter volume, which was 11% and 19% in males and fe-males, respectively. Comparable results were found by Matsumae et al. as well [15]. On the other hand, the brain atrophy and ventricular expansion rates were shown to be higher in patients with mild cog-nitive impairment (MCI) that progressed into AD within 12 months of follow-up when compared with MCI subjects who remained stable [16]
The results of the present study demonstrated that AD-associated atrophy was greater in cerebral white matter than in cortical gray matter, as indicat-ed by the presence of markindicat-edly increasindicat-ed ventricular volume compared to cerebral sulci volume. In addi-tion, cerebral hemisphere brain matter volume in AD patients changed only 11% and 19%. An earlier study on the impact of AD on the volume of the cortical nu-clei revealed that the volume of the subcortical nuclei
was not significantly different between AD patients and controls [17]. Likewise, similar recent studies re-ported significant volumetric reduction in the cor-pus callosum of AD patients [18–21]. These results suggest that the axons of the neurons are more vul-nerable than the perikaryon in AD patients. More-over, a study by Duan et al. demonstrated that the white matter of the patients with Alzheimer’s disease was selectively impaired, that the extent of the dam-age showed a strong correlation with cognitive func-tion, and that selective impairment reflected cortico-cortical and cortico-subcortico-cortical disconnections in the pathomechanism of Alzheimer’s disease [22].
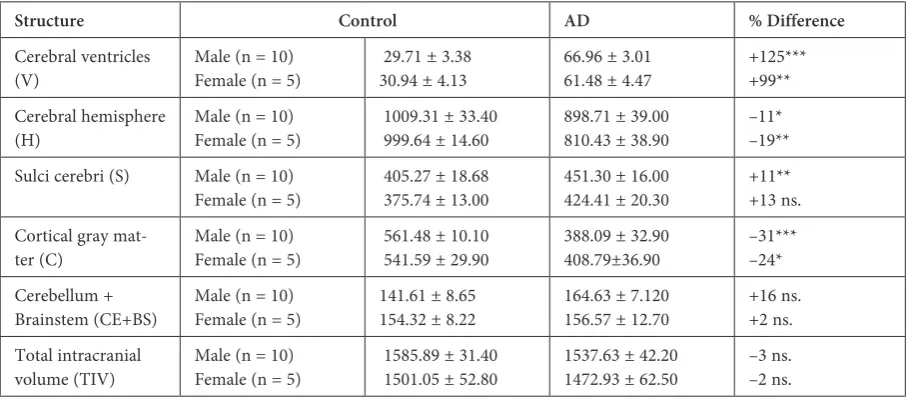
Table 1. The mean absolute volumes (cm3) of various parts of the brains of healthy controls and AD patients
Structure Control AD % Difference
Cerebral ventricles
(V) Male (n = 10)Female (n = 5) 29.71 ± 3.3830.94 ± 4.13 66.96 ± 3.0161.48 ± 4.47 +125***+99** Cerebral hemisphere
(H) Male (n = 10)Female (n = 5) 1009.31 ± 33.40 999.64 ± 14.60 898.71 ± 39.00810.43 ± 38.90 –11*–19** Sulci cerebri (S) Male (n = 10)
Female (n = 5) 405.27 ± 18.68 375.74 ± 13.00 451.30 ± 16.00424.41 ± 20.30 +11**+13 ns. Cortical gray
mat-ter (C) Male (n = 10)Female (n = 5) 561.48 ± 10.10 541.59 ± 29.90 388.09 ± 32.90408.79±36.90 –31***–24* Cerebellum +
Brainstem (CE+BS) Male (n = 10) Female (n = 5) 141.61 ± 8.65154.32 ± 8.22 164.63 ± 7.120156.57 ± 12.70 +16 ns.+2 ns. Total intracranial
volume (TIV) Male (n = 10)Female (n = 5) 1585.89 ± 31.40 1501.05 ± 52.80 1537.63 ± 42.201472.93 ± 62.50 –3 ns.–2 ns.
As expected, there was no significant difference in total intracranial volume in the AD patients as compared with the controls. This is in agreement with the results of a recent study [23]. Because AD causes some disorders in brain structures such as ventricle enlargement and increases in sulci cere-bri volume, the volume of white and gray cortical matter diminish.
Similarly, cerebellum + brainstem volume did not differ between the AD patients and the con-trols. The results of the present study are consis-tent with the findings of Murphy et al. [12]; in con-trast, Wegiel et al. [24] found that the cerebellar volume was significantly reduced in AD patients. Moreover, the cortical thickness of the tempo-ral lobe, parahippocampal gyrus, and enthorhi-nal cortex in both hemispheres of AD patients have been reported to show some decrease in ad-dition to cortical thinning in the isthmus of cingu-late gyrus and middle temporal gyrus in the right hemisphere [25].
Along with the significant volume changes in some of brain regions of AD patients, marked changes were also observed in the volume ratios of these patients. In particular, the changes in the ratios of H/S, H/V, C/V, CE + BS/V and TIH/V
appear to be especially useful for interpreting the atrophies correlating with the severity of AD.
In their study, Matsumae et al. compared the extraventricular volume (subarachnoid space)/ /ventricular volume ratio for AD patients with that of normal-pressure hydrocephalus (NPH) patients and found that this ratio was 3 times greater than in NPH patients [15].
In conclusion, Cavalieri’s volume estimate meth-od can be applied to MRI scans to calculate the vol-umes of different parts of the brain in AD patients. The present results indicated that the occurrence of atrophies in the cerebral hemispheres and cortical gray matter are the most remarkable findings in AD patients. In addition, enlargements of both the ven-tricles and the subarachnoid spaces were present in the brain matter of AD patients. A comprehensive assessment of brain atrophy rates might help to ex-plain the loss of cognitive function in AD patients.
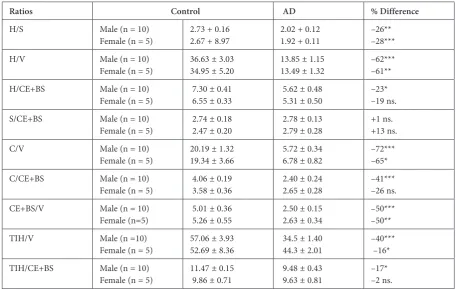
The H/V, H/S, C/V, CE + BS/V, and C/TIH ra-tios were decreased in AD patients of both sexes. H/CE + BS, C/S, C/CE + BS, CE + BS/TIH ratios were decreased only in male patients. On the oth-er hand, V/TIH and S/TIH ratios woth-ere increased in AD patients of both sexes. However, the S/CE + + BS ratio did not differ from the control values (Table 2).
Table 2. The volume ratios of various parts of the brains of healthy controls and AD patients
Ratios Control AD % Difference
H/S Male (n = 10)
Female (n = 5) 2.73 + 0.162.67 + 8.97 2.02 + 0.121.92 + 0.11 –26**–28***
H/V Male (n = 10)
Female (n = 5) 36.63 ± 3.0334.95 ± 5.20 13.85 ± 1.1513.49 ± 1.32 –62***–61**
H/CE+BS Male (n = 10)
Female (n = 5) 7.30 ± 0.41 6.55 ± 0.33 5.62 ± 0.48 5.31 ± 0.50 –23*–19 ns.
S/CE+BS Male (n = 10)
Female (n = 5) 2.74 ± 0.18 2.47 ± 0.20 2.78 ± 0.13 2.79 ± 0.28 +1 ns.+13 ns.
C/V Male (n = 10)
Female (n = 5) 20.19 ± 1.3219.34 ± 3.66 5.72 ± 0.34 6.78 ± 0.82 –72***–65*
C/CE+BS Male (n = 10)
Female (n = 5) 4.06 ± 0.19 3.58 ± 0.36 2.40 ± 0.24 2.65 ± 0.28 –41***–26 ns.
CE+BS/V Male (n = 10)
Female (n=5) 5.01 ± 0.36 5.26 ± 0.55 2.50 ± 0.15 2.63 ± 0.34 –50***–50**
TIH/V Male (n =10)
Female (n = 5) 57.06 ± 3.9352.69 ± 8.36 34.5 ± 1.40 44.3 ± 2.01 –40*** –16* TIH/CE+BS Male (n = 10)
Female (n = 5) 11.47 ± 0.15 9.86 ± 0.71 9.48 ± 0.43 9.63 ± 0.81 –17*–2 ns.
References
[1] Bachman, DL, Wolf, PA, Linn, RT, Knoefel JE, Cobb JL, Belanger AJ, White LR, D’Agostino RB: Incidence of dementia and probable Alzheimer’s disease in a general population: the Framingham study. Neurology 1993, 43, 515–519.
[2] Wilcock, GK, Esiri, MM: Plaques, tangles and dementia. A quantitative study. J Neurol Sci 1982, 56, 343–356.
[3] Delaère P, Duyckaerts C, Brion, JP, Poulain V, Hauw JJ: Tau, paired helical filaments and amyloid in the neo-cortex: a morphometric study of 15 cases with graded intellectual status in aging and senile dementia of Alzheimer type. Acta Neuropathol 1989, 77, 645–653.
[4] Mann DM, Yates PO, Marcyniuk B: Pathologic heterogeneity of Alzheimer’s disease Arch Gen Psychiatry 1988, 45, 962–963.
[5] Zamrini, E, De Santi S, Tolar M: Imaging is superior to cognitive testing for early diagnosis of Alzheimer’s disease. Neurobiol Aging 2004, 25, 685–691.
[6] Jessen F: Novel neuroimaging perspectives in the diagnosis of dementia. Nervenarzt 2008, 79, 129–36.
[7] Killiany RJ, Gomez-Isla T, Moss M, Kikinis R, Sandor T, Jolesz F, Tanzi R, Jones K, Hyman BT, Albert MS:
Use of structural magnetic resonance imaging to predict who will get Alzheimer’s disease. Ann Neurol 2000, 47, 430–439.
[8] Teipel SJ, Ewers M, Wolf S, Jessen F, Kölsch H, Arlt S, Luckhaus C, Schönknecht P, Schmidtke K, Heuser I, Frölich L, Ende G, Pantel J, Wiltfang J, Rakebrandt F, Peters O, Born C, Kornhuber J, Hampel H: Multicentre variability of MRI-based medial temporal lobe volumetry in Alzheimer’s disease. Psychiatry Res 2010, 182, 244–250.
[9] McKhann G, Drachman D, Folstein M, Katzman R, Price D, Stadlan EM: Clinical diagnosis of Alzheimer’s disease: report of the NINCDS-ADRDA Work Group under the auspices of Department of Health and Human Services Task Force on Alzheimer’s Disease. Neurology 1984, 34, 939–944.
[10] Howard CV, Reed MG: Estimation of reference volume using the Cavalieri method. Unbiased stereology, BIOS Scientific Publishers. 1st edition. Hong Kong, Taiwan, Singapore 1998, 39–42.
[11] Creasy H, Schwartz M, Frederickson H, Haxby JV, Rapoport SI: Quantitative computed tomography in demen-tia of the Alzheimer type. Neurology 1986, 36, 1563–1568.
[12] Murphy DGM, DeCarli CD, Daly E, Gillette JA, McIntosh AR, Haxby JV, Teichberg D, Schapiro MB, Rapoport SI, Horwitz B: Volumetric magnetic resonance imaging in men with dementia of the Alzheimer type: Correlations with disease severity. Biol Psychiatry 1993, 34, 612–621.
[13] Barber R, Ballard C, McKeith IG, Gholkar A, O’Brien JT: MRI volumetric study of dementia with Lewy bodies. Neurology 2000, 54, 1304–1309.
[14] Ridha BH, Anderson VM, Barnes J, Boyes RG, Price SL, Rossor MN, Whitwell JL, Jenkins L, Black RS, Grundman M, Fox NC: Volumetric MRI and cognitive measures in Alzheimer disease: comparison of markers of progression. J Neurol 2008, 255, 567–574.
[15] Matsumae M, Kikinis R, Mórocz I, Lorenzo AV, Albert MS, Black PM, Jolesz FA: Intracranial compartment volumes in patients with enlarged ventricles assessed by magnetic resonance-based image processing. J Neurosurg 1996, 84, 972–981.
[16] Evans MC, Barnes J, Nielsen C, Kim LG, Clegg SL, Blair M, Leung KK, Douiri A, Boyes RG, Ourselin S, Fox NC: Volume changes in Alzheimer’s disease and mild cognitive impairment: cognitive associations. Eur Radiol 2010, 20, 674–682.
[17] de la Monte SM: Quantitation of cerebral atrophy in preclinical and end-stage Alzheimer’s disease. Ann Neurol 1989, 25, 450–459.
[18] Chaim TM, Duran FL, Uchida RR, Périco CA, de Castro CC, Busatto GF: Volumetric reduction of the corpus callosum in Alzheimer’s disease in vivo as assessed with voxel-based morphometry. Psychiatry Res 2007, 154, 59–68.
[19] Balthazar ML, Yasuda CL, Pereira FR, Pedro T, Damasceno BP, Cendes F: Differences in grey and white matter atrophy in amnestic mild cognitive impairment and mild Alzheimer’s disease. Eur J Neurol 2009, 16, 468–474.
[20] Guo X, Wang Z, Li K, Li Z, Qi Z, Jin Z, Yao L, Chen K: Voxel-based assessment of gray and white matter volumes in Alzheimer’s disease. Neurosci Lett 2010, 468, 146–150.
[21] Serra L, Cercignani M, Lenzi D, Peri R, Fadda L, Caltagirone C, E Macaluso, Bozzali M: Grey and white mat-ter changes at different stages of Alzheimer’s disease. 2010, javascript:AL_get(this, ‘jour’, ‘J Alzheimers Dis.’); 19, 47–59.
[22] Duan JH, Wang HQ, Xu J, Lin X, Chen SQ, Kang Z, Yao ZB: White matter damage of patients with Alzheimer’s disease correlated with the decreased cognitive function. Surg Radiol Anat 2006, 28, 150–156.
[23] Jenkins, R, Fox NC, Rossor AM, Harvey RJ, Rossor MN: Intracranial volume and Alzheimer Disease. Arch Neurol 2000, 57, 220–224.
[24] Wegiel J, Wisniewski HM, Dziewiatkowski J, Badmajew E, Tarnawski M, Reisberg B, Mlodzik B, Mony J, De Leon MJ, Miller DC: Cerebellar atrophy in Alzheimer’s disease – clinicopathological correlations. Brain Res 1999, 818, 41–50.
Address for correspondence:
Ferruh Yücel
Department of Anatomy Faculty of Medicine
Eskişehir Osmangazi University 26480 Eskişehir
Turkey
E-mail: [email protected]
Conflict of interest: None declared