Statistical analysis of mechanical
test results for samples of pipes from
trunk oil pipelines after long-term
operation
by D.A. Neganov, S.V. Skorodumov, and
N.Yu. Nikitin*
Pipeline Transport Institute, LLC, Moscow, Russian Federation A B S T R A C T
C
ONDUCTING ANY SCIENTIFIC RESEARCH includes the process of acquiring, processing, and analysing data which are obtained as a result of one or a series of experiments.Over the prolonged period for which science has existed, a multitude of methods have been created for obtaining experimental data. As part of studying the properties of materials, standard methods are applied for tensile, impact toughness, and hardness tests, as well as fatigue tests. This list of tests can be taken as a base which is used to establish the level and character of loads the given material is capable to sustain during operation. This paper examines approaches to processing experiment results which are obtained using standard (basic) methods when testing pipe steels for trunk oil and oil product pipelines.
At the present time, the degree of automation in experimental equipment is fairly high. However, there is still some human participation when preparing samples and setting-up the experiments, which may lead to errors occurring when performing the tests (the human factor). This article
presents some approaches which make it possible to perform initial processing and verification
of experimental data for errors and reliability, and against hypotheses and distribution laws for the results obtained. Methods are also suggested for determining the minimum quantity of samples to be tested, based on evaluation of the mechanical property variations in pipe steels.
Several approaches may be applied to solve the task of identifying links and relationships
between the analysed parameters. The first approach is deterministic and requires
long-term study. When one takes into account the considerable number of factors being studied, it is also fairly expensive and involves rather complicated experiments. The second approach is probabilistic and statistical, which allows implicit dependences to be established between series of measurements (correlation analysis) and linear (pair regression) and non-linear dependences (multiple regression) to be revealed between the parameters being examined. This study applies the statistical approach to analysing data from mechanical tests of pipe steels in trunk oil and oil product pipelines.
ARTICLE INFO
Received: 12 March, 2018 Revised: 15 May, 2018 Accepted: 21 May, 2018
characteristics, and searched for maximum and minimum values. Parameters are also determined
for the root mean square deviation, as well as for the confidence intervals of values, and data
are visualized (the process of presenting ordered data in the form of schemes, histograms and diagrams).
When it has been established that the experiment results belong to the normal distribution law, it becomes possible to apply methods of correlation and regression analysis.
Applying correlation analysis makes it possible to confirm the presence of statistically significant relationships between the values, while regression analysis establishes the type
of empirical equations which link the inter-correlating parameters. This approach has been applied successfully at various metallurgical plants. Thus, at the Vyksa Steel Works it was
used when developing an automatic system for steel certification [2]; around 40 parameters were examined which affect the mechanical properties of flat-rolled metal. As a result of this
approach a statistical model was developed which describes the dependence of the yield strength on production parameters. This model showed that the measured value deviated from the value
calculated from the equation by 5%. The economic effect is reflected in the reduction of the volume of steel sent for qualification testing checks due to failures, and in the reduced necessity of carrying out direct testing for 65% of flat-rolled steel [2]. Reference 3 presents similar statistical
studies aiming to obtain regression equations which make it possible to predict the mechanical properties of cold-rolled and annealed steels of AISI 304 class (analogous to 08X18H10). The authors have obtained regression equations which connect the elongation to yield strength and the Brinell hardness to yield strength. They have also obtained a multi-factor regression equation which connects the concentration of various alloying elements, the percentage of
δ-ferrite, the grain size and the yield strength. A comparison of the results of calculations based on this equation with experimental results gave a divergence of no more than 5%.
Analysing the experience of using methods of statistical analysis has shown that a fairly large quantity of results has been accumulated from applying statistical checks to the multi-parameter process, aimed at quality control for products manufactured in various technological processes [4]. Methods of statistical analysis had almost never been applied earlier with the aim of multi-factor analysis of the mechanical characteristics of steel for trunk oil and oil product pipelines after long-term operation.
2. Material and methods of testing and research
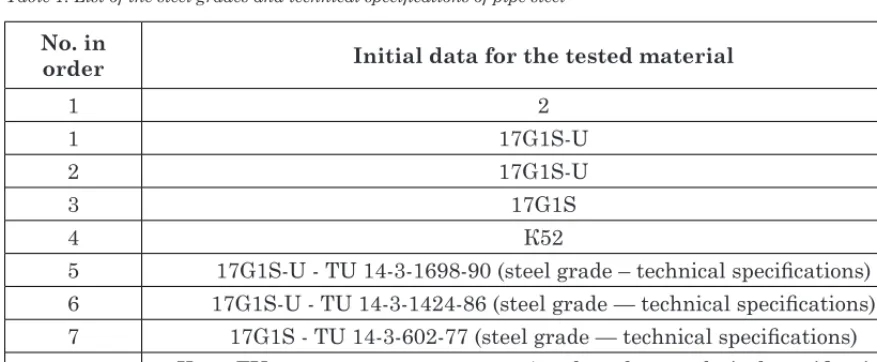
In carrying out this research, two sets of initial data were used. The first was the results of tests
on steel samples where only the steel grade or the strength class was known; the second was the
results of tests on samples with known values for steel grade and technical specifications of pipe
manufacture [5]. The list of combinations analysed is given in Table 1.
The period of pipe operation with combinations of steel grade — technical specifications of pipe
The tests on the samples were carried out using standard methods [6, 7]. The mechanical characteristics and regulatory documentation (hereafter RD) are given in Table 2.
Test results were presented in the form of distribution bar graphs showing the mechanical properties. This presentation offers a range of advantages. Firstly, it allows the type of distribution to be evaluated visually (to verify the hypothesis about whether the distribution
can be considered normal). Secondly, where normal distribution of results cannot be confirmed,
it is possible to calculate the distribution function and switch from discrete statistical analysis to continuous.
The test results were processed according to GOST R 8.736-2011 [1] and processing included the following stages:
• eliminating known systematic errors from the measurement results; • calculating an estimation of the measured value;
• calculating the root mean square deviation of the measurement results;
• checking for the presence of crude errors and where necessary eliminating them; • checking the hypotheses about the normal distribution of the measurement results; • calculating confidence limits for the accidental error when estimating the measured value.
The following statistical analysis was carried out taking into account the standard methods of No. in
order Initial data for the tested material
1 2
1 17G1S-U
2 17G1S-U
3 17G1S
4 К52
5 17G1S-U - TU 14-3-1698-90 (steel grade – technical specifications)
6 17G1S-U - TU 14-3-1424-86 (steel grade — technical specifications)
7 17G1S - TU 14-3-602-77 (steel grade — technical specifications)
8 K52 - TU 1381-018-00186654-2009 (steel grade — technical specifications) Table 1. List of the steel grades and technical specifications of pipe steel
No. in
order Characteristic Calculation method
1 2 3
1 Proof strength, s02, MPa Tensile testing based on GOST 1497-84 [8]
2 Tensile strength (ultimate strength), s
в, MPa
Tensile testing based on GOST 1497-84 [8]
3 Reduction in area in the neck after rupture, ψ, % Tensile testing based on GOST 1497-84 [8]
Ultimate strength, MPa
Reduction in area, % Yield strength, MPa
Number of test results, N
Number of test results, N
Number of test results, N
Fig.1. Distribution bar graphs for mechanical testing results for the combination steel grade — technical specifications of 17G1S per TS 14-3-602-77:
multi-factor correlation and single-factor regression analysis [9].
Conducting multi-factor statistical analysis of the mechanical properties of steel is conditional upon identifying the factors which affect the strength and plasticity of metal. Within the
framework of this study, a systematic approach to dividing the factors which had an influence
on the mechanical properties of pipe steels was applied. As a result, all factors were divided into internal and external factors.
The external factors affecting the mechanical properties of pipe steels included the number of loading cycles performed on the pipeline. This was calculated according to the accepted regulatory documentation and based on data for a pressure differential during oil and oil product pumping, in the chosen sections of the pipeline over the last three years.
The internal factors connected with the mechanical properties of pipe steel used at trunk oil and oil product pipelines included:
• the thickness of the pipe wall. • the pipe diameter.
• the grain number (grain size). • the structure banding.
The results of calculations using regression equations were verified using the following
methods:
• the statistical ‘3- sigma’ method [4];
• the method of direct calculation and comparison of results with experimental data. In the case of direct calculation and comparison of the calculation results with experimental data, the results of non-destructive inspection and tests may be used as experimental data. These were carried out according to the methods indicated in Table 2.
3 Statistical analysis of mechanical testing results
3.1 Visual representation of mechanical testing results
In Fig.1 distribution bar graphs are presented for the results of mechanical testing on samples
of steel with combination steel grade - technical specifications of 17G1S per TS 14-3-602-77. The
number of measurements for each of the mechanical properties was 24.
Qualitative analysis of distribution bar graphs for mechanical properties cannot unambiguously
confirm the type of distribution of the ultimate strength, yield strength and reduction in area for the combination steel grade – technical specifications of 17G1S per TS 14-3-602-77. This behaviour of the distribution of mechanical characteristics may be linked to an insufficient
quantity of accumulated data when this article was written.
Figure 2 presents an example of distribution bar graphs for the results of mechanical testing for steel grade 17G1S-U. The number of measurements for ultimate strength, yield strength and reduction in area was 160.
Ultimate strength, MPa
Yield strength, MPa
Reduction in area, %
Number of test results, N
Number of test results, N
Number of test results, N
The presented non-uniformity of the data distribution may be linked to the presence of additional factors, which affect the character of the mechanical properties’ distribution for steel grade
17G1S-U. Some of these parameters are the technical specifications of pipe manufacture.
3.2 Processing test results
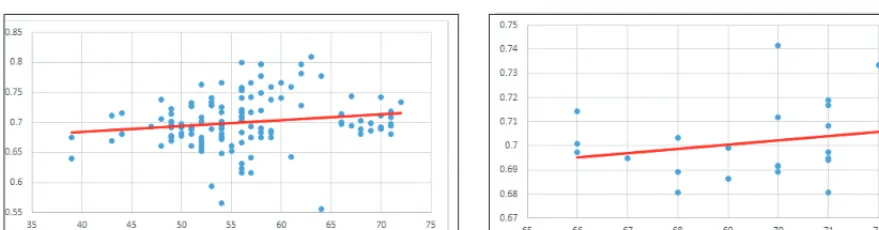
Figures 3 and 4 illustrate the dispersion of the results of mechanical tests of pipe steel regarding
only the steel grade, and the steel grade and technical specifications of pipe manufacture. The
distribution limits of tensile testing results are marked with ovals of various colours.
In Figs 3 and 4, blue ovals mark out the scatter limits for test results for steel grade 17G1S,
without taking into account the technical specifications of pipe manufacture. Red and
s0.2/sB orange ovals mark out the scatter limits for the combination of steel grade and technical
specification 17G1S with TS 14-3-602-77, and 17G1S-U with TS 14-3-1698-90 in the total mass
of tests for steel grade 17G1S.
From the dispersion diagrams presented (Figs 3 and 4) showing mechanical characteristics, it follows that the scatter of values for ultimate strength and yield strength versus the reduction in area is reduced, when taking into account the pipe manufacture technology. When taking into
account the technical specifications for pipes manufacturing, a change can be observed in the
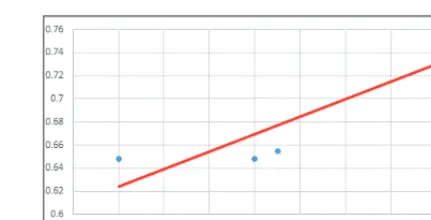
steepness of the dependence of the ultimate strength and yield strength versus the reduction in area in comparison to the observed character of the relationship for the steel grade. This conclusion is demonstrated more clearly in Figs 5, 6, and 7.
From the dependencies presented (Figs 5, 6, and 7), it is clear that the general pattern of growth in the yield strength to ultimate strength ratio, versus the reduction in area, is maintained when
taking into account the technical specifications of pipe manufacture at the same steel grade.
The scatter values are calculated when evaluating the basic statistical characteristics of the mechanical properties distribution.
3.3 An evaluation of basic statistical characteristics
Based on test results, average values as well as the root-mean-square deviations (henceforth
Fig.4. Diagram showing the dispersion of yield strength values vs on the reduction in area for the steel grade and for the combination of steel grade and technical
specifications:
Blue — Steel grade 17G1S
Red — Steel grade - TS 17G1S-U TS 14-3-1698-90 Orange — Steel grade - TS 17G1S TS 14-3-602-77 Fig.3. Diagram showing the dispersion of ultimate
strength values depending on the reduction in area for the steel grade and for the combination of steel grade and
technical specifications: Blue — Steel grade 17G1S
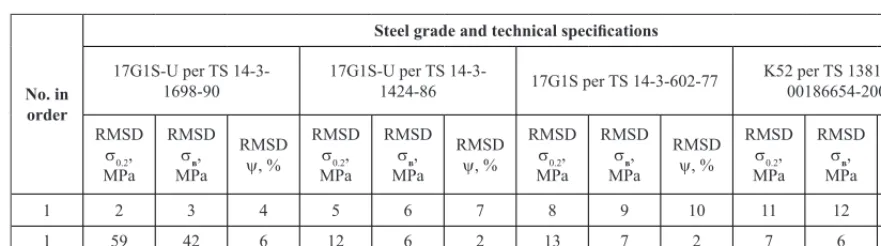
RMSD) were calculated for the steel grades and for the combinations of steel grade and technical
specifications (henceforth TS) presented in Table 1. In Tables 3, 4, 5 and 6 the results of these
calculations are presented.
Comparative analyses of the average values of the ultimate strength, yield strength and reduction in area, calculated separately for steel grades and combinations of steel grade, technical
specifications, shows that the values of the average ultimate strength and yield strength for
samples of pipe with steel grade 17G1S-U are higher than for samples of pipe with combination steel grade 17G1S-U per TS 14-3-1698-90 and 17G1S-U per TS 14-3-1424-86. However, values of the average reduction in area are lower. For samples of pipe with steel grade 17G1S the values for average yield strength, ultimate strength and reduction in area are lower than for the
test results of samples of steel with a combination 17G1S – TS 14-3-602-77. When examining
the steel grade K52, the average values of the yield strength and reduction in area are lower than for the combination of K52 per TS 1381-018-00186654-2009, while the value of the average ultimate strength is higher.
Calculating the RMSD establishes that for all combinations of steel grade and technical
specifications, the scatter of experimentally obtained values is less than for samples with known
steel grade. The exception to this is the results of tests on samples of pipe with a combination of 17G1S-U per TS 14-3-1698-90 (Fig.6).
A cumulative analysis of the results of calculating the RMSD and scatter diagrams (Figs 3
and 4) makes it possible to conclude that taking into account the technical specifications
for manufacturing pipes used on trunk oil and oil product pipelines allows the mechanical characteristics of pipe steels to be described more accurately at their further use, in the capacity of initial data for calculating longevity based on current regulatory documentation.
3.4 Defining the necessary and sufficient quantity of samples to be tested
Current regulatory documentation establishes the minimum number of tests which will ensure the reliability of experimental results, but criteria for the optimum number of tests are not
specified.
The optimum number of tests depends on the stability and manageability of the process and the corresponding scatter of steel’s mechanical characteristics (property variations). The use of
statistical methods of data analysis allows the coefficient of property variation to be calculated
numerically, according to the equation:
Fig.5. The dependence of the yield strength to ultimate
strength ratio s0.2/σB versus the reduction in area for steel
grade 17G1S.
Fig 6. The dependence of the yield strength to ultimate
strength ratio s0.2/σB versus the reduction in area for steel
K S x
2 =
(1)
• where S is the RMSD of the mechanical characteristic (ultimate strength, yield strength, reduction in area etc.); • x is the average value of the mechanical
characteristic (ultimate strength, yield strength, reduction in area etc.).
Changes in the coefficient of variation,
calculated on the basis of the data presented in Tables 3-6 for steel grades in the 17GS group and with various mechanical characteristics of steel, are presented in Figs 8-10.
From the bar graphs shown (Figs 8-10), it can be seen that taking into account the method of pipe manufacture leads to a reduction in the variation of pipe steel properties. This indicates the high level of repeatability in the technological process. The exception to this is the behaviour of
Fig.7. The dependence of the yield strength to ultimate
strength ratio s0.2/σB versus the reduction in area for steel
grade and technical specifications 17G1S with TS 14-3-1698-90.
No. in order
Steel grade
17G1S-U 17G1S K52
Average
s0.2, MPa
Average
sB, MPa
Average
ψ,% sAverage 0.2, MPa
Average
sB, MPa
Average
ψ,% sAverage 0.2, MPa
Average
sB, MPa
Average
ψ,%
1 2 3 4 5 6 7 11 12 13
1 428 598 52 408 582 57 435 564 61
No. in or-der
Steel grade and technical specifications
17G1S-U per TS
14-3-1698-90 17G1S-U per TS 14-3-1424-86 17G1S per TS 14-3-602-77 К52 00186654-2009per TS
1381-018-Av.
s0.2,
MPa
Av. sB,
MPa ψ,%Av.
Av.
s0.2,
MPa
Av. sB,
MPa ψ,%Av.
Av.
s0.2,
MPa
Av. sB,
MPa ψ,%Av.
Av.
s0.2,
MPa
Av. sB,
MPa ψ,%Av.
1 2 3 4 5 6 7 8 9 10 11 12 13
1 407 582 59 382 567 56 420 597 69 443 539 78
Table 5. RMSD for mechanical characteristics for classification according to steel grade
No. in order
Steel grade
17G1S-U 17G1S K52
RMSD
s0.2, MPa
RMSD
sв, MPa RMSD ψ,% sRMSD 0.2, MPa
RMSD
sв, MPa RMSD ψ,% sRMSD 0.2, MPa
RMSD
sв, MPa RMSD ψ,%
1 2 3 4 5 6 7 11 12 13
1 48 35 14 30 25 7 30 21 10
the coefficient of variation for the ultimate strength and yield strength of pipe steel produced per technical specifications TS-14-3-1698-90.
It is worth noting that the conclusions made from evaluating the behaviour of the coefficient of
variation of mechanical characteristics correspond to the conclusions obtained from analysing the RMSD. However, the behaviour of the RMSD characterizes only the scatter of experimental data around a certain average value. It is actually a criterion which to a greater degree describes
the quality of the measurement taken, while the coefficient of variation directly describes the
change to the property and does not contain hidden errors from the experiment.
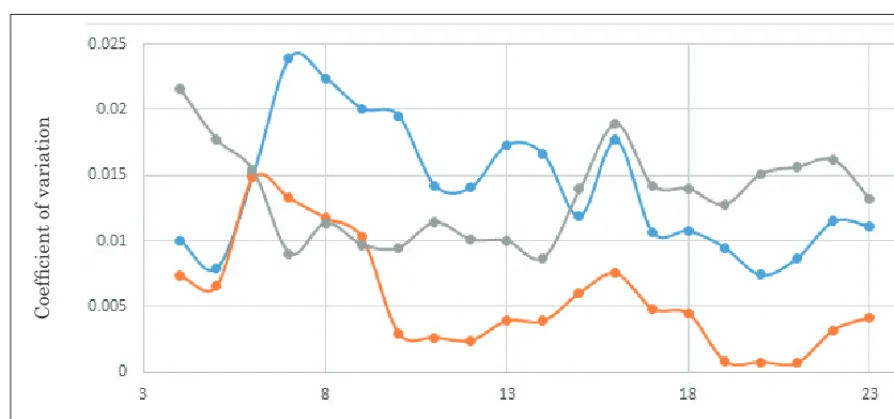
The relationship between the coefficient of variation and the number of tested samples of pipe
steel from the 17GS steel grade (and its analogues) is shown in Fig.11.
In the relationship shown, the maxima for each characteristic are clearly visible (for ultimate strength, yield strength and reduction in area) in the range corresponding to 20 samples. The results of a similar analyses, taking into account the technology of pipe manufacture, are shown in Fig.12.
When the manufacturing technology is accounted for, the values of the coefficient of variation for
ultimate strength, yield strength and reduction in area characteristics have a maximum in the interval from 4 to 8 samples (Fig.12).
Thus, by accounting for the variation in mechanical properties makes it possible to establish criteria for choosing the pipe manufacturing technology which allows the best repeatability of mechanical properties to be assured. In its turn, this will facilitate the highest predictability in the behaviour of the pipe steel during operation.
3.5 Correlation and regression analysis
In order to establish the factors which affect strength and plasticity characteristics during pipe operation in a trunk oil or oil product pipeline, the methods of correlation and regression analysis were applied [9].
When performing correlation analysis, the following factors were considered, as they impact the mechanical characteristics:
• the grain number (grain size); • the structure banding;
• the thickness of the pipe wall; • the diameter of the pipe;
1 2 3 4 5 6 7 8 9 10 11 12 13
• the adjusted number of pipeline loading cycles.
The results of correlation analysis are presented in the form of a correlation matrix between the basic mechanical characteristics and the adjusted cyclic loading (Table 7). Analysis of the correlation matrix shows that the strength characteristics based on test results for the combination of steel grade (ultimate strength and yield strength) correlate closely with the adjusted number of
Fig.8. Coefficient of variation for yield strength in the
17GS group of steel grades. Fig.9. Coefficient of variation for ultimate strength in the 17GS group of steel grades.
Fig.10. Coefficient of variation for reduction in area in the 17GS group of steel grades.
Fig.11. Change to the variation coefficient depending on the number of samples tested for steel grade 17G1S-U: Blue — Yield strength; Red — Ultimate strength; Green — Reduction in area.
Number of samples
Coefficient of variation
0 0.02 0.04 0.06 0.08 0.1 0.12 0.14 0.16 yi el d st re ng th
steel grade — technical specificaons
0 0.02 0.04 0.06 0.08 0.1 0.12 0.14 0.16 Ul m at e st re ng th
steel grade — technical specificaons
0 0.05 0.1 0.15 0.2 0.25 0.3 re du c on in area
loading cycles performed on the oil or oil product pipeline (Kcorr > 0.7), while the reduction in
area reveals an average level of correlation (0.5 ≤ Kcorr ≤ 0.7). It thus follows that the ultimate
strength and the yield strength have linear dependency on the number of loading cycles on the pipeline.
Table 8 presents the matrix of correlation coefficients between the mechanical properties and
the structure parameters.
The results of correlation analysis between the grain size and structure banding and the mechanical properties of the pipe steel used in trunk pipelines revealed the presence of an average correlation between the microstructure banding and the strength and plasticity characteristics of the pipe steel. A linear dependency is observed only between the mechanical properties and the grain number (size).
Number of samples
Coefficient of variation
Fig.12. Change to the coefficient of variation for mechanical properties depending on the number of samples tested for the combination 17G1S per TS 14-3-602-77:
Blue — Yield strength; Brown — Ultimate strength; Gray — Reduction in area.
No. in
order Values
Adjusted number of loading
cycles, cycles/year
s0.2, MPa sв, MPa ψy,%
1 2 3 4 5 6
1
Adjusted number of loading cycles,
cycles/year
1.00 0.84 0.94 0.55
2 s0.2, MPa 0.84 1.00 0.95 0.01
3 sв, MPa 0.94 0.95 1.00 0.24
4 ψ,% 0.55 0.01 0.24 1.00
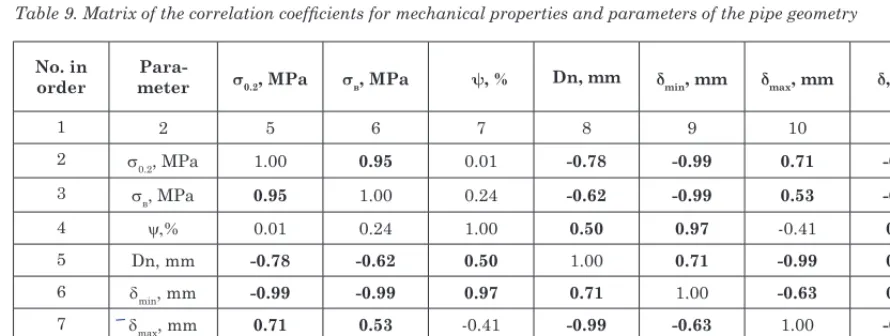
The results of a similar analysis are presented in Table 9 for the structural parameters of pipes. The results of this analysis revealed a strong correlation (linear dependency) between the ultimate strength, the yield strength, the reduction in area and the minimum and average thicknesses of the pipe walls. The results also showed an average correlation between the mechanical properties and the diameter of the pipe, and between the maximum thickness of the pipe walls (with the exception of reduction in area).
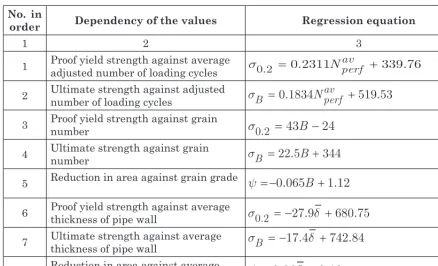
For values which showed correlation with the mechanical properties of pipe steels, linear regression equations were obtained (see Table 10).
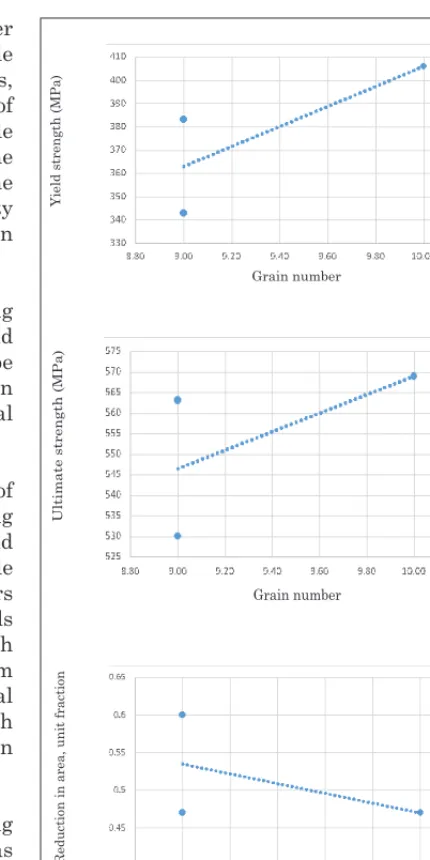
The relationships presented here show the growth of the ultimate strength and yield strength versus the average grain number (size) for the combinations of steel grades presented in Table 2, and the fall of the reduction in area depending on the average grain number. In the most general case, this indicates growth in strength characteristics and reduction in plasticity for the examined samples of steel from pipes in long-term operation. It is worth noting that the classic equation for describing the relationship of yield strength to grain size is the Hall-Petch equation [10, 11, 12]:
σ0 2 σ0 1 2
, = +K dy − / (2)
where Kyis the Hall-Petch coefficient, s0 is the yield strength of a mono-crystalline sample, and d is the grain size.
No. in order Parameter Structure banding numberGrain s0.2, MPa sв, MPa ψy,%
1 2 3 4 5 6 7
2 Structure
banding 1.00 0.76 0.67 0.64 0.50
3 Grain number 0.76 1.00 0.99 0.99 0.94
4 s0.2, MPa 0.67 0.99 1.00 0.95 0.01
5 sв, MPa 0.64 0.99 0.95 1.00 0.24
6 ψ,% 0.50 0.94 0.01 0.24 1.00
Table 8. Matrix of the correlation coefficients for mechanical properties and structure parameters
No. in
order meterPara- s0.2, MPa sв, MPa ψy, % Dn, mm dmin, mm dmax, mm d, mm
1 2 5 6 7 8 9 10 11
2 s0.2, MPa 1.00 0.95 0.01 -0.78 -0.99 0.71 -0.99
3 sв, MPa 0.95 1.00 0.24 -0.62 -0.99 0.53 -0.94
4 ψ,% 0.01 0.24 1.00 0.50 0.97 -0.41 0.88
5 Dn, mm -0.78 -0.62 0.50 1.00 0.71 -0.99 0.85
6 δmin, mm -0.99 -0.99 0.97 0.71 1.00 -0.63 0.97
7 δmax, mm 0.71 0.53 -0.41 -0.99 -0.63 1.00 -0.80
8 δ, mm -0.99 -0.94 0.88 0.85 0.97 -0.80 1.00
From Equn 2 it follows that the yield strength is inversely proportional to the square root of the grain size. The comparison of the linear relationship based on the results of regression analysis
with the Hall-Petch equation indicates the significant discrepancy between the classic principle
and the results of statistical analysis. However, in recent years conditions and materials have been discovered, in which the Hall-Petch law failure can be seen [13]. A detailed study of this problem has not yet been carried out for pipe steels after long-term operation, and this issue demands further studies.
The statistical method was used to verify the predictive capability of these equations at sections of trunk and technological oil pipelines with pipes manufactured using steel grades 17GS,
17G1S, 17G1S-U and the strength class K52. This method of results verification is based on the
‘3-sigma’ rule and was used together with the method of direct comparing calculation results from regression equations with experimental data. These showed a discrepancy of less than 5%. When checking the equations at sections of trunk oil or oil products pipelines with pipes manufactured using the steel grade 13KhGS, the deviation of the calculated values from the actual measured data was 13%.
It is worth noting that, despite the small deviations between calculated results and actual measured values of mechanical properties, the results presented are not full and require further study with regard to establishing multi-factor regression equations. Future study should also carry out cluster analysis of the pipe steel grades based on their mechanical characteristics and the operating conditions at trunk oil and oil products pipelines, as well as the increase in the
number of data points for corresponding groups of steel grades and technical specifications for
pipes manufacture.
4. Discussion of results and conclusions
The application of methods of statistical analysis to the results of mechanical testing of pipes 3 Proof yield strength against grain number
s
0 2.=
43
B
−
24
4 Ultimate strength against grain number
s
B=
22 5
.
B
+
344
5 Reduction in area against grain grade
y
= −
.
0 065
B
+
1 12
.
6 Proof yield strength against average thickness of pipe wall
σ
0 2.= −
27 9
.
δ
+
680 75
.
7 Ultimate strength against average thickness of pipe wall
σ
B= −
17 4
.
δ
+
742 84
.
Grain number Grain number
Yield strength (MPa)
Grain number
Ultimate strength (MPa)
Reduction in area, unit fraction
Fig. 13. Experimental values for the mechanical properties and regression equations for the relationships:
(a - top) yield strength versus grain number; (b - centre) ultimate strength versus grain number; (c - bottom)
reduction in area versus average grain number. at trunk oil and oil products pipelines after
long periods of operation made it possible to assess basic statistical characteristics,
as well as to verify the confidence level of
experimental results. It was also possible to establish the magnitude of scatter for the ultimate strength, the yield strength and the
reduction in area, and to confirm the necessity
of taking into account the technology used in pipe manufacture.
A methodology has been proposed for calculating the optimum number of testing samples and
comparing the technical specifications of pipe
manufacture. The methodology is based on
calculating the coefficient of the mechanical
properties variation.
Correlation analysis of the results of mechanical testing and data from cyclic loading of pipelines, parameters of pipe geometry, and microstructure of pipe steel made it possible
to find a correlation between the parameters
indicated. Regression analysis methods enabled equations to be formulated, which
link the parameters studied, and to confirm
the possibility of predicting the mechanical characteristics of pipe steel at sections with different levels of pipeline loading with an adequate degree of accuracy.
Further studies will be aimed at widening the list of steel grades examined, as well as
technical specifications for pipe manufacture.
They will also aim to divide steel grades and
technical specifications for pipe manufacture
into groups with close values for parameters, and to carry out multi-factor regression analysis taking into account the mutual correlation between the factors studied.
6. Acknowledgements
The authors express their deep gratitude to Dr N.A. Makhutov, Mr E.P. Studionov, and Mr P.V. Poshibaev for the professional guidance, valuable support and useful recommendations on this research work.
Conflicts of interest
process. Moscow: PhysMatLit, p 196.
[5] D.A. Neganov, E.P. Studionov, S.V. Skorodumov, and V.A. Soloviev, 2017. A study of the construction of hydraulic rigs for testing pipe products. Science and Technologies: Oil and Oil Products Pipeline
Transportation, 2, p 41.
[6] Yu.V. Lisin, N.A. Makhutov, D.A. Neganov, E.P. Studenov, and S.V. Skorodumov, 2018. Comprehensive mechanical testing in strength calculations for trunk pipelines in oil and oil products transportation. Plant laboratory. Materials assessment. In press.
[7] Yu.V. Lisin, 2015. A study of the physical and chemical properties of steel in long-term operating pipelines: assessing safe operation life. Science and Technologies: Oil and Oil Products Pipeline
Transportation, 7, pp 18-28.
[8] GOST 1497-84 Metals. Methods of tensile testing.
[9] Sh.U. Nizametdinov and V.P. Rumyantsev, 2012. Data analysis. Moscow: MEPhI, p 288. [10] N.J. Petch, 1953. Iron Steel Inst., 174, 25.
[11] R.W. Armstrong, I. Codd, R.N. Douthwaite, and N.J. Petch, 1962. Phil. Mag., 7, 45.
[12] R.V. Armstrong, 1973. In: Ultrafine-grain metals. Ed. L.K. Gordienko, Metallurgia, Moscow, p 7.
[13] P.G. Sanders, J.A. Eastman, and J.R. Weertman, 1997. Acta Mater. 45, 4019.