PRIMARY RESEARCH
Analysis of the role of rs2031920
and rs3813867 polymorphisms within the
cytochrome P450 2E1
gene in the risk
of squamous cell carcinoma
Hai Zhang, Haiyan Li and Huanxin Yu
*Abstract
Background: To explore the genetic effect of rs2031920 and rs3813867 polymorphisms within the cytochrome P450 2E1 (CYP2E1) gene on the risk of squamous cell carcinoma (SCC), a meta-analysis was performed.
Methods: The eligible case–control studies were obtained by database searching and screening, and the specific statistical analysis was performed with STATA 12.0 software.
Results: After the process of database searching and screening, a total of 32 case–control studies with 7435 cases and 10,466 controls were ultimately included in our meta-analysis. With regard to the rs2031920 C/T polymorphism, in comparison to controls, a reduced risk in cases of esophageal squamous cell carcinoma (ESCC) was detected for the models of allele T vs. allele C [P = 0.025, odds ratio (OR) = 0.67], carrier T vs. carrier C (P = 0.014, OR = 0.70), TT vs. CC (P = 0.029, OR = 0.65), CT vs. CC (P = 0.040, OR = 0.56), CT + TT vs. CC (P = 0.035, OR = 0.58). Similarly, a decreased SCC risk was observed for the rs3813867 G/C polymorphism in the allele, carrier, homozygote, dominant, and reces-sive models of overall SCC meta-analysis and “ESCC” subgroup analysis (all P < 0.05, OR < 1) and in all genetic models of “Asian” and “population-based control (PB)” subgroup analysis (all P < 0.05, OR < 1). Additionally, for the rs2031920/ rs3813867 haplotype, a decreased SCC risk was also detected in the overall SCC meta-analysis under the allele, carrier, homozygote and dominant model (all P < 0.05, OR < 1) and the subgroup analysis of “PB” under the allele, carrier, and dominant models (all P < 0.05, OR < 1).
Conclusions: Our meta-analysis supports the “T” allele carrier of the CYP2E1 rs2031920 C/T polymorphism and “C” allele carrier of the rs3813867 G/C polymorphism as protective factors for ESCC patients, especially in Asian populations.
Keywords: CYP2E1, SCC, Polymorphism, Risk
© The Author(s) 2018. This article is distributed under the terms of the Creative Commons Attribution 4.0 International License (http://creat iveco mmons .org/licen ses/by/4.0/), which permits unrestricted use, distribution, and reproduction in any medium, provided you give appropriate credit to the original author(s) and the source, provide a link to the Creative Commons license, and indicate if changes were made. The Creative Commons Public Domain Dedication waiver (http://creat iveco mmons .org/ publi cdoma in/zero/1.0/) applies to the data made available in this article, unless otherwise stated.
Background
The cytochrome P450 2E1 (CYP2E1) gene in Homo sapi-ens is located on chromosome 10 and is responsible for encoding a membrane-bound CYP2E1 protein, an impor-tant member of the human cytochrome P450 system [1]. The cytochrome P450 system works as a series of phase
I enzymes participating in a group of biological events, such as drug metabolism, oxidative reactions, or the detoxification of endogenous and exogenous substances [2, 3]. Polymorphic variants, existing in the functional genes of the cytochrome P450 system, are associated with the pathogenesis of several clinical cancers [2, 3]. For example, rs2031920 C/T with an RsaI restriction enzyme site and rs3813867 C/T with a PstI restriction enzyme site are two common single nucleotide poly-morphisms (SNP) within the 5′-flanking regions of the
CYP2E1 gene [4–6]. Three genotypes of c1/c1, c1/c2,
Open Access
*Correspondence: yuhuanxin66@163.com
c2/c2 were generated; rs2031920 and rs3813867 were in close linkage disequilibrium [4–6]. Furthermore, CYP2E1
polymorphisms were reported to be linked to several cancers, such as nasopharyngeal carcinoma [7], urinary cancers [6] and head and neck carcinoma [5], particularly in Asian populations.
Squamous cell carcinoma (SCC) is the most common histological type of several clinical cancers, such as head and neck cancer, esophageal cancer, skin cancer, lung cancer, and cervical cancer [8, 9]. The exact pathogen-esis of SCC remains unclear. Living habits (e.g., smok-ing, drinking), viral infection [e.g., human papillomavirus (HPV)], immune system, and polymorphic variants with many genes may be related to the risk of different SCC diseases [10–12]. Previously, we conducted an updated meta-analysis to explore the impact of MDM2 (MDM2 Proto-Oncogene) polymorphisms on SCC susceptibility and found that the GG genotype of MDM2 rs2279744 polymorphism may be associated with an increased risk of esophageal SCC in Asian populations [8].
We observed a different conclusion regarding the role of rs2031920 and rs3813867 polymorphisms within the CYP2E1 gene in the risk of SCC. Thus, we are very interested in investigating the role of the rs2031920 and rs3813867 polymorphisms within the CYP2E1 gene in the susceptibility to SCC, considering the lack of publi-cations of specific meta-analyses. We included a total of 32 case–control studies in our meta-analysis, which followed the preferred reporting items for systematic reviews and meta-analyses (PRISMA) [13].
Methods
Database searching and screening
Five electronic databases, including PubMed, Web of Sci-ence, Cochrane, Scopus and Chinese National Knowl-edge Infrastructure (CNKI), were searched prior to January 2018. We used a group of keywords: Carcinoma, Squamous Cell; Carcinomas, Squamous Cell; Squamous Cell Carcinomas; Squamous Cell Carcinoma; Carci-noma, Squamous; Carcinomas, Squamous; Squamous Carcinoma; Squamous Carcinomas; Carcinoma, Epider-moid; Carcinomas, EpiderEpider-moid; Epidermoid Carcinoma; Epidermoid Carcinomas; Carcinoma, Planocellular; Carcinomas, Planocellular; Planocellular Carcinoma; Planocellular Carcinomas; esophageal squamous cell carcinoma head and neck squamous cell carcinoma; lung squamous cell carcinoma; skin squamous cell car-cinoma; oral squamous cell carcar-cinoma; cervix squa-mous cell carcinoma; vagina squasqua-mous cell carcinoma; SCC; ESCC; HNSCC; LSCC; SSCC; OSCC; Cytochrome P-450 CYP2E1; Cytochrome P 450 CYP2E1; Cytochrome P-450-J; Cytochrome P 450 J; 4-Nitrophenol-2-Hydroxy-lase; 4 Nitrophenol 2 Hydroxy4-Nitrophenol-2-Hydroxy-lase; Dimethylnitrosamine
N-Demethylase; Dimethylnitrosamine N Demethyl-ase; Cytochrome P450 2E1; N-Nitrosodimethylamine Demethylase; N Nitrosodimethylamine Demethylase; CYP2E1; Cytochrome P-450 IIE1; Cytochrome P 450 IIE1; CYP IIE1; CYPIIE1; Cytochrome P-450 (ALC).
The retrieved studies were then reviewed and screened with the following exclusion criteria: (1) data based on animal experiments; (2) case reports, cohort studies or meeting abstracts; (3) without SNP data; (4) meta-analy-ses or reviews; (5) no SCC or CYP2E1 data; (6) duplicate studies; (7) no pathological typing data; (8) no genotype data. The data of genotype frequencies in cases and con-trols must have been provided in the selected studies.
Characteristics and quality assessment
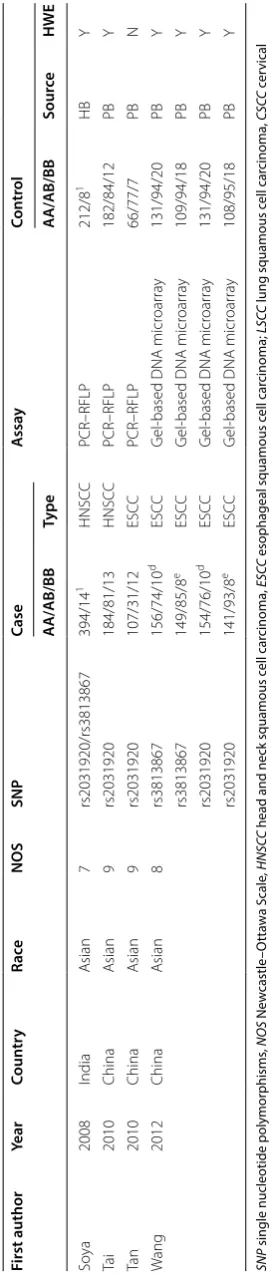
Based on the eligible articles, the authors extracted and summarized the usable information, including the first author’s name, year, country, race, SNP, genotype fre-quency, SCC type, control source, genotyping assay, and HWE (Hardy–Weinberg equilibrium), in a table. The Newcastle–Ottawa Scale (NOS) system was also used to assess the methodological quality of individual stud-ies. Only the studies with NOS score > 5 were ultimately included in our meta-analysis.
Heterogeneity and association test
STATA software (Stata Corporation, College Station, TX, USA) was used for our heterogeneity and asso-ciation tests. In the case of heterogeneity, the P value of Cochran’s Q statistic < 0.05 or I2 value > 50% were con-sidered to represent high heterogeneity among studies, which led to the use of a random effects model (DerSi-monian and Laird method). Otherwise, the fixed effects model (Mantel–Haenszel statistics) was used. In the association test, odds ratio (OR), 95% confidence interval (CI) and P value were computed to assess the association strength in the allele, carrier, homozygote, heterozygote, dominant, and recessive models. In addition, based on the factors of race, SCC type, control source and HWE, a series of subgroup analyses were performed as well.
Publication bias and sensitivity analysis
Begg’s test and Egger’s test were used to assess the poten-tial publication bias. A P value larger than 0.05 indicated the absence of potential publication bias. In addition, sensitivity analysis was used to evaluate the data stability and possible sources of heterogeneity.
Results
Process for identifying eligible studies
obtained, as presented in Fig. 1. Then, 113 duplicate records were excluded. Based on the exclusion criteria, 223 records were removed. Moreover, the lack of con-firmed pathological typing data or genotype frequency distribution resulted in the exclusion of another 25 cles. Finally, our meta-analysis involved a total of 32 arti-cles [14–45] containing 7435 cases and 10,466 controls. The characteristics of each study are presented in Table 1. No study had poor quality; the NOS score of all studies was greater than five (Table 1).
The rs2031920 polymorphism
A meta-analysis of rs2031920 and SCC risk was con-ducted on the allele model (allele T vs. allele C), carrier model (carrier T vs. carrier C), homozygote model (TT vs. CC), heterozygote model (CT vs. CC), dominant model (CT + TT vs. CC), and recessive model (TT vs. CC + CT). As shown in Table 2, 18 case–control studies were enrolled for the allele, carrier, heterozygote models, 15 case–control studies were enrolled for the homozy-gote model, 21 case–control studies were enrolled for the dominant model, and 16 case–control studies were enrolled for the recessive model. Pooling results
Table
1
C
har
ac
teristics of each study included in the meta-analy
sis First author Year Coun tr y Ra ce NOS SNP Case A ssa y Con tr ol AA/AB/BB Type AA/AB/BB So urce HWE Balaji 2011 India M ix ed 8 rs3813867 151/6/0 HNSC C TaqM
an allelic discr
imination 125/7/0 PB Y rs2031920 151/6/0 HNSC C TaqM
an allelic discr
imination 125/7/0 PB Y rs2031920/rs3813867 151/6/0 HNSC C TaqM
an allelic discr
SNP
single nucleotide polymor
phisms , NOS New castle –O tta w a S cale , HNS CC
head and neck squamous c
ell car
cinoma,
ES
CC
esophageal squamous c
ell car
cinoma;
LS
CC
lung squamous c
ell car cinoma, CS CC c er vical squamous c ell car cinoma, A major allele , B minor allele , PCR polymer
ase chain r
eac tion, RFLP restr ic tion fr ag men t-length polymor phism, SS CP single -str and c onf or ma tion polymor phism, NR not r epor ted , PB popula tion-based c on tr ol , HB hospital-based c on tr ol , HWE har dy –w einber g equilibr ium, Y P v
alue of HWE
>
0.05,
N P
v
alue of HWE
> 0.05 1 The genot ype fr equencies of “AA/AB + BB ” 2 The genot ype fr equencies of “AA + AB/BB ”
a Da
ta of or
al squamous c
ell car
cinoma
b Single HNSC
C
c M
ultiple HNSC
C
d Da
ta fr om “Chaoshan ” r eg ion
e Da
ta fr om “T aihang ” r eg ion Table 1 (c on tinued) First author Year Coun tr y Ra ce NOS SNP Case A ssa y Con tr ol AA/AB/BB Type AA/AB/BB So urce HWE Soy a 2008 India A sian 7 rs2031920/rs3813867 394/14 1 HNSC C PCR–RFLP 212/8 1 HB Y Ta i 2010 China A sian 9 rs2031920 184/81/13 HNSC C PCR–RFLP 182/84/12 PB Y Ta n 2010 China A sian 9 rs2031920 107/31/12 ESC C PCR–RFLP 66/77/7 PB N W ang 2012 China A sian 8 rs3813867 156/74/10 d ESC C G
el-based DNA micr
oar ra y 131/94/20 PB Y rs3813867 149/85/8 e ESC C G
el-based DNA micr
oar ra y 109/94/18 PB Y rs2031920 154/76/10 d ESC C G
el-based DNA micr
oar ra y 131/94/20 PB Y rs2031920 141/93/8 e ESC C G
el-based DNA micr
Table 2 Meta-analysis of CYP2E1 rs2031920 C/T polymorphism and SCC risk
Comparisons Group Number (study) OR 95% CI P (association)
Allele model (allele T vs. allele C) All 18 0.84 0.67–1.06 0.144
Asian 11 0.80 0.61–1.05 0.106
Caucasian 4 1.04 0.46–2.37 0.929
HNSCC 6 0.99 0.62–1.59 0.971
ESCC 6 0.67 0.48–0.95 0.025
LSCC 5 0.94 0.67–1.32 0.722
PB 15 0.83 0.68–1.02 0.076
HB 3 1.00 0.38–2.58 0.994
Y 14 0.92 0.75–1.13 0.449
N 4 0.60 0.37–0.99 0.048
Carrier model (carrier T vs. carrier C) All 18 0.83 0.69–1.01 0.064
Asian 11 0.80 0.60–1.00 0.053
Caucasian 4 0.99 0.49–1.99 0.982
HNSCC 6 0.96 0.65–1.43 0.849
ESCC 6 0.70 0.53–0.93 0.014
LSCC 5 0.92 0.68–1.25 0.602
PB 15 0.83 0.71–0.98 0.027
HB 3 0.98 0.44–2.16 0.955
Y 14 0.91 0.78–1.06 0.236
N 4 0.62 0.42–0.92 0.018
Homozygote model (TT vs. CC) All 15 0.87 0.65–1.15 0.324
Asian 11 0.83 0.62–1.12 0.324
Caucasian 3 2.18 0.66–7.19 0.202
HNSCC 4 1.35 0.69–2.62 0.379
ESCC 5 0.65 0.44–0.96 0.029
LSCC 5 1.27 0.69–2.33 0.440
PB 12 0.85 0.62–1.17 0.316
HB 3 0.94 0.49–1.79 0.847
Y 11 0.90 0.65–1.24 0.522
N 4 0.76 0.42–1.38 0.371
Heterozygote model (CT vs. CC) All 18 0.74 0.54–1.02 0.067
Asian 11 0.68 0.45–1.02 0.064
Caucasian 4 0.93 0.51–1.71 0.825
HNSCC 6 0.92 0.66–1.28 0.617
ESCC 6 0.56 0.32–0.97 0.040
LSCC 5 0.82 0.45–1.47 0.503
PB 15 0.73 0.56–0.96 0.024
HB 3 0.85 0.23–3.17 0.804
Y 14 0.85 0.69–1.05 0.139
N 4 0.48 0.23–1.01 0.054
Dominant model (CT + TT vs. CC) All 21 0.81 0.60–1.11 0.189
Asian 12 0.80 0.54–1.19 0.263
Caucasian 6 0.85 0.42–1.71 0.644
HNSCC 8 0.95 0.56–1.62 0.844
ESCC 6 0.58 0.35–0.96 0.035
LSCC 5 0.87 0.53–1.44 0.591
PB 18 0.81 0.61–1.07 0.138
HB 3 0.89 0.24–3.33 0.864
Y 15 0.90 0.72–1.12 0.345
suggested that there was no statistically significant dif-ference for the overall SCC risk between the case and control groups under any model (Table 2, P value of asso-ciation test > 0.05).
Moreover, we conducted a statistical analysis of the subgroup of race (Asian/Caucasian), SCC type (HNSCC/ ESCC/LSCC), control source (PB/HB), and HWE (Y/N). As shown in Table 2, in comparison with controls, a reduced ESCC risk was observed in the models of allele
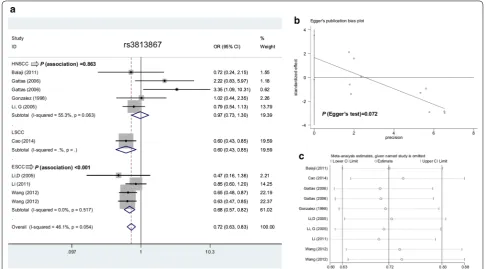
T vs. allele C (P = 0.025, OR = 0.67), carrier T vs. car-rier C (P = 0.014, OR = 0.70), TT vs. CC (P = 0.029, OR = 0.65), CT vs. CC (P = 0.040, OR = 0.56), CT + TT vs. CC (P = 0.035, OR = 0.58), but not TT vs. CC + CT (P = 0.770). Figure 2a shows forest plot data in subgroup analysis by SCC type under the allele model. The “T” allele carrier of the rs2031920 polymorphism within the
CYP2E1 gene seems to be linked to ESCC risk. OR odds ratio, CI confidence interval, HNSCC head and neck squamous cell carcinoma, ESCC esophageal squamous cell carcinoma, LSCC lung squamous cell carcinoma, PB population-based control, HB hospital-based control, Y P value of hardy–weinberg equilibrium > 0.05, N P value of hardy–weinberg equilibrium > 0.05
Table 2 (continued)
Comparisons Group Number (study) OR 95% CI P (association)
Recessive model (TT vs. CC + CT) All 16 1.21 0.80–1.83 0.362
Asian 12 1.20 0.78–1.84 0.402
Caucasian 3 2.11 0.23–19.71 0.512
HNSCC 5 1.88 0.91–3.90 0.089
ESCC 5 0.91 0.47–1.74 0.770
LSCC 5 1.47 0.81–2.69 0.206
PB 13 1.18 0.72–1.94 0.514
HB 3 1.24 0.66–2.34 0.497
Y 11 1.05 0.65–1.71 0.829
N 4 1.26 0.70–2.28 0.438
The rs3813867 polymorphism
We also conducted the overall and subgroup meta-analysis of rs3813867 and SCC risk under the allele (10 case–control studies), carrier (10 case–control studies),
homozygote (6 case–control studies), heterozygote (10 case–control studies), dominant (11 case–control stud-ies), and recessive (6 case–control studies) models. The positive results regarding the association between
Table 3 Meta-analysis of CYP2E1 rs3813867 G/C polymorphism and SCC risk
OR odds ratio, CI confidence interval, HNSCC head and neck squamous cell carcinoma, ESCC esophageal squamous cell carcinoma, PB population-based control, HB hospital-based control, Y P value of hardy–weinberg equilibrium > 0.05
Comparisons Group Number (study) OR 95% CI P (association)
Allele model (allele C vs. allele G) All 10 0.72 0.63–0.83 < 0.001
Asian 4 0.67 0.57–0.78 < 0.001
HNSCC 5 0.97 0.73–1.30 0.863
ESCC 4 0.68 0.57–0.82 < 0.001
PB 5 0.65 0.53–0.79 < 0.001
HB 5 0.80 0.66–0.97 0.021
Y 10 0.72 0.63–0.83 < 0.001
Carrier model (carrier C vs. carrier G) All 10 0.79 0.68–0.92 0.002
Asian 4 0.75 0.63–0.90 0.001
HNSCC 5 0.94 0.70–1.27 0.698
ESCC 4 0.77 0.63–0.93 0.008
PB 5 0.72 0.58–0.89 0.003
HB 5 0.85 0.70–1.05 0.133
Y 10 0.79 0.68–0.92 0.002
Homozygote model (CC vs. GG) All 6 0.38 0.24–0.61 < 0.001
Asian 4 0.30 0.18–0.50 < 0.001
HNSCC 2 2.34 0.58–9.34 0.230
ESCC 3 0.30 0.17–0.53 < 0.001
PB 3 0.43 0.24–0.75 0.003
HB 3 0.30 0.12–0.74 0.009
Y 6 0.38 0.24–0.61 < 0.001
Heterozygote model (GC vs. GG) All 10 0.82 0.63–107 0.150
Asian 4 0.75 0.56–0.99 0.045
HNSCC 5 1.15 0.62–2.16 0.657
ESCC 4 0.76 0.54–1.07 0.116
PB 5 0.66 0.51–0.84 0.001
HB 5 1.09 0.67–1.76 0.730
Y 10 0.82 0.63–107 0.150
Dominant model (GC + CC vs. GG) All 11 0.76 0.60–0.97 0.024
Asian 4 0.68 0.54–0.86 0.002
HNSCC 6 1.01 0.62–1.65 0.961
ESCC 4 0.70 0.53–0.92 0.011
PB 6 0.62 0.50–0.77 < 0.001
HB 5 1.03 0.65–1.62 0.916
Y 11 0.76 0.60–0.97 0.024
Recessive model (CC vs. GG + GC) All 6 0.43 0.27–0.68 < 0.001
Asian 4 0.34 0.20–0.57 < 0.001
HNSCC 2 2.39 0.60–9.53 0.218
ESCC 3 0.35 0.20–0.60 < 0.001
PB 3 0.49 0.28–0.86 0.013
HB 3 0.31 0.13–0.77 0.011
CYP2E1 rs3813867 and SCC risk were detected in the overall SCC meta-analysis and subgroup analysis of “ESCC” and “Y” (P value of Hardy–Weinberg equi-librium > 0.05) under all genetic models (Table 3, all
P < 0.05, OR < 1), only apart from the heterozygote model (P = 0.150). A decreased SCC risk was also detected in the subgroup analysis of “Asian” and “PB” under all genetic models (Table 3, all P < 0.05, OR < 1). Figure 3a shows the forest plot data of subgroup analysis by SCC type under the allele model. The “C” allele carrier of
CYP2E1 rs3813867 polymorphism may be associated with the risk of SCC, especially the ESCC cases in Asian populations.
The rs2031920/rs3813867 haplotype
The results of overall and subgroup meta-analysis of the rs2031920/rs3813867 haplotype and SCC risk under the allele (five case–control studies), carrier (five studies), homozygote (three studies), heterozygote (five studies), dominant (seven studies), and recessive (three studies) models are shown in Table 4. We observed a decreased SCC risk in the overall SCC meta-analysis under the allele, carrier, homozygote, and dominant models (Table 4, all P < 0.05, OR < 1), and the subgroup analysis of “PB” under the allele, carrier, and dominant models (all P < 0.05, OR < 1). These results suggested a potential link between the c1/c2 or c2/c2 of rs2031920/rs3813867
haplotype and SCC risk, which still requires more case– control studies.
Heterogeneity evaluation
When assessing the heterogeneity level, the fixed model was used for the TT vs. CC model of rs2031920 due to the lack of high heterogeneity (Table 5, I2= 38.3%, P value of heterogeneity = 0.066), however, the random model was utilized for others. The fixed model was used for the allele, carrier, homozygote and recessive models of rs3813867 (Table 5, all I2 < 50.0%, P value of heterogeneity > 0.05); and the allele, carrier, homozygote, dominant, and recessive models of the rs2031920/rs3813867 haplotype (Table 5, all I2 < 50.0%, P value of heterogeneity > 0.05).
Publication bias and sensitivity analysis
Begg’s and Egger’s tests did not provide confirmed evi-dence of obvious publication bias in the above com-parisons (Table 5, all P value of Begg’s test and Egger’s test> 0.05) apart from the CT + TT vs. CC model of rs2031920 (P value of Egger’s test = 0.037). Figures 2b and 3b show the Egger’s publication bias plot of rs2031920 and rs3813867 under the allele model, respectively. Additionally, a relatively stable conclusion was obtained by sensitivity analysis results (Fig. 2c for allele model of rs2031920; Fig. 3c for allele model of rs3813867; data for others not shown).
Discussion
CYP2E1 rs2031920 was related to the risk of ESCC in a high-incidence region (Kashmir, India) [15]. Neverthe-less, negative results were also reported in one study from South Africa [29] and in a Huai’an population from China [34]. Meta-analysis can address this conflict-ing issue. We did not observe published meta-analyses specific for the genetic relationship between CYP2E1
rs2031920, rs3813867 SNP and ESCC risk. In this study, we provide evidence that the “T” allele carrier of the rs2031920 polymorphism and the “C” allele carrier of the CYP2E1 rs3813867 polymorphism may be associated with a decreased risk of ESCC, especially in Asian popu-lations because most of the included case–control studies were from China or India.
Tang et al. [46] selected 21 case–control studies for a meta-analysis in 2010 and investigated the potential effect of CYP2E1 rs2031920 and rs3813867 in the risk of head and neck cancer; they found that the homozy-gote genotype of CYP2E1 rs2031920/rs3813867 may be linked to the risk of head and neck cancer, especially in Asian populations. Zhuo et al. [5] performed another meta-analysis containing 43 case–control studies in 2016 and reported a positive association between CYP2E1
rs2031920/rs3813867 and head and neck cancer risk under the homozygote model. However, the subgroup analysis based of HNSCC was not performed in the two meta-analyses. In our meta-analysis, we failed to observe the statistical relationship between CYP2E1 rs2031920
Table 4 Meta-analysis of CYP2E1 rs2031920/rs3813867 haplotype and SCC risk
OR odds ratio, CI confidence interval, HNSCC head and neck squamous cell carcinoma, PB population-based control, Y P value of hardy–weinberg equilibrium > 0.05
Comparisons Group Number
(study) OR 95% CI Pciation)
(asso-Allele c2 vs.
allele c1 All 5 0.65 0.49–0.86 0.003
HNSCC 3 1.01 0.57–1.78 0.977
PB 3 0.57 0.42–0.79 0.001
Y 4 0.98 0.65–1.46 0.913
Carrier c2 vs.
carrier c1 All 5 0.73 0.53–1.00 0.047
HNSCC 3 0.98 0.55–1.75 0.945
PB 3 0.65 0.45–0.93 0.019
Y 4 0.98 0.64–1.50 0.938
c2c2 vs. c1c1 All 3 0.41 0.20–0.86 0.018 c1c2 vs. c1c1 All 5 0.75 0.43–1.30 0.309
HNSCC 3 0.96 0.53–1.71 0.877
PB 3 0.63 0.29–1.35 0.231
Y 4 1.00 0.64–1.56 0.990
c1c2 + c2c2 vs.
c1c1 All 7 0.72 0.55–0.94 0.016
HNSCC 4 0.97 0.59–1.57 0.892
PB 4 0.64 0.47–0.87 0.005
Y 6 0.97 0.70–1.35 0.871
c2c2 vs.
c1c1 + c1c2 All 3 0.55 0.26–1.13 0.103
Table 5 Heterogeneity test and publication analysis
SNP single nucleotide polymorphisms, F fixed, R random
SNP Comparisons I2 (%) P (heterogeneity) F/R P (Begg’s test) P (Egger’s test)
rs2031920 (C/T) Allele T vs. allele C 77.2 < 0.001 R 0.649 0.054
Carrier T vs. carrier C 58.9 0.001 R 0.449 0.077
TT vs. CC 38.3 0.066 F 0.276 0.242
CT vs. CC 82.1 < 0.001 R 0.544 0.544
CT + TT vs. CC 83.1 < 0.001 R 0.608 0.037
TT vs. CC + CT 57.4 0.002 R 0.685 0.207
rs3813867 (G/C) Allele C vs. allele G 46.1 0.054 F 0.074 0.072
Carrier C vs. carrier G 28.4 0.183 F 0.107 0.150
CC vs. GG 45.4 0.103 F 0.707 0.651
GC vs. GG 52.4 0.026 R 0.107 0.230
GC + CC vs. GG 47.3 0.041 R 0.062 0.150
CC vs. GG + GC 43.6 0.115 F 1.000 0.732
rs2031920 + rs3813867 (c1/c2) Allele c2 vs. allele c1 49.8 0.093 F 1.000 0.184
Carrier c2 vs. carrier c1 15.5 0.316 F 0.806 0.245
c2c2 vs. c1c1 0.0 0.671 F 0.296 0.269
c1c2 vs. c1c1 53.1 0.074 R 0.806 0.327
c1c2 + c2c2 vs. c1c1 46.3 0.083 F 0.764 0.227
SNP, rs3813867 SNP, rs2031920/rs3813867 haplotype and HNSCC risk.
Cao et al. [18] selected 17 case–control studies with 2639 cases and 3450 controls for a meta-analysis of the association between CYP2E1 rs3813867 and the risk of lung cancer in the Chinese population in 2014, and showed a potential link between the “C” allele carriers of
CYP2E1 rs3813867 and a decreased risk of lung cancer. In our meta-analysis, very limited data were included after our strict selection; thus, no statistical evidence regard-ing the role of CYP2E1 rs3813867 in LSCC risk was pro-vided. However, we enrolled five case–control studies [26–28, 33, 39] in our subgroup analysis of “LSCC” for
CYP2E1 rs2031920 and found a negative genetic relation-ship, which was partly in line with the previous data from LSCC subgroup analysis [47].
The close linkage disequilibrium between rs2031920 and rs3813867 for the CYP2E1 gene was reported [4–6]. For example, the same genotype frequency distribution was observed in case and control groups of south Indians [14]. However, we observed different genotype frequency distributions between case and control in some other reports [29, 45]. For example, in the Taihang regions of China, the genotype frequency of rs2031920 differs from that of rs3813867 in both the case and control groups [45]. In addition, most case–control studies only meas-ured the single SNP. Thus, we performed a meta-analy-sis of rs2031920 and rs3813867, respectively; then, we analyzed the role of the rs2031920/rs3813867 haplotype based on the available data. We also conducted an overall and subgroup meta-analysis with four factors (race, SCC type, control source and HWE) under the allele, carrier, heterozygote and dominant models.
To enroll as many eligible case–control studies as pos-sible, a search of five independent online databases (Pub-Med, Web of Science, Cochrane, Scopus and CNKI) was performed using the overall SCC terms and specific terms, such as ESCC, HNSCC, LSCC and SSCC. Based on our strict criteria, we removed the articles that con-tained the unconfirmed pathological typing information or failed to provide a genotype frequency distribution in both case and control studies. We observed the absence of large publication bias and the stability of data through Begg’s/Egger’s tests and sensitivity analyses.
Despite this, the shortcomings of the small sample size may still have affected our statistical power. Only one case–control study [38] was included in the “cervi-cal SCC” subgroup analysis of rs2031920 under the allele, carrier, homozygote, heterozygote, and recessive mod-els. Only one case–control study [18] was enrolled in the “lung SCC” subgroup analysis of rs3813867 under all genetic models. Only two studies [25, 36] were enrolled
in the “ESCC” subgroup analysis of the rs2031920/ rs3813867 haplotype.
In this study, we focused on the genetic role of two polymorphisms within the CYP2E1 gene in our meta-analysis, and we still cannot rule out the potential genetic effect of other CYP2E1 polymorphisms (e.g., rs6413432 T/A) and the variant combination between CYP2E1 and other related genes (e.g., MDM2).
For rs3813867, we did not observe obvious heterogene-ity in the allele, carrier, homozygote and recessive mod-els, only apart from the heterozygote model. Reduced heterogeneity levels were also observed in the ESCC subgroup analysis compared to the overall analysis. For example, in the allele model, a relatively high heteroge-neity level in overall meta-analysis (P value of heteroge-neity = 0.054, I2= 46.1%) changed to a relatively lower heterogeneity level in the ESCC subgroup (P value of heterogeneity = 0.517, I2= 0.0%). A slight reduction was also observed for the heterozygote model (P value of heterogeneity from 0.026 to 0.101, I2 value from 52.4 to 51.9%), even though significant between-study heteroge-neity existed in the ESCC subgroup. We thus performed another meta-analysis, which only enrolled the available case–control studies of ESCC, and similar results were obtained (data not shown).
In addition, we observed remarkable heterogeneity for the allele, carrier, heterozygote, dominant and reces-sive modes of rs2031920. Even though a stable result was detected in the sensitivity analysis, and no decreased het-erogeneity level was observed in the subgroup of ESCC compared with overall meta-analysis. This suggested that mixed factors contributed to the source of heterogene-ity of specific ESCC subgroups. We tried to analyze the clinical characterizations, such as gender, age or concom-itant pathologies, within the enrolled case–control stud-ies. However, in the ESCC, only six eligible case–control studies were included in the ESCC subgroup, and the adjustment data was very limited for categorization. A larger sample size is required to conduct a more in-depth analysis.
Conclusions
In conclusion, our meta-analysis data demonstrated that the CYP2E1 rs2031920 and rs3813867 polymorphisms may be associated with the risk of ESCC. However, this conclusion should be confirmed with more extractable case–control studies.
Abbreviations
NOS: Newcastle–Ottawa Scale; OR: odds ratio; CI: confidence interval; PB: population-based control; HB: hospital-based control; HNSCC: head and neck squamous cell carcinoma; LSCC: lung squamous cell carcinoma; CSCC: cervical squamous cell carcinoma; RFLP: restriction fragment-length polymorphism; SSCP: single-strand conformation polymorphism.
Authors’ contributions
HZ and HY designed the study. HZ, HL and HY extracted, analyzed, and interpreted the data. HZ and HY drafted the manuscript. All authors read and approved the final manuscript.
Acknowledgements
We thank American Journal Experts (http://bit.ly/AJE-HS) for professional help with English usage in this manuscript.
Competing interests
The authors declare that they have no competing interests.
Availability of data and materials
All data generated or analyzed during the present study are included in this published article.
Consent for publication Not applicable.
Ethics approval and consent to participate Not applicable.
Funding Not applicable.
Publisher’s Note
Springer Nature remains neutral with regard to jurisdictional claims in pub-lished maps and institutional affiliations.
Received: 14 March 2018 Accepted: 19 April 2018
References
1. Lewis DF, Bird MG, Parke DV. Molecular modelling of CYP2E1 enzymes from rat, mouse and man: an explanation for species differences in butadiene metabolism and potential carcinogenicity, and rationalization of CYP2E substrate specificity. Toxicology. 1997;118:93–113.
2. Daly AK. Polymorphic variants of cytochrome P450: relevance to cancer and other diseases. Adv Pharmacol. 2015;74:85–111.
3. He X, Feng S. Role of metabolic enzymes P450 (CYP) on activating procarcinogen and their polymorphisms on the risk of cancers. Curr Drug Metab. 2015;16:850–63.
4. Wang FJ, Wang Y, Niu T, Lu WX, Sandford AJ, He JQ. Update meta-analysis of the CYP2E1 RsaI/PstI and DraI polymorphisms and risk of antitubercu-losis drug-induced hepatotoxicity: evidence from 26 studies. J Clin Pharm Ther. 2016;41:334–40.
5. Zhuo X, Song J, Liao J, Zhou W, Ye H, Li Q, et al. Does CYP2E1 RsaI/PstI polymorphism confer head and neck carcinoma susceptibility?: a meta-analysis based on 43 studies. Medicine. 2016;95:e5156.
6. Fang Z, Wu Y, Zhang N. Association between CYP2E1 genetic polymorphisms and urinary cancer risk: a meta-analysis. Oncotarget. 2017;8:86853–64.
7. Yao K, Qin H, Gong L, Zhang R, Li L. CYP2E1 polymorphisms and naso-pharyngeal carcinoma risk: a meta-analysis. Eur Arch Oto-Rhino-Laryngol. 2017;274:253–9.
8. Yu H, Li H, Zhang J, Liu G. Influence of MDM2 polymorphisms on squa-mous cell carcinoma susceptibility: a meta-analysis. OncoTargets Ther. 2016;9:6211–24.
9. Liu N, Liu GJ, Liu J. Genetic association between TNF-alpha pro-moter polymorphism and susceptibility to squamous cell carcinoma,
basal cell carcinoma, and melanoma: a meta-analysis. Oncotarget. 2017;8:53873–85.
10. Yang CS, Chen X, Tu S. Etiology and prevention of esophageal cancer. Gastrointest Tumors. 2016;3:3–16.
11. Solomon B, Young RJ, Rischin D. Head and neck squamous cell carci-noma: genomics and emerging biomarkers for immunomodulatory cancer treatments. Semin Cancer Biol. 2018. https ://doi.org/10.1016/j. semca ncer.2018.01.008.
12. Bonastre E, Brambilla E, Sanchez-Cespedes M. Cell adhesion and polarity in squamous cell carcinoma of the lung. J Pathol. 2016;238:606–16. 13. Moher D, Liberati A, Tetzlaff J, Altman DG. Preferred reporting items for
systematic reviews and meta-analyses: the PRISMA statement. PLoS Med. 2009;6:e1000097.
14. Balaji L, Singh KB, Bhaskar LV. Genetic polymorphisms of the CYP2E1 gene do not contribute to oral cancer susceptibility in south Indians. Asian Pac J Cancer Prev. 2011;12:1523–7.
15. Bhat GA, Shah IA, Makhdoomi MA, Iqbal B, Rafiq R, Nabi S, et al. CYP1A1 and CYP2E1 genotypes and risk of esophageal squamous cell carcinoma in a high-incidence region, Kashmir. Tumour Biol. 2014;35:5323–30. 16. Bouchardy C, Hirvonen A, Coutelle C, Ward PJ, Dayer P, Benhamou S. Role
of alcohol dehydrogenase 3 and cytochrome P-4502E1 genotypes in susceptibility to cancers of the upper aerodigestive tract. Int J Cancer. 2000;87:734–40.
17. Brocic M, Supic G, Zeljic K, Jovic N, Kozomara R, Zagorac S, et al. Genetic polymorphisms of ADH1C and CYP2E1 and risk of oral squamous cell carcinoma. Otolaryngol Head Neck Surg. 2011;145:586–93. 18. Cao L, Lin J, He B, Wang H, Rao J, Liu Y, et al. A regulatory variant in
CYP2E1 affects the risk of lung squamous cell carcinoma. Tumour Biol. 2014;35:455–62.
19. Cury NM, Russo A, Galbiatti AL, Ruiz MT, Raposo LS, Maniglia JV, et al. Polymorphisms of the CYP1A1 and CYP2E1 genes in head and neck squamous cell carcinoma risk. Mol Biol Rep. 2012;39:1055–63. 20. Ferreira PM, Catarino R, Pereira D, Matos A, Pinto D, Coelho A, et al.
Cervical cancer and CYP2E1 polymorphisms: implications for molecular epidemiology. Eur J Clin Pharmacol. 2006;62:15–21.
21. Gajecka M, Rydzanicz M, Jaskula-Sztul R, Kujawski M, Szyfter W, Szyfter K. CYP1A1, CYP2D6, CYP2E1, NAT2, GSTM1 and GSTT1 polymorphisms or their combinations are associated with the increased risk of the laryngeal squamous cell carcinoma. Mutat Res. 2005;574:112–23.
22. Gattas GJ, de Carvalho MB, Siraque MS, Curioni OA, Kohler P, Eluf-Neto J, et al. Genetic polymorphisms of CYP1A1, CYP2E1, GSTM1, and GSTT1 associated with head and neck cancer. Head Neck. 2006;28:819–26. 23. Gonzalez MV, Alvarez V, Pello MF, Menendez MJ, Suarez C, Coto E. Genetic
polymorphism of N-acetyltransferase-2, glutathione S-transferase-M1,
and cytochromes P450IIE1 and P450IID6 in the susceptibility to head and neck cancer. J Clin Pathol. 1998;51:294–8.
24. Guo LK, Zhang CX, Guo XF. Association of genetic polymorphisms of aldehyde dehydrogenase-2 and cytochrome P450 2E1-RsaI and alcohol consumption with oral squamous cell carcinoma. Zhongguo Yi Xue Ke Xue Yuan Xue Bao. 2012;34:390–5.
25. Guo YM, Wang Q, Liu YZ, Chen HM, Qi Z, Guo QH. Genetic polymorphisms in cytochrome P4502E1, alcohol and aldehyde dehydrogenases and the risk of esophageal squamous cell carcinoma in Gansu Chinese males. World J Gastroenterol. 2008;14:1444–9.
26. Huang YH, Wang QS, Zhu LZ, Zhang Y. Relationship between cytochrome P~ 4~ 5~ 0 2E1 genetic polymorphism and lung cancer in Chinese Han subjects. Chin J Clin Pharmacol. 2000;16:350–2.
27. Le Marchand L, Sivaraman L, Pierce L, Seifried A, Lum A, Wilkens LR, et al. Associations of CYP1A1, GSTM1, and CYP2E1 polymorphisms with lung cancer suggest cell type specificities to tobacco carcinogens. Cancer Res. 1998;58:4858–63.
28. Lee KM, Kang D, Lee SJ, Park SK, Lee KH, Choi JY, et al. Interactive effect of genetic polymorphism of glutathione S-transferase M1 and smoking on squamous cell lung cancer risk in Korea. Oncol Rep. 2006;16:1035–9. 29. Li D, Dandara C, Parker MI. Association of cytochrome P450 2E1 genetic
polymorphisms with squamous cell carcinoma of the oesophagus. Clin Chem Lab Med. 2005;43:370–5.
•fast, convenient online submission
•
thorough peer review by experienced researchers in your field
• rapid publication on acceptance
• support for research data, including large and complex data types
•
gold Open Access which fosters wider collaboration and increased citations maximum visibility for your research: over 100M website views per year
•
At BMC, research is always in progress.
Learn more biomedcentral.com/submissions
Ready to submit your research? Choose BMC and benefit from: cancer susceptibility: a case-control study. Acta Acad Med Mil Tertiae.
2008;30:1231–4.
31. Li G, Liu Z, Sturgis EM, Chamberlain RM, Spitz MR, Wei Q. CYP2E1 G1532C, NQO1 Pro187Ser, and CYP1B1 Val432Leu polymorphisms are not associ-ated with risk of squamous cell carcinoma of the head and neck. Cancer Epidemiol Biomarkers Prev. 2005;14:1034–6.
32. Li QD, Li H, Wang MS, Diao TY, Zhou ZY, Fang QX, et al. Multi-susceptibility genes associated with the risk of the development stages of esopha-geal squamous cell cancer in Feicheng County. BMC Gastroenterol. 2011;11:74.
33. Li Z, Tan W, Shao K. Susceptibility to lung cancer in Chinese is associated with genetic polymorphism in cytochrome P4502E1. Zhonghua Zhong Liu Za Zhi. 2000;22:5–7.
34. Liu R, Yin LH, Pu YP. Association of combined CYP2E1 gene polymorphism with the risk for esophageal squamous cell carcinoma in Huai’an popula-tion, China. Chin Med J. 2007;120:1797–802.
35. Matthias C, Jahnke V, Fryer AA, Strange RC. First results on the influence of polymorphisms at glutathione S-transferase, cytochrome P450, and tumor necrosis factor gene loci on the development of multiple head and neck cancer. Laryngorhinootologie. 2003;82:25–30.
36. Morita S, Yano M, Shiozaki H, Tsujinaka T, Ebisui C, Morimoto T, et al. CYP1A1, CYP2E1 and GSTM1 polymorphisms are not associated with susceptibility to squamous-cell carcinoma of the esophagus. Int J Cancer. 1997;71:192–5.
37. Neuhaus T, Ko YD, Lorenzen K, Fronhoffs S, Harth V, Brode P, et al. Asso-ciation of cytochrome P450 2E1 polymorphisms and head and neck squamous cell cancer. Toxicol Lett. 2004;151:273–82.
38. Nishino K, Sekine M, Kodama S, Sudo N, Aoki Y, Seki N, et al. Cigarette smoking and glutathione S-transferase M1 polymorphism associ-ated with risk for uterine cervical cancer. J Obstet Gynaecol Res. 2008;34:994–1001.
39. Oyama T, Kawamoto T, Matsumoto A, Isse T, Ozaki S, Yasumoto K. Evi-dence based prevention (EBP): eviEvi-dence-based approach to prevention
of lung cancer by application of cytochrome 2E1 polymorphism. J UOEH. 2002;24:413–21.
40. Pandey R, Mehrotra D, Catapano C, Choubey V, Sarin R, Mahdi AA, et al. Association of mitochondrial deoxyribonucleic acid mutation with poly-morphism in CYP2E1 gene in oral carcinogenesis. J Oral Biol Craniofac Res. 2012;2:4–9.
41. Ruwali M, Parmar D. Association of functionally important polymor-phisms in cytochrome P450s with squamous cell carcinoma of head and neck. Indian J Exp Biol. 2010;48:651–65.
42. Soya SS, Vinod T, Reddy KS, Gopalakrishnan S, Adithan C. CYP2E1 polymorphisms and gene-environment interactions in the risk of upper aerodigestive tract cancers among Indians. Pharmacogenomics. 2008;9:551–60.
43. Tai J, Yang M, Ni X, Yu D, Fang J, Tan W, et al. Genetic polymorphisms in cytochrome P450 genes are associated with an increased risk of squamous cell carcinoma of the larynx and hypopharynx in a Chinese population. Cancer Genet Cytogenet. 2010;196:76–82.
44. Tan W, Song N, Wang GQ, Liu Q, Tang HJ, Kadlubar FF, et al. Impact of genetic polymorphisms in cytochrome P450 2E1 and glutathione S-transferases M1, T1, and P1 on susceptibility to esophageal cancer among high-risk individuals in China. Cancer Epidemiol Biomarkers Prev. 2000;9:551–6.
45. Wang D, Su M, Tian D, Liang S, Zhang J. Associations between CYP1A1 and CYP2E1 polymorphisms and susceptibility to esophageal cancer in Chaoshan and Taihang areas of China. Cancer Epidemiol. 2012;36:276–82. 46. Tang K, Li Y, Zhang Z, Gu Y, Xiong Y, Feng G, et al. The PstI/RsaI and DraI
polymorphisms of CYP2E1 and head and neck cancer risk: a meta-analy-sis based on 21 case-control studies. BMC Cancer. 2010;10:575. 47. Ye XH, Song L, Peng L, Bu Z, Yan SX, Feng J, et al. Association between the