R E S E A R C H
Open Access
Changes in diet and physical activity
resulting from the
Strong Hearts, Healthy
Communities
randomized cardiovascular
disease risk reduction multilevel
intervention trial
Sara C. Folta
1, Lynn Paul
2, Miriam E. Nelson
1, David Strogatz
3, Meredith Graham
4, Galen D. Eldridge
5,
Michael Higgins
6, David Wing
6and Rebecca A. Seguin-Fowler
7*Abstract
Background:Women living in rural areas face unique challenges in achieving a heart-healthy lifestyle that are related to multiple levels of the social-ecological framework. The purpose of this study was to evaluate changes in diet and physical activity, which are secondary outcomes of a community-based, multilevel cardiovascular disease risk reduction intervention designed for women in rural communities.
Methods:Strong Hearts, Healthy Communitieswas a six-month, community-randomized trial conducted in 16 rural
towns in Montana and New York, USA. Sedentary women aged 40 and older with overweight and obesity were recruited. Intervention participants (eight towns) attended twice weekly exercise and nutrition classes for 24 weeks (48 total). Individual-level components included aerobic exercise, progressive strength training, and healthy eating practices; a civic engagement component was designed to address social and built environment factors to support healthy lifestyles. The control group (eight towns) attended didactic healthy lifestyle classes monthly (six total). Dietary and physical activity data were collected at baseline and post-intervention. Dietary data were collected using automated self-administered 24-h dietary recalls, and physical activity data were collected by accelerometry and self-report. Data were analyzed using multilevel linear regression models with town as a random effect.
Results:At baseline, both groups fell short of meeting many recommendations for cardiovascular health. Compared to the control group, the intervention group realized significant improvements in intake of fruit and vegetables combined (difference: 0.6 cup equivalents per day, 95% CI 0.1 to 1.1,p= .026) and in vegetables alone (difference: 0.3 cup equivalents per day, 95% CI 0.1 to 0.6,p= .016). For physical activity, there were no statistically significant between-group differences based on accelerometry. By self-report, the intervention between-group experienced a greater increase in walking MET minutes per week (difference: 113.5 MET-minutes per week, 95% CI 12.8 to 214.2,p= .027).
Conclusions:Between-group differences in dietary and physical activity behaviors measured in this study were minimal. Future studies should consider how to bolster behavioral outcomes in rural settings and may also continue to explore the value of components designed to enact social and environmental change.
Trial registration:clinicaltrials.govIdentifier: NCT02499731. Registered 16 July 2015.
Keywords:Cardiovascular disease, Rural, Community, Nutrition, Diet, Exercise, Physical activity
© The Author(s). 2019Open AccessThis article is distributed under the terms of the Creative Commons Attribution 4.0 International License (http://creativecommons.org/licenses/by/4.0/), which permits unrestricted use, distribution, and reproduction in any medium, provided you give appropriate credit to the original author(s) and the source, provide a link to the Creative Commons license, and indicate if changes were made. The Creative Commons Public Domain Dedication waiver (http://creativecommons.org/publicdomain/zero/1.0/) applies to the data made available in this article, unless otherwise stated.
* Correspondence:[email protected]
Background
Cardiovascular disease (CVD) is the leading cause of death for women in the USA, causing approximately 400,000 female deaths per year [1], and heart disease and stroke are among the leading causes of disability [2]. Annual age-adjusted death rates for heart disease are higher in nonmetropolitan areas compared to metropol-itan areas [3]. There is a need to address cardiovascular risk, particularly among rural women, who face unique challenges to accessing healthcare and achieving healthy lifestyle behaviors [4].
There is strong epidemiological evidence for the con-tribution of diet and physical activity to both
cardiovas-cular health and disease risk among women [5, 6].
Specific foods, such as fruits and vegetables [7–18], and overall dietary patterns, such as the Dietary Approaches to Stop Hypertension (DASH) [19, 20] and Mediterra-nean [21, 22] diets, are associated with reduced risk of CVD. However, few women are meeting recommenda-tions for a heart-healthy diet. A study that used Na-tional Health and Nutrition Examination Survey data to assess diet quality among the U.S. population classified 42% of women as having a poor diet and less than 2% as having an ideal diet based on the American Heart
Association (AHA) 2020 Strategic Impact Goals [23].
The difference between guidelines and intakes may be exacerbated in a rural setting. For example, there is some evidence that adults in rural areas consume fewer fruits and vegetables compared to non-rural counter-parts [24].
There is likewise strong evidence for the role of phys-ical activity in prevention of CVD. The AHA score for cardiovascular health includes meeting public health guidelines for physical activity as one of the components [5]. Studies demonstrate that higher amounts or inten-sities of aerobic activity confer a lower risk of CVD in adults [25]. There is also increasing evidence that resist-ance training provides additional benefits in reducing CVD risk among women [26]. Sedentary behaviors (sit-ting, television viewing, screen time, and computer use) have also been examined and appear to be independently associated with increased risk of CVD in adults [27]. Less than one-fifth of women (18%) are meeting current public health guidelines for aerobic and strengthening physical activity [2], and U.S. adults are spending 6 to 8 h per day engaging in sedentary activities [27]. Adults in rural areas are less likely to meet guidelines for aerobic physical activity [2], although there is some data suggest-ing that they spend more time in light intensity domestic physical activity compared to urban adults [28].
There are many barriers to consuming a heart-healthy diet and engaging in leisure-time physical activity in rural communities. Low population density typically means fewer supermarkets and fresh food markets. This can
result in greater travel time (generally sitting in a vehicle), reduced overall food supply, and diminished quality, quantity, and intake of healthy foods, such fresh fruits and vegetables [29–36]. There is also evidence that access to recreational facilities and fitness classes and activities is limited [37–39] and sidewalks may be lacking [40]. A higher poverty rate [41] can also lead to decreased finan-cial access and purchasing power for both healthier foods [30] and physical activity opportunities [42,43]. Social and cultural norms and attitudes further challenge achieving a heart-healthy diet and engaging in leisure-time physical activity in rural areas [44–46]. Finally, at a personal level, in rural areas barriers to a healthier diet include knowledge gaps and negative perceptions about nutri-tious foods, including taste, cost, and preparation time [44, 45, 47, 48]; barriers to physical activity include childcare and caregiving duties, poor health, fear of injury, and lack of motivation [42, 43, 49, 50].
There are few community-based interventions de-signed for CVD prevention among women in the rural settings [45, 51–55]. Those that exist utilize behavioral theory, most commonly Social Cognitive Theory and the Transtheoretical Model. However, findings from a systematic review were that primary prevention pro-grams for rural women had little effect on CVD risk factors, especially in the long-term [56]. In recent years, the social-ecological model has gained general endorse-ment for understanding and changing diet and physical activity behaviors [57–59], and offers promise as an approach that can account for the unique social and environmental barriers in the rural environment. How-ever, only one of the previous studies utilized a social-ecological model [53].
agents of change for their community, leading to im-proved food and/or physical activity environments. Civic engagement therefore could help promote built
environ-ment and policy changes that further reinforce
individual-level change through reciprocal determinism. In a cluster randomized, controlled trial SHHC led to improvements in weight and body mass index, C-reactive protein, AHA’s Life’s Simple 7 score, and 10-year risk of cardiovascular disease [62]. This paper expands on these data by examining the secondary outcomes of changes in diet and physical activity resulting fromSHHC, an inter-vention designed with the rural context specifically in mind. It is important to understand behavioral outcomes in interventions conducted within a rural context given the specific challenges related to the achievement of a heart-healthy dietary pattern and physical activity in these settings.
Methods
SHHC was tested in a cluster randomized, controlled
trial. The study protocol has been previously published [63]. Randomization occurred at the town level: half of
the towns in each state were randomized to the SHHC
intervention program (n= 8), and half were randomized to a control program (n = 8). Towns were matched into pairs by population size, rural-urban community area score, and state, and then the Director of the Cornell Statistical Consulting Unit used JMP software (SAS In-stitute Inc., Cary, NC, USA) to randomly assign each site in the pair to either the intervention or the control. Study staff enrolled participants.
Recruitment and eligibility
Towns in Montana (12 towns) and New York (4 towns) were selected by the local lead collaborators (Paul in Montana, Strogatz in New York) in partnership with the Principal Investigator (Seguin-Fowler). Towns needed to meet criteria for rurality based on Rural-Urban
Com-muting Area [64] and medically underserved areas or
population designations [65]. Selected towns also had a
county extension educator/agent (Montana) [66] or a
health educator affiliated with a local healthcare system (New York) with availability, capacity, and interest in running the program. Extension educators/agents and health educators served as program leaders, rather than research personnel, with program sustainability in mind. In the planning phase of the study, local leaders were in-volved in community audits and focus group recruit-ment, and they received extensive training on the program itself. Participants were recruited through flyers, community bulletin boards, social media, radio, direct mail postcards, and newspapers, as well as through churches, healthcare providers, human services, and“word of mouth.” Inclusion criteria were female sex,
age 40 years or older, overweight or obese (body mass index≥25), sedentary, English-speaking, and had physi-cian’s approval to participate. Exclusion criteria were very high resting blood pressure (systolic pressure > 160 and diastolic pressure > 100), very low or very high rest-ing heart rate (< 60 or > 100 beats per minute), or cogni-tive impairment. The selection process is depicted in
Fig. 1. Reach of the SHHC program was calculated as
the participation rate: number of enrolledSHHC partici-pants in each town divided by the total number of eli-gible women as determined U.S. Census data on the percentage of women age 40 and over and Behavioral Risk Factor Surveillance System data on the percentage of overweight/obese adults [67]. Average reach of the
SHHCprogram was 2.6% [67]. The study was approved
by the Cornell University and Bassett Healthcare Net-work Institutional Review Boards.
Intervention
TheSHHCintervention curriculum was developed based
on three evidence-based community programs, two of which target the individual level [51,68] and a third, the HEART Club, which uses an innovative civic engage-ment approach to catalyze positive social and built
en-vironment change [69]. Civic engagement has been
hypothesized to increase access to food resources even in rural food deserts [48]. SHHC participants met in groups by town twice per week for hourly sessions for 24 weeks (48 classes) and also attended monthly out-of-class HEART Club meetings. The intervention occurred
from September/October 2015 to March–May in 2016
in Montana and November/December 2015 to June/July 2016 in New York.
The diet component aimed to change dietary patterns
for alignment with DASH diet principles [70–73] and
considered by designing the program so that it could be conducted in community spaces (e.g. church basements, community meeting rooms) and by keeping equipment requirements modest (e.g. yoga mats, hand weights, DVDs).
The control program was designed to serve as a minimal-intervention attention control and was expected to improve knowledge with minimal behavioral impact. Participants in the control program met six times, once per month for an hour, during the six-month interven-tion period. In this program, a condensed version of
SHHC’s curriculum information was presented using a
didactic approach with no experiential activity or discus-sions about civic engagement. Participants did not en-gage in physical activity during the class sessions.
Measures
Participants completed a questionnaire that collected basic demographic information at baseline. Demographic
questions were derived from national surveys (e.g. U.S. Census). Participants were asked to complete seven diet-ary recalls during the four-week period just prior to the start of the intervention (“baseline”) and again in the four-week period immediately following the 24-week program (“post-intervention”). Participants were asked to wear accelerometers for seven days just prior to the start of the intervention (“baseline”) and again for seven days immediately following the conclusion of the pro-gram (“post-intervention”).
Dietary intake data were collected and analyzed using automated self-administered 24-h dietary recalls (ASA-24) [75]. Dietary data were included in analysis if at least two of the seven dietary recalls were completed at each time point to determine usual intakes of foods that are not expected to be episodic [76]. Healthy Eating Index (HEI)-2015 scores were calculated for each participant to determine alignment with the Dietary Guidelines for Americans [77]. Overall scores included 12 components:
total fruits; whole fruits; total vegetables; dark green and orange vegetables and legumes; total grains; whole grains; milk; meat and beans; oils; saturated fat; sodium; and energy from solid fats, alcohol, and added sugars. These scores were then summed to derive the HEI score, which can range from 0 to 100.
Our primary measurement of physical activity was ob-tained using the ActiGraph Model GT3XE accelerome-ters (ActiGraph LLC, Pensacola, FL). Participants were instructed to wear the device at the hip for seven days and only to remove it when sleeping, bathing, or swim-ming. Data were recorded at 30 Hz and analyzed using an epoch length of 60 s. Data were screened using current best practices [78], and non-wear time was iden-tified (and excluded) using a widely-used algorithm developed by Choi et al. [79]. Daily level data were ex-cluded if wear time was less than 10 h (600 min) in a day, and participant level data were only included if the participant had five or more valid days of wear (i.e. ≥3000 min across five days with≥600 min each), or four valid days of wear with at least 750 min per day. Because participants were essentially healthy and without disabil-ity, Freedson cut-points were used to determine minute-level intensity of physical activity [80]. Step counts were also determined. A categorical variable was created from the accelerometer data for both pre- and post-intervention: average moderate or vigorous physical ac-tivity (MVPA) minutes per day as measured by acceler-ometer was multiplied by 7 to give average minutes of MVPA per week. If average minutes of MVPA per week was greater than or equal to 150 min then the partici-pant is meeting the physical activity recommendations [25]. If average minutes of MVPA is less than 150 min per week then the participant is not meeting physical ac-tivity recommendations.
We used self-report as a secondary measure of phys-ical activity to help account for the limitations of accel-erometry, such as an inability to capture some types of activities (those involving use of the upper extremities, stationary activities, and swimming), and an inability to distinguish the purpose of the physical activity (work, leisure, transportation) [81]. Self-report measures com-plement objective measures by accounting for these limitations, although they have their own limitations such as recall bias and an inability to account for shorter durations or lower-intensity activities. The International Physical Activity Questionnaire Short Form (IPAQ-SF) was used pre- and post-intervention to collect self-report of physical activity [82–84]. Meta-bolic equivalent (MET) minutes per week were
com-piled according to the IPAQ’s Guidelines for Data
Processing and Analysis [85]. Self-report of sedentary time was obtained using the Sedentary Behavior Ques-tionnaire [86].
Statistical analysis
Descriptive statistics for the whole sample and by treat-ment groups were compiled and tabulated. Comparisons of continuous and categorical variables between the groups at baseline were done using t-tests and chi-square tests, respectively. Since the observations are clustered by town, we conducted multilevel linear regression models where town was treated as a random effect. For each diet and physical activity outcome, an unadjusted model was run with pre-post intervention change as the dependent variable, with treatment as a fixed effect and site as a ran-dom effect. Adjusted models, which additionally con-trolled for baseline values of the outcome, age, marital status, and education, were estimated. Missing data were handled using multiple imputation to minimize bias which could have resulted if complete case analysis were used. The imputation was conducted in SAS (PROC MI). Thirty datasets were imputed and SAS PROC MIANALYZE was then used to combine the model results from within each imputed data set into one summary output. We also used multilevel logistic regression to assess whether treatment was associated with meeting the MVPA recommendation (as measured by accelerometry). Generalized linear mixed effects model (PROC GLIMMIX in SAS) was used with site as a random effect, where meeting the tion at outcome was a 1 and not meeting a recommenda-tion at outcome was a 0; educarecommenda-tion, age, marital status, and baseline meeting of recommendation were included as covariates. All tests were two-sided. We adjusted for multiple testing using the Benjamini-Hochberg approach [87] to avoid risk of an inflated type I error based on the large number of significance tests. We applied the method to physical activity and dietary outcomes together and used a false positive rate of 20%. The adjustedp-value for significance based on correcting for both the number of within arm and between arm tests (37 outcomes with three statistical tests each for a total of 111 tests) is
p= .0468. Analyses were conducted using SAS version 9.4 (SAS Institute Inc., Cary, NC, USA).
Results
p= .03). There were no statistically significant differences between those who had complete pre-post accelerometry data and those who did not. There were no statistically significant differences in baseline dietary (Table 2) or physical activity (Table3) measures between the interven-tion and control groups (p≥.05 in all cases).
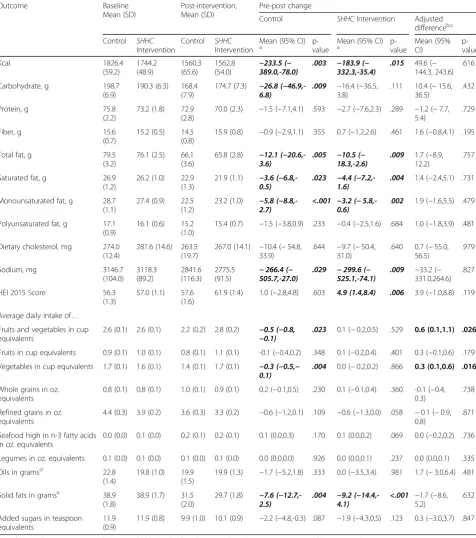
For both groups, on average, intakes of sodium, added sugars, fiber, and fruits and vegetables failed to meet rec-ommendations for cardiovascular health [88,89] at base-line (Table2). The average HEI diet quality score placed participants in both groups slightly below the U.S. na-tional average of 59 [90].
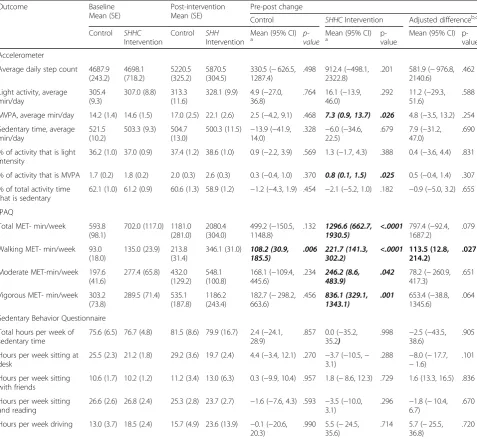
Both groups also fell short of the public health rec-ommendation for physical activity at baseline. While 150 min per week of at least moderate activity or 75 min per week of vigorous activity is recommended [91], participants obtained closer to 100 min per week of MVPA, with about half as moderate activity, based on daily averages (Table 3). Approximately 20% of partici-pants were meeting the recommendation and there
were no differences between arms at baseline (Table1). Average daily step counts were approximately half of the widely-promoted recommendation of 10,000 steps per day [92].
Compared to the control group, the intervention group realized statistically significant improvements in intake of fruit and vegetables combined (difference: 0.6
cup equivalents per day, 95% CI 0.1 to 1.1, p= .026)
and in vegetables alone (difference: 0.3 cup equivalents per day, 95% CI 0.1 to 0.6,p= .016) (Table2). For phys-ical activity, there were no statistphys-ically significant differ-ences between the intervention and control groups based on accelerometry, our primary measure of phys-ical activity (Table 3). By self-report, compared to the control group, the intervention group experienced a greater increase in walking MET-minutes per week (dif-ference: 113.5 MET-minutes per week, 95% CI 12.8 to 214.2,p= .027). No other statistically significant differ-ences in diet or physical activity outcomes between groups were observed.
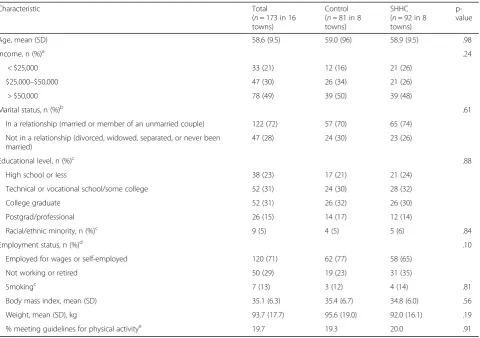
Table 1Baseline Characteristics of Participants by Intervention Condition
Characteristic Total
(n= 173 in 16 towns)
Control (n= 81 in 8 towns)
SHHC (n= 92 in 8 towns)
p-value
Age, mean (SD) 58.6 (9.5) 59.0 (96) 58.9 (9.5) .98
Income, n (%)a .24
< $25,000 33 (21) 12 (16) 21 (26)
$25,000–$50,000 47 (30) 26 (34) 21 (26)
> $50,000 78 (49) 39 (50) 39 (48)
Marital status, n (%)b .61
In a relationship (married or member of an unmarried couple) 122 (72) 57 (70) 65 (74)
Not in a relationship (divorced, widowed, separated, or never been married)
47 (28) 24 (30) 23 (26)
Educational level, n (%)c .88
High school or less 38 (23) 17 (21) 21 (24)
Technical or vocational school/some college 52 (31) 24 (30) 28 (32)
College graduate 52 (31) 26 (32) 26 (30)
Postgrad/professional 26 (15) 14 (17) 12 (14)
Racial/ethnic minority, n (%)c 9 (5) 4 (5) 5 (6) .84
Employment status, n (%)d .10
Employed for wages or self-employed 120 (71) 62 (77) 58 (65)
Not working or retired 50 (29) 19 (23) 31 (35)
Smokingc 7 (13) 3 (12) 4 (14) .81
Body mass index, mean (SD) 35.1 (6.3) 35.4 (6.7) 34.8 (6.0) .56
Weight, mean (SD), kg 93.7 (17.7) 95.6 (19.0) 92.0 (16.1) .19
% meeting guidelines for physical activitye 19.7 19.3 20.0 .91
a
Totaln= 158 (15 missing) b
Totaln= 169 (4 missing) c
Totaln= 168 (5 missing) d
Totaln= 170 (3 missing) e
Table 2Dietary Outcomes at Baseline and Post-Intervention by Treatment Group
Outcome Baseline
Mean (SD)
Post-intervention, Mean (SD)
Pre-post change
Control SHHCIntervention Adjusted differenceb,c
Control SHHC Intervention
Control SHHC Intervention
Mean (95% CI)
a p-value Mean (95% CI)a p-value Mean (95%CI) p-value
Kcal 1826.4
(59.2)
1744.2 (48.9)
1560.3 (65.6)
1562.8
(54.0) −233.5 (−389.0,-78.0) .003 −183.9 (−332.3,-35.4) .015 49.6 (− 144.3, 243.6)
.616
Carbohydrate, g 198.7
(6.9)
190.3 (6.3) 168.4 (7.9)
174.7 (7.3) −26.8
(−46.9,-6.8) .009 −3.8)16.4 (−36.5,
.111 10.4 (−15.6, 36.5)
.432
Protein, g 75.8
(2.2)
73.2 (1.8) 72.9 (2.8)
70.0 (2.3) −1.5 (−7.1,4.1) .593 −2.7 (−7.6,2.3) .289 −1.2 (−7.7, 5.4)
.729
Fiber, g 15.6
(0.7)
15.2 (0.5) 14.5 (0.8)
15.9 (0.8) −0.9 (−2.9,1.1) .355 0.7 (−1.2,2.6) .461 1.6 (−0.8,4.1) .195
Total fat, g 79.5
(3.2)
76.1 (2.5) 66.1 (3.6)
65.8 (2.8) −12.1
(−20.6,-3.6) .005 −10.5 (−18.3,-2.6) .009 1.7 (12.2)−8.9, .757
Saturated fat, g 26.9 (1.2)
26.2 (1.0) 22.9 (1.3)
21.9 (1.1) −3.6
(−6.8,-0.5) .023 −4.4 (−7.2,-1.6) .004 1.4 (−2.4,5.1) .731
Monounsaturated fat, g 28.7 (1.1)
27.4 (0.9) 22.5 (1.2)
23.2 (1.0) −5.8
(−8.8,-2.7) <.001 −3.2 (−0.6) 5.8,- .002 1.9 (−1.6,5.5) .479
Polyunsaturated fat, g 17.1 (0.9)
16.1 (0.6) 15.2 (1.0)
15.4 (0.7) −1.5 (−3.8,0.9) .233 −0.4 (−2.5,1.6) .684 1.0 (−1.8,3.9) .481
Dietary cholesterol, mg 274.0 (12.4)
281.6 (14.6) 263.5 (19.7)
267.0 (14.1) −10.4 (−54.8, 33.9)
.644 −9.7 (−50.4, 31.0)
.640 0.7 (−55.0, 56.5)
.979
Sodium, mg 3146.7
(104.0)
3118.3 (89.2)
2841.6 (116.3)
2775.5
(91.5) −505.7,-27.0)266.4 (− .029 −525.1,-74.1)299.6 (− .009 − 33.2 (− 331.0,264.6)
.827
HEI 2015 Score 56.3
(1.3)
57.0 (1.1) 57.6 (1.6)
61.9 (1.4) 1.0 (−2.8,4.8) .603 4.9 (1.4,8.4) .006 3.9 (−1.0,8.8) .119
Average daily intake of…
Fruits and vegetables in cup equivalents
2.6 (0.1) 2.6 (0.1) 2.2 (0.2) 2.8 (0.2) −0.5 (−0.8,
−0.1) .023 0.1 (−0.2,0.5) .529 0.6 (0.1,1.1) .026
Fruits in cup equivalents 0.9 (0.1) 1.0 (0.1) 0.8 (0.1) 1.1 (0.1) -0.1 (−0.4,0.2) .348 0.1 (−0.2,0.4) .401 0.3 (−0.1,0.6) .179
Vegetables in cup equivalents 1.7 (0.1) 1.6 (0.1) 1.4 (0.1) 1.7 (0.1) −0.3 (−0.5,−
0.1) .004 0.0 (−0.2,0.2) .866 0.3 (0.1,0.6) .016
Whole grains in oz. equivalents
0.8 (0.1) 0.8 (0.1) 1.0 (0.1) 0.9 (0.1) 0.2 (−0.1,0.5) .230 0.1 (−0.1,0.4) .360 -0.1 (−0.4, 0.3)
.738
Refined grains in oz. equivalents
4.4 (0.3) 3.9 (0.2) 3.6 (0.3) 3.3 (0.2) −0.6 (−1.2,0.1) .109 −0.6 (−1.3,0.0) .058 −0.1 (−0.9, 0.8)
.871
Seafood high in n-3 fatty acids in oz. equivalents
0.0 (0.0) 0.1 (0.0) 0.2 (0.1) 0.2 (0.1) 0.1 (0.0,0.3) .170 0.1 (0.0,0.2) .069 0.0 (−0.2,0.2) .736
Legumes in oz. equivalents 0.1 (0.0) 0.1 (0.0) 0.1 (0.0) 0.1 (0.0) 0.0 (0.0,0.0) .926 0.0 (0.0,0.1) .237 0.0 (0.0,0.1) .335
Oils in gramsd 22.8
(1.4)
19.8 (1.0) 19.9 (1.5)
19.9 (1.3) −1.7 (−5.2,1.8) .333 0.0 (−3.5,3.4) .981 1.7 (−3.0,6.4) .481
Solid fats in gramse 38.9 (1.8)
38.9 (1.7) 31.5 (2.0)
29.7 (1.8) −7.6
(−12.7,-2.5) .004 −9.2 (−14.4,-4.1) <.001 −5.2)1.7 (−8.6, .632
Added sugars in teaspoon equivalents
11.9 (0.9)
11.9 (0.8) 9.9 (1.0) 10.1 (0.9) −2.2 (−4.8,-0.3) .087 −1.9 (−4.3,0.5) .123 0.3 (−3.0,3.7) .847
a
Significant within-group pre-post changes are bolded and italicized (correctedp-value using Benjamini-Hochberg approach is .0468) b
Significant between-group differences are bolded (correctedp-value using Benjamini-Hochberg approach is .0468) c
Adjusted for town, education, age, marital status, and baseline value of the outcome d
Fats naturally present in nuts, seeds, seafood; unhydrogenated vegetable oils, except palm oil, palm kernel oil, coconut oils; fat in avocado and olives above allowable amount; 50% of fat present in stick/tub margarines, margarine spreads (grams)
e
Discussion
This study helps elucidate behavioral outcomes ofStrong
Hearts, Healthy Communities, one of the first multi-level community-based CVD prevention interventions for rural women. Baseline data from this study confirm the need for interventions to improve behaviors to reduce risk of cardiovascular disease in this population of rural women. Intakes of salt and added sugars were both ap-proximately double AHA recommendations, and partici-pants consumed less fruit, vegetables, and fiber than recommendations. Average minutes of at least moderate physical activity per week were below the recommended 150; at baseline only approximately one-fifth of study
participants were meeting these recommendations as measured by accelerometer.
Results suggest minimal between-group behavioral changes in this study. For dietary outcomes, the between-group changes were statistically significant for both fruits and vegetables combined and vegetables alone. These changes reflect a statistically significant within-group decrease in the control group rather than
an increase in the SHHC group. For physical activity
outcomes, no between-group differences by accelerome-try were statistically significant, however there was a sta-tistically significant between-group change in walking MET-minutes per week by self-report. In the primary Table 3Physical Activity Outcomes at Baseline and Post-Intervention by Treatment Group
Outcome Baseline
Mean (SE)
Post-intervention Mean (SE)
Pre-post change
Control SHHCIntervention Adjusted differenceb,c Control SHHC
Intervention
Control SHH Intervention
Mean (95% CI)
a p-value Mean (95% CI)a p-value
Mean (95% CI) p-value
Accelerometer
Average daily step count 4687.9 (243.2) 4698.1 (718.2) 5220.5 (325.2) 5870.5 (304.5)
330.5 (−626.5, 1287.4)
.498 912.4 (−498.1, 2322.8)
.201 581.9 (−976.8, 2140.6)
.462
Light activity, average min/day
305.4 (9.3)
307.0 (8.8) 313.3 (11.6)
328.1 (9.9) 4.9 (−27.0, 36.8)
.764 16.1 (−13.9, 46.0)
.292 11.2 (−29.3, 51.6)
.588
MVPA, average min/day 14.2 (1.4) 14.6 (1.5) 17.0 (2.5) 22.1 (2.6) 2.5 (−4.2, 9.1) .468 7.3 (0.9, 13.7) .026 4.8 (−3.5, 13.2) .254
Sedentary time, average min/day
521.5 (10.2)
503.3 (9.3) 504.7 (13.0)
500.3 (11.5) −13.9 (−41.9, 14.0)
.328 −6.0 (−34.6, 22.5)
.679 7.9 (−31.2, 47.0)
.690
% of activity that is light intensity
36.2 (1.0) 37.0 (0.9) 37.4 (1.2) 38.6 (1.0) 0.9 (−2.2, 3.9) .569 1.3 (−1.7, 4.3) .388 0.4 (−3.6, 4.4) .831
% of activity that is MVPA 1.7 (0.2) 1.8 (0.2) 2.0 (0.3) 2.6 (0.3) 0.3 (−0.4, 1.0) .370 0.8 (0.1, 1.5) .025 0.5 (−0.4, 1.4) .307
% of total activity time that is sedentary
62.1 (1.0) 61.2 (0.9) 60.6 (1.3) 58.9 (1.2) −1.2 (−4.3, 1.9) .454 −2.1 (−5.2, 1.0) .182 −0.9 (−5.0, 3.2) .655
IPAQ
Total MET- min/week 593.8 (98.1)
702.0 (117.0) 1181.0 (281.0)
2080.4 (304.0)
499.2 (−150.5, 1148.8)
.132 1296.6 (662.7,
1930.5) <.0001 797.4 (1687.2)−92.4, .079
Walking MET- min/week 93.0 (18.0)
135.0 (23.9) 213.8 (31.4)
346.1 (31.0) 108.2 (30.9,
185.5) .006 221.7 (141.3,302.2) <.0001 113.5 (12.8,214.2) .027
Moderate MET-min/week 197.6 (41.6)
277.4 (65.8) 432.0 (129.2)
548.1 (100.8)
168.1 (−109.4, 445.6)
.234 246.2 (8.6,
483.9) .042 78.2 (417.3)−260.9, .651
Vigorous MET- min/week 303.2 (73.8)
289.5 (71.4) 535.1 (187.8)
1186.2 (243.4)
182.7 (−298.2, 663.6)
.456 836.1 (329.1,
1343.1) .001 653.4 (1345.6)−38.8, .064
Sedentary Behavior Questionnaire
Total hours per week of sedentary time
75.6 (6.5) 76.7 (4.8) 81.5 (8.6) 79.9 (16.7) 2.4 (−24.1, 28.9)
.857 0.0 (−35.2, 35.2)
.998 −2.5 (−43.5, 38.6)
.905
Hours per week sitting at desk
25.5 (2.3) 21.2 (1.8) 29.2 (3.6) 19.7 (2.4) 4.4 (−3.4, 12.1) .270 −3.7 (−10.5,− 3.1)
.288 −8.0 (−17.7, −1.6)
.101
Hours per week sitting with friends
10.6 (1.7) 10.2 (1.2) 11.2 (3.4) 13.0 (6.3) 0.3 (−9.9, 10.4) .957 1.8 (−8.6, 12.3) .729 1.6 (13.3, 16.5) .836
Hours per week sitting and reading
26.6 (2.6) 26.8 (2.4) 25.3 (2.8) 23.7 (2.7) −1.6 (−7.6, 4.3) .593 −3.5 (−10.0, 3.1)
.296 −1.8 (−10.4, 6.7)
.670
Hours per week driving 13.0 (3.7) 18.5 (2.4) 15.7 (4.9) 23.6 (13.9) −0.1 (−20.6, 20.3)
.990 5.5 (−24.5, 35.6)
.714 5.7 (−25.5, 36.8)
.720
a
Significant within-group pre-post changes are bolded and italicized (corrected p-value using Benjamini-Hochberg approach is .0468) b
Significant between-group differences are bolded (corrected p-value using Benjamini-Hochberg approach is .0468) c
trial report, there were statistically significant between-group differences in weight and body mass index and improvement in C-reactive protein [62]. The behavioral data do not correspond well to those findings.
A possible explanation for the discrepancy is that between-group comparisons were diluted by improve-ments in the control group for several dietary outcomes, including total calories, as revealed by statistically signifi-cant within-group results. The minimal-intervention at-tention control program was designed to provide basic information across a total of six contact hours and im-plemented based upon community partner preferences and feasibility (versus no program or a delayed program delivery for controls). Both program curricula provided information about CVD rates among women, risk fac-tors, and the basics of a heart-healthy lifestyle including healthy eating and physical activity information. Core educational elements that were common across both programs, particularly around diet, show promise for ef-fectively changing behavior.
For physical activity outcomes, although
non-significant, between-group differences favoredSHHC. It is possible that there was insufficient power to detect changes in these secondary outcomes and therefore an increased probability of a Type II error. For example, per our data for average MVPA, there was an effect size of 0.73 with a standard deviation of 6.4. We therefore would have needed a sample size of 510 individuals to
achieve 80% power at a p-value of .05 and accounting
for clustering with an intra-class correlation coefficient of .025. The possibility of a Type II error accounting for the discrepancy between the primary trial report findings and the behavioral outcomes presented here is further supported by findings from this trial indicating that the between-group change in weight was largely accounted for by a change in aerobic fitness, as mea-sured by a step test [93].
Although not our primary measure of physical activity, there were between-group differences in walking
MET-minutes per week by self-report. While both the SHHC
and control curricula provided general information about the benefits of physical activity, the SHHC pro-gram included the use of walking DVDs in class and em-phasized alternative options for out-of-class walking, such as community recreational centers. It is also pos-sible that engagement in HEART Club activities contrib-uted to increased walking. In one study, volunteering, a form of civic engagement, led to increased walking among older women [94].
It is important to consider whether issues with
imple-mentation of SHHC could help explain the minimal
between-group behavioral results. Although sites were randomized, there could be other factors that influence results that were not accounted for due to the number
of sites. However, process evaluation data do not sup-port this possibility. Program leaders had high levels of adherence to theSHHCcurriculum (fidelity greater than 80%), with exception of only one of the eight interven-tion sites (68.9%) [67]. The dose delivered and class ef-fectiveness ratings were also high at all sites except one [67]. Strong implementation of the control curriculum (average 90% with high levels across all sites, unpub-lished data) likely contributed to the favorable within-group dietary changes observed in the control within-group that may help explain the lack of between-group changes in many of these outcomes.
This study adds to the small body of evidence on behav-ioral interventions designed specifically for rural women.
Heart Smart for Women [54] included behavioral strat-egies that were similar toSHHC; however it was not de-signed as a multilevel intervention. In that study, there were modest pre-post changes in several outcomes, in-cluding fruit consumption and moderate intensity physical activity. A perceived lack of resources, including sources of healthy food, gyms, and safe walking paths, was re-ported in focus groups conducted with women from the
counties where Heart Smart for Women was conducted.
In a study conducted in rural counties in upstate New
York and Virginia that, like SHHC, used a
social-ecological model, participating women attended a single community-visioning meeting that resulted in a request for community-level changes that were then implemented
by a community organization [53]. Community-level
changes were modest, however. For example, in New York, physical activity resources were listed on a website. Favorable pre-post changes in fruit and vegetable intake were realized, although these were greater in a group that also included visits by registered nurses to focus on individual-level changes. In this study, HEART Club suc-cesses included organizing county-wide health fairs and a restaurant healthy food labeling initiative [62].
Taken together, our results and those of prior studies suggest that while it is possible to achieve good imple-mentation of interventions in the rural environment, at-tainment of robust behavioral outcomes remains a
challenge. The core educational elements from SHHC
related to diet and cardiovascular disease provide a basis on which future interventions can build. A multilevel ap-proach was acceptable to participants and they achieved some change in their communities, suggesting that this remains a promising approach. Future studies could continue to explore the value of components designed to enact social and environmental change to better con-tribute to individual-level behavior change.
the study population was predominantly white, it reflected the racial/ethnic composition of the rural com-munities in which the research was conducted. However because of this it is possible the results will not generalize to other populations. The 24-h dietary recall methodology, IPAQ-SF, and Sedentary Behavior Ques-tionnaire have all been validated [84,86, 95]. Neverthe-less, findings are limited by the self-reported nature of these data. Participants were aware of the timeframe during which they would complete the questionnaires and may have made changes in diet and physical activity based on this (reactivity). There were seasonal differ-ences in the pre and post timeframes that likely affected outcomes. For the majority of participants, the baseline period was in September/October, when produce is be-ing harvested and the weather is conducive to outdoor activities, including walking; and post measurements were conducted in March through May, when fresh pro-duce is much less available and the weather is less favor-able for outdoor physical activity. This timing may be responsible for the decreases in fruit and vegetable in-takes noted in the control group, and may suggest
suc-cess of the SHHC curriculum in providing women with
the behavioral strategies needed to maintain fruit and vegetable intakes despite the seasonal lack of availability.
Conclusions
Heart disease is an important issue to address in rural communities. There is a need for interventions that address the many barriers to achieving heart-healthy be-haviors, particularly because access to healthcare can be
extremely limited. The SHHC curriculum achieved
suc-cess in changing health outcomes [62], however these changes remain largely unexplained in terms of the ante-cedent diet and physical activity behaviors. Future studies should consider how to bolster behavioral outcomes, pos-sibly by including more and different strategies for affect-ing multilevel change.
Abbreviations
AHA:American Heart Association; ASA-24: automated self-administered 24-h dietary recall; CI: confidence interval; CVD: cardiovascular disease;
DASH: Dietary Approaches to Stop Hypertension; HEI: Healthy Eating Index; IPAQ-SF: International Physical Activity Questionnaire Short Form; MET: metabolic equivalents; MVPA: moderate or vigorous physical activity; SHHC: Strong Hearts, Healthy Communities; USA: United States of America
Acknowledgments
We are grateful for the contribution of the health educators in Montana and New York, Jan Feist, Kristin Pullyblank, and Judy Ward for their programmatic support, and our National Advisory Board members for their contributions to this study.
Authors’contributions
SCF led the writing of the manuscript and participated in study design and data analysis and interpretation. LP, MEN, and DS participated in study design and interpretation of study results. MG coordinated study
implementation, data collection, curriculum development, and data analysis. GDE participated in aspects of data collection and assisted with manuscript
preparation. MH and DW led analysis and interpretation of accelerometry data. RAS conceived of the study and oversaw all aspects of the study design, data analysis and interpretation, and manuscript development. All authors read and approved the final manuscript.
Funding
This study was supported by grant R01 HL120702 from the National Institutes of Health and the National Heart, Lung, and Blood Institute (NHLBI).
Role of the Funders/Sponsors:The funders/sponsors had no role in the design and conduct of the study; collection, management, analysis, and interpretation of the data; preparation, review, or approval of the manuscript; or decision to submit the manuscript for publication.
Availability of data and materials
The datasets used and analyzed in the current study are available on reasonable request.
Ethics approval and consent to participate
The study was approved by the Cornell University and Bassett Healthcare Institutional Review Boards. Informed consent was obtained from all study participants.
Consent for publication Not applicable.
Competing interests
The authors have no competing interests to declare.
Author details
1Friedman School of Nutrition, Tufts University, Boston, MA 02111, USA. 2
College of Education, Health and Human Development, Montana State University, Bozeman, MT 59717, USA.3Center for Rural Community Health, Bassett Research Institute, Cooperstown, NY 13326, USA.4Division of Nutritional Sciences, Cornell University, Ithaca, NY 14853, USA.5Texas A&M AgriLife Research, College Station, TX 77843, USA.6Exercise and Physical Activity Resource Center, University of California, La Jolla, San Diego, CA 92093-0811, USA.7Department of Nutrition and Food Science College of Agriculture and Life Sciences, Texas A&M University, College Station, Texas, TX 77843, USA.
Received: 20 September 2018 Accepted: 30 September 2019
References
1. Murphy SL, Xu J, Kochanek KD, Curtin SC, Arias E. Deaths: final data for 2015. Natl Vital Stat Rep. 2017;66(6):1–75.
2. Benjamin EJ, Virani SS, Callaway CW, Chamberlain AM, Chang AR, Cheng S, et al. Heart disease and stroke Statistics-2018 update: a report from the American Heart Association. Circulation. 2018;137(12):e67–e492. 3. Moy E, Garcia MC, Bastian B, Rossen LM, Ingram DD, Faul M, et al. Leading
causes of death in nonmetropolitan and metropolitan areas- United States, 1999-2014. MMWR Surveill Summ. 2017;66(1):1–8.
4. Bennett K, Lopes J, Spencer K, van Hecke S. Rural Women's health: National Rural Health Association Policy Brief: National Rural Health Association; 2013. 5. Lloyd-Jones D, Hong Y, Labarthe D, Mozaffarian D, Appel L, Van Horn L, et al.
Defining and setting national goals for cardiovascular health promotion and disease reduction: The American Heart Association's strategic impact goal through 2020 and beyond. Circulation. 2010;121:586–613.
6. Yu E, Rimm E, Qi L, Rexrode K, Albert CM, Sun Q, et al. Diet, lifestyle, biomarkers, genetic factors, and risk of cardiovascular disease in the Nurses' health studies. Am J Public Health. 2016;106(9):1616–23.
7. Alissa EM, Ferns GA. Dietary fruits and vegetables and cardiovascular diseases risk. Crit Rev Food Sci Nutr. 2017;57(9):1950–62.
8. Hartley L, Igbinedion E, Holmes J, Flowers N, Thorogood M, Clarke A, et al. Increased consumption of fruit and vegetables for the primary prevention of cardiovascular diseases. Cochrane Database Syst Rev. 2013;6:CD009874. 9. Wang X, Ouyang Y, Liu J, Zhu M, Zhao G, Bao W, et al. Fruit and vegetable
10. Aune D, Keum N, Giovannucci E, Fadnes LT, Boffetta P, Greenwood DC, et al. Whole grain consumption and risk of cardiovascular disease, cancer, and all cause and cause specific mortality: systematic review and dose-response meta-analysis of prospective studies. BMJ. 2016;353:i2716. 11. Flight I, Clifton P. Cereal grains and legumes in the prevention of coronary
heart disease and stroke: a review of the literature. Eur J Clin Nutr. 2006; 60(10):1145–59.
12. Mellen PB, Walsh TF, Herrington DM. Whole grain intake and cardiovascular disease: a meta-analysis. Nutr Metab Cardiovasc Dis. 2008;18(4):283–90. 13. Bouchenak M, Lamri-Senhadji M. Nutritional quality of legumes, and
their role in cardiometabolic risk prevention: a review. J Med Food. 2013;16(3):185–98.
14. Galli C, Rise P. Fish consumption, omega 3 fatty acids and cardiovascular disease. The science and the clinical trials. Nutr Health. 2009;20(1):11–20. 15. Souza RG, Gomes AC, Naves MM, Mota JF. Nuts and legume seeds for
cardiovascular risk reduction: scientific evidence and mechanisms of action. Nutr Rev. 2015;73(6):335–47.
16. Ros E, Hu FB. Consumption of plant seeds and cardiovascular health: epidemiological and clinical trial evidence. Circulation. 2013;128(5):553–65. 17. Hu FB. Plant-based foods and prevention of cardiovascular disease: an
overview. Am J Clin Nutr. 2003;78(3 Suppl):544S–51S.
18. Michas G, Micha R, Zampelas A. Dietary fats and cardiovascular disease: putting together the pieces of a complicated puzzle. Atherosclerosis. 2014; 234(2):320–8.
19. Salehi-Abargouei A, Maghsoudi Z, Shirani F, Azadbakht L. Effects of dietary approaches to stop hypertension (DASH)-style diet on fatal or nonfatal cardiovascular diseases--incidence: a systematic review and meta-analysis on observational prospective studies. Nutrition. 2013;29(4):611–8. 20. Siervo M, Lara J, Chowdhury S, Ashor A, Oggioni C, Mathers JC. Effects of the
dietary approach to stop hypertension (DASH) diet on cardiovascular risk factors: a systematic review and meta-analysis. Br J Nutr. 2015;113(1):1–15. 21. Rees K, Hartley L, Flowers N, Clarke A, Hooper L, Thorogood M, et al.
'Mediterranean' dietary pattern for the primary prevention of cardiovascular disease. Cochrane Database Syst Rev. 2013;8:CD009825.
22. Martinez-Gonzalez MA, Bes-Rastrollo M. Dietary patterns, Mediterranean diet, and cardiovascular disease. Curr Opin Lipidol. 2014;25(1):20–6.
23. Rehm CD, Penalvo JL, Afshin A, Mozaffarian D. Dietary intake among US adults, 1999-2012. JAMA. 2016;315(23):2542–53.
24. Lutfiyya MN, Chang LF, Lipsky MS. A cross-sectional study of US rural adults' consumption of fruits and vegetables: do they consume at least five servings daily? BMC Public Health. 2012;12:280.
25. Physical Activity Guidelines Advisory Committee. Physical activity guidelines advisory committee report, 2008. Washington, DC: U.S. Department of Health and Human Services; 2008.
26. Drenowatz C, Sui X, Fritz S, Lavie CJ, Beattie PF, Church TS, et al. The association between resistance exercise and cardiovascular disease risk in women. J Sci Med Sport. 2015;18(6):632–6.
27. Endorsed by The Obesity Society, Young DR, Hivert MF, Alhassan S, Camhi SM, Ferguson JF, et al. Sedentary behavior and cardiovascular morbidity and mortality: a science advisory from the American Heart Association. Circulation. 2016;134(13):e262–79.
28. Fan JX, Wen M, Kowaleski-Jones L. Rural-urban differences in objective and subjective measures of physical activity: findings from the National Health and nutrition examination survey (NHANES) 2003-2006. Prev Chronic Dis. 2014;11:E141.
29. Connell CL, Yadrick MK, Simpson P, Gossett J, McGee BB, Bogle ML. Food supply adequacy in the lower Mississippi Delta. J Nutr Educ Behav. 2007; 39(2):77–83.
30. Liese AD, Weis KE, Pluto D, Smith E, Lawson A. Food store types, availability, and cost of foods in a rural environment. J Am Diet Assoc. 2007;107(11):1916–23. 31. Morton L, Blanchard T. Starved for Access: Life in Rural American's Food
Desserts. Rural Realities 2007;1(4):https://www.iatp.org/sites/default/files/25 8_2_98043.pdf.
32. Larson N, Story M, Nelson M. Neighborhood environments: disparities in access to healthy foods in the U.S. Am J Prev Med. 2009;36:74–81. 33. Sharkey JR, Johnson CM, Dean WR. Food access and perceptions of the
community and household food environment as correlates of fruit and vegetable intake among rural seniors. BMC Geriatr. 2010;10:32. 34. Dean WR, Sharkey JR. Rural and urban differences in the associations
between characteristics of the community food environment and fruit and vegetable intake. J Nutr Educ Behav. 2011;43(6):426–33.
35. Jilcott SB, Moore JB, Wall-Bassett ED, Liu H, Saelens BE. Association between travel times and food procurement practices among female supplemental nutrition assistance program participants in eastern North Carolina. J Nutr Educ Behav. 2011;43(5):385–9.
36. Lenardson JD, Hansen AY, Hartley D. Rural and remote food environments and Obesity. Curr Obes Rep. 2015;4(1):46–53.
37. Edwards M, Jilcott S, Moore J, Floyd MF. County level dispartities in access to recreational resources and associations with adult obesity in North Carolina. J Park Recreat Admin. 2011;29(2):39–54.
38. Rivera RL, Dunne J, Maulding MK, Wang Q, Savaiano DA, Nickols-Richardson SM, et al. Exploring the association of urban or rural county status and environmental, nutrition- and lifestyle-related resources with the efficacy of SNAP-Ed (supplemental nutrition assistance program-education) to improve food security. Public Health Nutr. 2018;21(5):957–66.
39. Lo BK, Morgan EH, Folta SC, Graham ML, Paul LC, Nelson ME, et al. Environmental influences on physical activity among rural adults in Montana, United States: views from built environment audits, resident focus groups, and key informant interviews. Int J Environ Res Public Health. 2017:14(10). 40. Robinson JC, Carson TL, Johnson ER, Hardy CM, Shikany JM, Green E,
et al. Assessing environmental support for better health: active living opportunity audits in rural communities in the southern United States. Prev Med. 2014;66:28–33.
41. United States Department of Agriculture, Economic Research Service. Rural American At A Glance: 2017 Edition: United States Department of Agriculture; 2017.
42. Parks SE, Housemann RA, Brownson RC. Differential correlates of physical activity in urban and rural adults of various socioeconomic backgrounds in the United States. J Epidemiol Community Health. 2003; 57(1):29–35.
43. Olsen J. An integrative review of literature on the determinants of physical activity among rural women. Public Health Nurs. 2013;30(4):288–311. 44. Krummel D, Humphries D, Tessaro I. Focus groups on cardiovascular health in
rural women: implications for practice. J Nutr Educ Behav. 2002;34(1):38–46. 45. Tessaro I, Rye S, Parker L, Trangsrud K, Mangone C, McCrone S, et al. Cookin'
up health: developing a nutrition intervention for a rural Appalachian population. Health Promot Pract. 2006;7(2):252–7.
46. Sriram U, Morgan EH, Graham ML, Folta SC, Seguin RA. Support and sabotage: a qualitative study of social influences on health behaviors among rural adults. J Rural Health. 2018;34(1):88–97.
47. Folta S, Goldberg J, Lichtenstein A, Seguin R, Reed P, Nelson M. Factors related to cardiovascular risk reduction in midlife and older women: a qualitative study. Prev Chronic Dis 2008;5(1):http://www.cdc.gov/pcd/ issues/2008/jan/06_0156.htm.
48. Smith C, Morton LW. Rural food deserts: low-income perspectives on food access in Minnesota and Iowa. J Nutr Educ Behav. 2009;41(3):176–87. 49. Wilcox S, Castro C, King AC, Housemann R, Brownson RC. Determinants of
leisure time physical activity in rural compared with urban older and ethnically diverse women in the United States. J Epidemiol Community Health. 2000;54(9):667–72.
50. Seguin R, Connor L, Nelson M, LaCroix A, Eldridge G. Understanding barriers and facilitators to healthy eating and active living in rural communities. J Nutr Metab. 2014;2014:146502.
51. Folta S, Lichtenstein A, Seguin R, Goldberg J, Nelson M. The StrongWomen –healthy hearts program: reducing cardiovascular disease risk factors in rural sedentary, overweight, and obese midlife and older women. Am J Public Health. 2009;99(7):1271–7.
52. Campbell MK, Tessaro I, DeVellis B, Benedict S, Kelsey K, Belton L, et al. Effects of a tailored health promotion program for female blue-collar workers: health works for women. Prev Med. 2002;34(3):313–23. 53. Fahs P, Pribulick M, Canty Williams I, James G, Rovynak V, Seibold-Simpson
S. Promoting heart health in rural women. J Rural Health. 2013;29(3):248–57. 54. Khare MM, Koch A, Zimmermann K, Moehring PA, Geller SE. Heart smart for
women: a community-based lifestyle change intervention to reduce cardiovascular risk in rural women. J Rural Health. 2014;30(4):359–68. 55. Perry C, Rosenfeld A, Bennett J, Potempa K. Heart-to-heart: promoting
walking in rural women through motivational interviewing and group support. J Cardiovasc Nurs. 2007;22(4):304–12.
57. Sallis J, Cervero R, Ascher W, Henderson K, Kraft M, Kerr J. An ecological approach to creating active living communities. Annu Rev Public Health. 2006;27:297–322.
58. Story M, Kaphingst KM, Robinson-O'Brien R, Glanz K. Creating healthy food and eating environments: policy and environmental approaches. Annu Rev Public Health. 2008;29:253–72.
59. Glanz K, Rimer B, Viswanath K. Health behavior: theory, research, and practice. San Francisco: Jossey-Bass; 2015.
60. Bandura A. Social foundations of thought and action: a social cognitive theory. Prentice Hall: Englewood Cliffs, NJ; 1986.
61. Kelder S, Hoelscher D, Perry C. How individuals, environments, and health behaviors interact: social cognitive theory. In: Glanz K, Rimer B, Viswanath K, editors. Health behavior: theory, research, and practice. 5th ed. San Francisco: Jossey-Bass; 2015.
62. Seguin RA, Paul L, Folta SC, Nelson ME, Strogatz D, Graham ML, et al. Strong hearts, healthy communities: a community-based randomized trial for rural women. Obesity (Silver Spring). 2018;26(5):845–53.
63. Seguin RA, Eldridge G, Graham ML, Folta SC, Nelson ME, Strogatz D. Strong hearts, healthy communities: a rural community-based cardiovascular disease prevention program. BMC Public Health. 2016;16(1):86.
64. United States Department of Agriculture, Economic Research Service. Rural-Urban Continuum Codes. https://www.ers.usda.gov/data-products/rural-urban-continuum-codes/. Accessed 15 June 2019.
65. U.S. Health Resources and Services Administration. Find Shortage Areas: HPSA & MUA/P by Address. https://www.healthdata.gov/dataset/find-shortage-areas-hpsa-muap-address. Accessed 15 June 2019.
66. United States Department of Agriculture, National Institute of Food and Agriculture.https://nifa.usda.gov/extension. Access 15 June 2019. 67. Sriram U, Sandreuter K, Graham M, Folta S, Pullyblank K, Paul L, et al.
Process evaluation of strong hearts, healthy communities: a rural community-based cardiovascular disease prevention program. J Nutr Educ Behav. 2019;51(2):138–49.
68. Seguin R, Heidkamp-Young E, Kuder J, Nelson M. Improved physical fitness among older female participants in a nationally disseminated, community-based exercise program. Health Educ Behav. 2012;39(2):183–90. 69. Seguin R, Heidkamp-Young E, Juno B, Knott A, Fenton M, Folta S, et al. A
community-based participatory Reseach pilot initiative to catalyze Postive change in local food and physical activity environments. Austin, TX: International Society for Behavioral Nutrition and Physical Activity Annual Meeting; 2012.
70. Appel L, Moore T, Obarzanek E, Vollmer W, Svetkey L, Sacks F, et al. A clinical trial of the effects of dietary patterns on blood pressure. N Engl J Med. 1997;336(16):1117–24.
71. Obarzanek E, Sacks FM, Vollmer WM, Bray GA, Miller ER 3rd, Lin PH, et al. Effects on blood lipids of a blood pressure-lowering diet: the dietary approaches to stop hypertension (DASH) trial. Am J Clin Nutr. 2001;74(1):80–9.
72. Sacks FM, Svetkey LP, Vollmer WM, Appel LJ, Bray GA, Harsha D, et al. Effects on blood pressure of reduced dietary sodium and the dietary approaches to stop hypertension (DASH) diet. DASH-sodium collaborative research group. N Engl J Med. 2001;344(1):3–10.
73. Fung TT, Chiuve SE, McCullough ML, Rexrode KM, Logroscino G, Hu FB. Adherence to a DASH-style diet and risk of coronary heart disease and stroke in women. Arch Intern Med. 2008;168(7):713–20.
74. U.S. Department of Agriculture and U.S. Department of Health and Human Services. Dietary Guidelines for Americans. Washington. DC: U.S. Government Printing Office; 2010. p. 2010.
75. Kirkpatrick SI, Subar AF, Douglass D, Zimmerman TP, Thompson FE, Kahle LL, et al. Performance of the automated self-administered 24-hour recall relative to a measure of true intakes and to an interviewer-administered 24-h recall. Am J Clin Nutr. 2014;100(1):233–40.
76. National Institutes of Health, National Cancer Institute. Dietary Assessment Primer.https://dietassessmentprimer.cancer.gov/. Access 15 June 2019. 77. Guenther PM, Kirkpatrick SI, Reedy J, Krebs-Smith SM, Buckman DW, Dodd
KW, et al. The healthy eating Index-2010 is a valid and reliable measure of diet quality according to the 2010 dietary guidelines for Americans. J Nutr. 2014;144(3):399–407.
78. Matthews CE, Hagstromer M, Pober DM, Bowles HR. Best practices for using physical activity monitors in population-based research. Med Sci Sports Exerc. 2012;44(1 Suppl 1):S68–76.
79. Choi L, Ward SC, Schnelle JF, Buchowski MS. Assessment of wear/nonwear time classification algorithms for triaxial accelerometer. Med Sci Sports Exerc. 2012;44(10):2009–16.
80. Freedson PS, Melanson E, Sirard J. Calibration of the computer science and applications. Inc accelerometer Med Sci Sports Exerc. 1998;30(5):777–81. 81. Prince SA, Adamo KB, Hamel ME, Hardt J, Connor Gorber S, Tremblay M. A
comparison of direct versus self-report measures for assessing physical activity in adults: a systematic review. Int J Behav Nutr Phys Act. 2008;5:56. 82. Sallis J, Haskell W, Wood P, Fortmann S, Rogers T, Blaire S, et al. Physical
activity assessment methodology in the Five-City project. Am J Epidemiology. 1985;121(1):91–106.
83. Blair S, Haskell W, Ho P, Paffenbarger R, Vranizan K, Farquhar J, et al. Assessment of habitual physical activity by a seven day recall in a community survey and controlled experiments. Am J Epidemiology. 1985; 122(5):794–804.
84. Craig C, Marshall A, Sjostrom M, Bauman A, Booth M, Ainsworth B, et al. International physical activity questionnaire: 12-country reliability and validity. Med Sci Sports Exerc. 2003;35(8):1381–95.
85. International Physical Activity Questionnaire. Guidelines for Data Processing and Analysis of the International Physical Activity Questionnaire (IPAQ).
http://www.ipaq.ki.se. .
86. Rosenberg D, Norman G, Wagner N, Patrick K, Calfas K, Sallis J. Reliability and validity of the sedentary behavior questionnaire (SBQ) for adults. J Phys Act Health. 2010;7(6):697–705.
87. Glickman ME, Rao SR, Schultz MR. False discovery rate control is a recommended alternative to Bonferroni-type adjustments in health studies. J Clin Epidemiol. 2014;67(8):850–7.
88. Whelton PK, Appel LJ, Sacco RL, Anderson CA, Antman EM, Campbell N, et al. Sodium, blood pressure, and cardiovascular disease: further evidence supporting the American Heart Association sodium reduction
recommendations. Circulation. 2012;126(24):2880–9.
89. Johnson RK, Appel LJ, Brands M, Howard BV, Lefevre M, Lustig RH, et al. Dietary sugars intake and cardiovascular health: a scientific statement from the American Heart Association. Circulation. 2009;120(11):1011–20. 90. United States Department of Agriculture Center for Nutrition Policy and
Promotion. HEI Scores for Americans. https://www.fns.usda.gov/hei-scores-americans. Accessed 15 June 2019.
91. U.S. Department of Health and Human Services. 2008 Physical Activity Guidelines for Americans. Washington, DC; 2008.
92. Wattanapisit A, Thanamee S. Evidence behind 10,000 steps walking. J Health Res. 2017;31(3):241–8.
93. Pullyblank K, Strogatz D, Folta SC, Paul L, Nelson ME, Graham M, et al. Effects of the Strong Hearts, Healthy Communities intervention on functional fitness of rural women. J Rural Health 2019.
94. Varma VR, Tan EJ, Gross AL, Harris G, Romani W, Fried LP, et al. Effect of community volunteering on physical activity: a randomized controlled trial. Am J Prev Med. 2016;50(1):106–10.
95. Thompson F, Subar A. Dietary assessment methodology. In: Coulston A, Boushey C, editors. Nutrition in the. Prevention and Treatment of Disease: Academic Press; 2008.
Publisher’s Note