R E S E A R C H
Open Access
miR-524-5p of the primate-specific C19MC
miRNA cluster targets TP53IPN1- and
EMT-associated genes to regulate cellular
reprogramming
Phan Nguyen Nhi Nguyen
1,2, Kong Bung Choo
1,2*, Chiu-Jung Huang
4,5, Shigeki Sugii
6,7, Soon Keng Cheong
1,3and Tunku Kamarul
8,9Abstract
Background:Introduction of the transcription factors Oct4, Sox2, Klf4, and c-Myc (OSKM) is able to‘reprogram’ somatic cells to become induced pluripotent stem cells (iPSCs). Several microRNAs (miRNAs) are known to enhance reprogramming efficiency when co-expressed with the OSKM factors. The primate-specific chromosome 19 miRNA cluster (C19MC) is essential in primate reproduction, development, and differentiation. miR-524-5p, a C19MC member, is highly homologous to the reprogramming miR-520d-5p; we also reported that miR-524-5p was expressed in iPSCs but not mesenchymal stem cells (MSCs). This study aimed to elucidate possible contributions of miR-524-5p to the reprogramming process.
Methods:A miR-524-5p precursor was introduced into human fibroblast HFF-1 in the presence of OSKM, and the
relative number of embryonic stem cell (ESC)-like colonies that stained positively with alkaline phosphatase (AP) and Nanog were quantified to determine reprogramming efficiency. A miR-524-5p mimic was transfected to MSCs to investigate the effects of miR-524-5p on TP53INP1, ZEB2, and SMAD4 expression by real-time polymerase chain reaction (PCR) and Western blot. Direct gene targeting was confirmed by luciferase activity. A phylogenetic tree of TP53INP1 was constructed by the Clustal method. Contribution of miR-524-5p to cell proliferation and apoptosis was examined by cell counts, BrdU, MTT, and cell death assays, and pluripotency gene expression by real-time PCR.
Results:Co-expressing the miR-524 precursor with OSKM resulted in a two-fold significant increase in the number of AP- and Nanog-positive ESC-like colonies, indicating a role for miR-524-5p in reprogramming. The putative target, TP53INP1, showed an inverse expression relationship with miR-524-5p; direct TP53INP1 targeting was confirmed in luciferase assays. miR-524-5p-induced TP53INP1 downregulation enhanced cell proliferation, suppressed apoptosis, and upregulated the expression of pluripotency genes, all of which are critical early events of the reprogramming process. Interestingly, the TP53INP1 gene may have co-evolved late with the primate-specific miR-524-5p. miR-524-5p also promoted mesenchymal-to-epithelial transition (MET), a required initial event of reprogramming, by directly targeting the epithelial-to-mesenchymal transition (EMT)-related genes, ZEB2 and SMAD4.
(Continued on next page)
* Correspondence:[email protected]
1Centre for Stem Cell Research, Universiti Tunku Abdul Rahman, Sungai
Long, Kajang, Selangor DE, Malaysia
2Department of Preclinical Sciences, Faculty of Medicine and Health Sciences,
Universiti Tunku Abdul Rahman, Sungai Long Campus, Bandar Sungai Long, Cheras, 43000 Kajang, Selangor DE, Malaysia
Full list of author information is available at the end of the article
(Continued from previous page)
Conclusions:Via targeting TP53INP1, ZEB2, and SMAD4, miR-524-5p contributes to the early stage of inducing
pluripotency by promoting cell proliferation, inhibiting apoptosis, upregulating expression of pluripotency genes, and enhancing MET. Other C19MC miRNAs may have similar reprogramming functions.
Keywords:C19MC, miR-524-5p, Reprogramming efficiency, Cell proliferation, Apoptosis, Pluripotency genes, MET,
TP53INP1, ZEB2, SMAD4
Background
Differentiated somatic cells can be reprogrammed into a pluripotent state by forced expression of a defined set of transcription factors, typically Oct4, Sox2, Klf4, and c-Myc (OSKM), to become induced pluripotent stem cells (iPSCs) [1]. The reprogramming process is thought to involve three phases (initiation, maturation, and stabilization), each of which is driven by a cascade of ex-pression changes in specific sets of genes to give rise to fully or partially reprogrammed cells [2, 3]. Some im-portant features of the early stage of reprogramming in-clude increased proliferation, inhibition of apoptosis, acquisition of epithelial characteristics, and upregulation or activation of pluripotency-related genes [3]. Due to low reprogramming efficiencies, elucidating the molecu-lar events that regulate each step of the reprogramming process has been challenging [4].
MicroRNAs (miRNAs), the negative regulators of gene expression, are often physically clustered on the human genome to permit co-regulation [5]. A number of chro-mosomally clustered miRNAs has been found to be spe-cifically upregulated in pluripotent stem cells compared to mature differentiated cell types [5–7]. These include the miR-302/367, miR-17/92, and miR-200 clusters, and the chromosome 19 miRNA cluster (C19MC). The miR-302/ 367 cluster miRNAs are able to generate iPSCs [8, 9]. Al-ternatively, when co-expressed with the OSKM factors, members of the miR-302/367, miR-17/92, and miR-200 clusters are able to enhance reprogramming efficiency [10–12]. Some of these pluripotency-associated miRNAs have been shown to modulate somatic cell reprogram-ming at the early stages by inhibiting target genes in the cell cycle, mesenchymal-to-epithelial transition (MET), and the apoptosis pathways [5]. miRNA-302/367 pro-motes proliferation and accelerates G1 to S transition of the cell cycle by the targeting the Rb family and CDK1NA [13], whereas the miR-17/92 cluster enhances reprogram-ming efficiency by downregulating PTEN, a renowned tumor suppressor [11]. Moreover, both miR-302/367 and miR-200 clusters increase the kinetics of MET during reprogramming through blocking the epithelial-to-mesenchymal transition (EMT)-related genes TGFβR2 and ZEB1/ZEB2 [12, 14]. Despite a recent report on the involvement of miR-520d-5p (a member of the C19MC) in reprogramming [15], it is unclear if other
C19MC miRNAs also contribute to inducing and regu-lating pluripotency.
C19MC, one of the largest miRNA gene clusters in the human genome, contains 46 highly homologous miRNA genes within a ~ 100-kb genomic region [16]. Importantly, C19MC is primate-specific and is pre-dicted to play critical roles in primate reproduction, de-velopment, and differentiation [17], as reflected in restrictive expression of C19MC in only reproductive tissues and in pluripotent embryonic stem cells (ESCs) [7, 17, 18]. Our previous study has reported en-bloc
C19MC activation in pluripotent stem cells but expres-sion of only selective C19MC miRNAs in multipotent mesenchymal stem cells (MSCs) and a unipotent cell line [7]. Selective C19MC miRNA activation in cancer cells was also reported [19, 20] which showed similar expression patterns as in MSCs [7]. Bioinformatics ana-lysis has further predicted that C19MC miRNAs may play a role in maintaining stem cell self-renewal and pluripotency by regulating the G1 to S transition phase of the cell cycle and the apoptosis pathway [7].
We report here that miR-524-5p, a C19MC member, was able to enhance OSKM-driven somatic reprogram-ming probably by promoting MET via targeting the EMT-associated genes ZEB2 and SMAD4. TP53INP1 was also identified as a miR-524-5p target that mediated enhanced cell proliferation and suppressed apoptosis, both of which are relevant to the early stage of repro-gramming, establishing the contribution of a C19MC miRNA as an enhancer for cellular reprogramming.
Methods
Cell culture and maintenance of iPSCs
humidified incubator. Human colon cancer HCT-15 and placental cell line HS799.PI were purchased from ATCC (Manassas, VA, USA), and the mouse embryonic fibro-blast (MEF) cell line was purchased from EMD Millipore (Temecula, CA, USA). HCT-15, HS799.PI, and MEF were maintained in DMEM containing 10% FBS with 1% gluta-max (Gibco). The foreskin fibroblast cell line, HFF-1 (ATCC), was maintained in DMEM containing 15% FBS with 1% glutamax (Gibco). 293FT cells (Invitrogen) were maintained in DMEM supplemented with 10% FBS, 0.1 mM MEM nonessential amino acids (NEAA), 6 mM
L-glutamine, 1 mM MEM sodium pyruvate, and 500 μg/ ml geneticin. ASC-IPSC and MH#1 were iPSC cell lines established from ASC-Inv and ASC Lonza, respectively, in our laboratory (S. Sugii, unpublished data). iPSC cells were maintained in DMEM/F12 containing 20% knockout serum replacement (KOSR; Invitrogen), 1% glutamax, 1× NEAA, 0.1% β-mercaptoenthanol, and 10 ng/ml basic fibroblast growth factor (bFGF; ReproCELL, Tokyo, Japan). The breast cancer cell line MCF-7 was kindly pro-vided by Professor Y.M. Lim (Cancer Research Center, Universiti Tunku Abdul Rahman) and was maintained in RPMI medium (Gibco) with 10% FBS.
Reprogramming of HFF-1 to iPSCs
The lentiviral vectors expressing Oct4, Sox2, KLF4, and c-MYC (Addgene, #20726, #20724, #20725, and #20723, respectively) and the inducible vector FUW-m2rtTA (Addgene, #20342) were prepared as previously described [22]. The HFF-1 cells were seeded in six-well plates and transduced with individual lentiviruses carrying human m2rtTA, OCT4, SOX2, KLF4, or C-MYC, with or without the miR-524 precursor (System Biosciences, Mountain View, CA, USA). On day 5 after transduction, 25,000 cells/well of a 12-well plate were transferred in triplicate wells onto MEF feeder cells. On the next day, the culture medium was switched from HFF-1 growth medium to hu-man iPSC growth medium containing 2 μg/ml doxycyc-line (Dox). Typically, human ESC-like colonies started to appear around day 7. The ESC-like colonies were stained with alkaline phosphatase (AP) live stain (Life Technolo-gies, Eugene, OR, USA) on day 14, and the Nanog live stain SmartFlare™(EMD Millipore, Temecula, CA, USA) on day 18. Images of colonies with ESC-like morphology that were also staining positively with AP were obtained on day 14 using a fluorescence microscope (Carl Zeiss, USA); images of Nanog-positive colonies were similarly obtained on day 18. In comparing the AP and Nanog im-ages, only the ESC-like and AP and Nanog double-positive colonies were counted. Reprogramming efficiency was calculated as the fraction of the number of ESC-like/ AP+Nanog+colonies formed over the total number of in-put cells in triplicate wells and in three independent experiments.
miRNA and mRNA expression analysis
Total RNA was isolated from the cell lines by using the MiRNeasy Mini Kit (Qiagen, Valencia, CA, USA) accord-ing to the manufacturer’s instructions. For miR-524-5p quantification using the TaqMan microRNA assay (Ap-plied Biosystems, Foster City, CA, USA), first-strand cDNA synthesis was carried out using a TaqMan Micro-RNA Reverse Transcription kit (Applied Biosystems) and miR-524-5p-specific primer (Cat. no. 4427975, Applied Biosystems) according to the manufacturer’s protocol. Real-time polymerase chain reaction (PCR) was carried out with TaqMan Universal PCR Master Mix (Applied Biosystems) and TaqMan MicroRNA Assay Mix on a ther-mal cycler (Rotor-Gene Q, Qiagen). For gene expression at the mRNA level, first-strand cDNA was generated using the SuperScript III (Invitrogen) according to the manu-facturer's instructions. The SYBR Select Master Mix kit (Applied Biosystems) was used for real-time PCR quantifi-cation, and the real-time reaction was carried out in a Rotor-Gene Q. RNU6B and GAPDH were used as the normalization controls for miRNA and mRNA assays, re-spectively. The primers for mRNA quantification are listed in Additional file 1: Table S1. The expression of miRNAs and mRNAs was calculated based on theΔΔCTmethod.
All experiments were preformed in triplicate, and three or more independent experiments were performed to obtain the results presented.
Determination of absolute copy number of mature miRNAs
The copy number of miR-524-5p was determined as pre-viously described [7]. In brief, a synthetic mature miR-524-5p oligonucleotide (Integrated DNA Technologies IDT, Coralville, IA, USA) was serially diluted 10-fold to final concentrations between 200 nM and 0.02 pM. The serially diluted synthetic miRNA aliquots were reverse-transcribed and subjected to real-time PCR analysis concurrently with the sample RNAs. Serially diluted standard-curve samples were included on each plate of the miRNA TaqMan assays to convert the cycle threshold (Ct) values of each sample into the corresponding number
of miRNA copies in each cell, assuming that each cell con-tained 15 pg total RNA, as previously described [23]. Ct
values≥35 indicated expression levels too low for accurate analysis, and were considered as an undetectable expres-sion level. The cut-off threshold of miRNA expresexpres-sion was, therefore, standardized at Ct< 35.
Transient transfection
a mixture of four SMART selection-designed small inter-fering RNAs (siRNAs) targeting the human TP53INP1 gene was used. For transfection of the colorectal cancer cell line HCT-15, the cells were seeded onto six-well plates at a density of 2.5 × 10⁵cells/well and were transi-ently transfected using Lipofectamine™ 2000 Reagent (Invitrogen) according to the manufacture’s protocol. For WJ0706 transfection, the cells were seeded at a density of 9.5 × 10⁴cells/well in a six-well plate, and transfection was performed using Lipofectamine™ RNAiMAX Reagent (Invitrogen). The cells were harvested for analysis 48 h post-transfection.
Protein extraction and Western blotting
Total protein lysates were prepared using the RIPA lysis buffer (Nacalai Tesque, Kyoto, Japan). Proteins at 50 μg per lane were separated by 8% sodium dodecyl sulfate-polyacrylamide gel electrophoresis and transferred to a nitrocellulose membrane (Amersham ECL, Freiburg, Germany). The membrane was then blotted with poly-clonal antibodies against TP53INP1 (1:1000, ab9777, Abcam, Cambridge, UK), SMAD4 (1:500, ab137861, Abcam), β-actin (1:1000, ab8227, Abcam), or monoclo-nal antibody ZEB2 (1:500, sc-271984, Santa Cruz, CA, USA), followed by horseradish peroxidase-conjugated secondary antibodies. Visualization was achieved using chemiluminescence (GE Healthcare Life Sciences, Pis-cataway, NJ, USA).
Phylogeny tree analysis
Phylogenetic tree alignment of the 3’-untranslated region (UTR) of the TP53INP1 transcript sequences in different species was generated by the Clustal method using the DNAstar software (Madison, WI, USA).
Luciferase assays
PCR products of fragments covering the predicted miR-524-5p binding sites in the 3’-UTR of the TP53INP1, ZEB2, and SMAD4 transcripts were cloned at the 3’-end of firefly luciferase gene in the dual reporter vector pmirGLO (GenBank accession FJ376737; Promega, Madison, WI, USA) at the SacI and XbaI restriction sites. Mutations of the miRNA seed sequences were per-formed using the QuikChange® Lightning Site-Directed Mutagenesis kit (Agilent Technologies, Santa Clara, CA, USA) as recommended by the supplier. The mutations were confirmed by sequencing. Sequences of the PCR primers used are shown in Additional file 2: Table S2. Co-transfection into HCT-15 cells was performed by using Lipofectamine™2000 (Invitrogen) according to the manufacture’s protocol. A validated miR-524-5p mimic, or mimic negative control (NC; Ambion), was used in co-transfection with the luciferase wild-type or mutant constructs. Luciferase assays were performed 48 h
post-transfection using the Dual-Luciferase Reporter 1000 Assay kit (Promega). Transfection experiments were per-formed in two or more independent experiments with quadruple transfections each.
Cell proliferation assays
WJ0706 cells were transfected with miRNA mimic miR-524-5p, miRNA NC, or TP53INP1 siRNA (siTP53INP1). After 48 h incubation, cells were seeded in six-well plates at a density of 1 × 10⁴ cells/well. After 2, 4, and 6 days post-transfection, the cells were trypsinized and stained with trypan blue (Gibco Invitrogen). The num-ber of viable and dead cells was counted using a Neu-bauer counting chamber. For 5-bromo-2’-deoxyuridine (BrdU) measurements, 48 h post-transfection, cells were seeded in 96-well plates at a density of 5000 cells/well for 24 h. Cell proliferation was measured using the BrdU cell proliferation assay kit (Cell Signaling Technology, Denver, MA, USA) according to the manufacturer’s instructions. BrdU incorporation was monitored at 450 nm. Data presented are from three independent ex-periments, and the results of the treated cells were nor-malized with the untreated control cells.
MTT assays for cell viability
MTT (3-(4,5-dimethylthiazol-2-yl)-2,5-diphenyltetrazo-lium bromide; Sigma Chemical Co., St. Louis, MO, USA) was used to quantify cell survival from H2O2
-in-duced oxidative stress. Briefly, after 48 h hours post-transfection with miRNA or NC mimic or siTP53INP1, the transfected WJ-MSC cells were treated with 200μM H2O2 for 2 h. Subsequently, the cells were trypsinized
and seeded in 96-well plates at a density of 5000 cells/ well and cultured for 24 to 96 h, followed by the addition of 10 μl 5 mg/ml MTT to each well and incu-bation for 2.5 h. The reaction was stopped by adding 100 μl dimethyl sulfoxide. Absorbance at 570 nm was determined using a plate reader.
Histone/DNA ELISA for detection of apoptosis
The Cell Death Detection enzyme-linked immunosorb-ent assay (ELISA) plus kit (Roche Diagnostics, Penzberg, Germany) was employed to quantitatively detect histone-associated DNA fragments in mono- and oligonucleo-somes according to the manufacturer’s protocol. Briefly, after 48 h post-transfection, cells were trypsinized and seeded in 96-well plates at a density of 5000 cells/well and cultured for 24 h. The cells were treated with 200 μM H2O2 for 6 h. After treatment, the cytoplasmic histone/
development with ABTS substrate for peroxidase. The spectrophotometric absorbance of the samples was deter-mined at 405 nm.
Prediction of miRNA target genes
The 3’-UTR sequences of putative target genes were re-trieved from the UCSC genome browser (http://geno-me.ucsc.edu). miRNA:mRNA interactions were predicted using TargetScan, miRanda, and DIANA-microT. Func-tions of the target genes were elucidated through the Kyoto Encyclopedia of Genes and Genomes (KEGG) pathway.
Statistical analysis
Data were analyzed by paired Student’sttest (two-tailed distribution) comparing the differences of expression levels between treatment and nontreatment cells. Statis-tical significance was accepted atp< 0.05.
Results
miRNA-524-5p enhances reprogramming
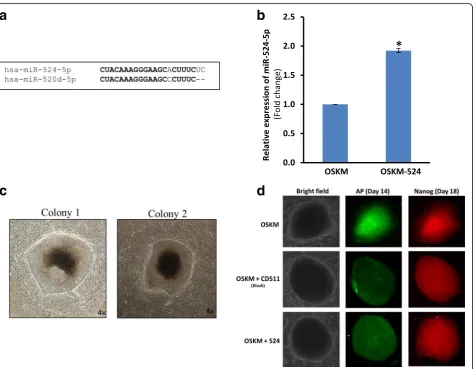
We previously showed in miRNA microarray and miRNA copy number analyses that miR-524-5p was expressed abundantly in pluripotent stem cells, including ESCs and iPSCs, whereas miR-524-5p expression was undetected or detected at low levels in the MSC cell lines from which the iPSCs were derived [7]. Further-more, 524-5p shares 19/20 nucleotides with miR-520d-5p (Fig. 1a), suggesting identical biological func-tions for both miRNAs. Recent studies have indicated the ability of miR-520d-5p for converting cancer cells into iPSC-like cells [15, 24]. Hence, we hypothesized that miR-524-5p may also play an important role in repro-gramming in iPSCs.
To test if miR-524-5p also enhances reprogramming in the presence of other known reprogramming factors,
the lentiviral vector-based pCDH-mir-524 construct en-coding the mir-524 precursor was used to determine the effect of miR-524-5p on iPSC induction in human fibro-blast HFF-1 cells (Fig. 1b–d). HFF-1 cells were trans-duced with pCDH-mir-524 together with the Dox-inducible lentiviral vectors each carrying the human cDNAs encoding one of the four transcription factors OCT4, SOX2, c-MYC, and KLF4 (OSKM), and a consti-tutively active lentivirus transducing the reverse tetracyc-line transactivator FUW-m2rtTA (see Methods). The blank vector pCDH-CD511 was also included as a trans-duction control. In the OSKM/mir-524 co-transtrans-duction, and in the ESC-like colonies formed (see below), the miR-524-5p level was determined to be double that of the endogenous miR-524-5p levels of ~ 11.9 × 10⁴ cop-ies/cell (data not shown) found in colonies of the OSKM-transduced cells (Fig. 1b). After transduction, the cells were cultured under standard conditions for human iPSC induction but in the presence of Dox, and the transduced cells were monitored daily for morphological changes. ESC-like colonies began to form on day 7 which, when passaged on day 30 and cultured under Dox-free conditions, showed clear and round borders (Fig. 1c). Furthermore, these colonies showed AP stain-ing on day 14 and Nanog at day 18 culturstain-ing under Dox-dependent medium (Fig. 1d). Colonies that dis-played ESC-like morphology and that were both AP-and Nanog-positive were considered bona fide iPSC colonies (Fig. 1c and d). In each of the three independ-ent experimindepend-ents, the total number of ESC-like and AP
+
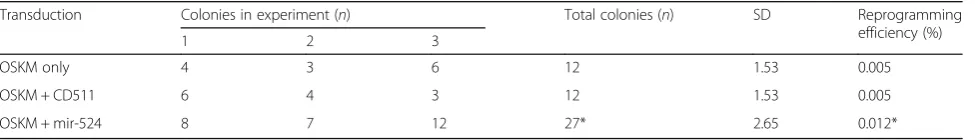
Nanog+ colonies observed varied between three to six in the triplicate wells of the 12-well plate transduced with OSKM alone, or OSKM with the blank vector CD511, and from seven to twelve colonies on OSKM/ mir-524 transduction (Table 1). Taken together, OSKM/ mir–524 co-transduction generated a total of 27 ESC-like/AP+Nanog+ colonies in the three independent trans-duction experiments, with a calculated reprogramming ef-ficiency of 0.012%, and was 2.25-fold that of OSKM or OSKM/CD511 transduction, which was within the range of reprogramming efficiencies reported by others [25, 26]. The data thus support the notion that miR-524 enhanced OKSM-induced reprogramming of HFF-1 fibroblast cells.
Bioinformatics analysis of miRNA-524-5p and predicted target mRNA interactions
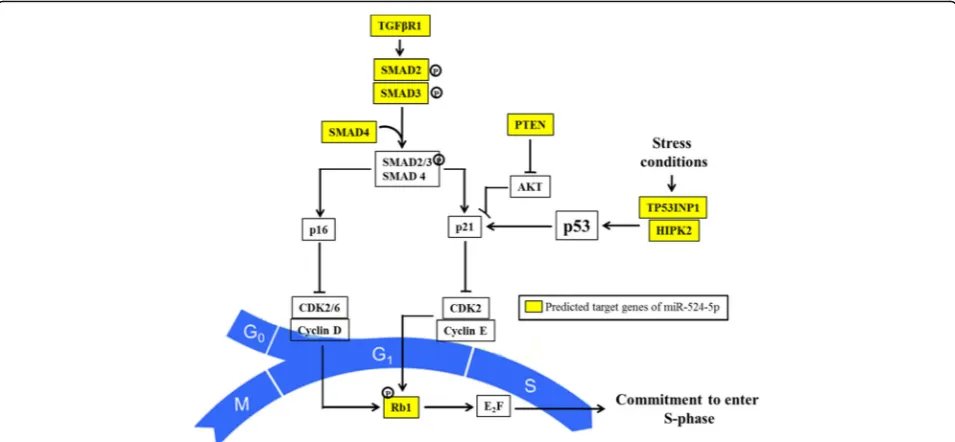
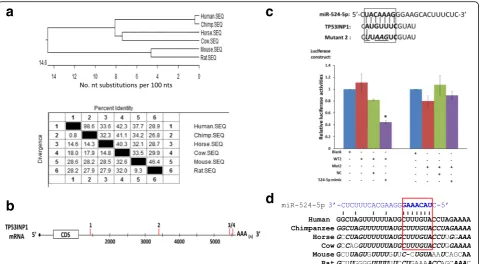
In our previous work, we have described the bioinfor-matics analysis of C19MC miRNAs, including the most significantly enriched gene ontology terms associated with biological process and molecular functions and the KEGG pathways [7]. In the same study, our data showed that C19MC could play an important role in regulating stemness. Since cell cycle, more critically the G1-to-S transition phase, is an important feature of the regu-lation of stem cell self-renewal [13, 27] we focused in this work on determining possible functions of miR-524-5p in relation to the G1-S phase of the cell cycle. Based on the earlier bioinformatics analysis [7], eight predicted G1-to-S transition-related genes, namely TGFβR1, Smad2/3/4, Rb1, PTEN, HIPK2, and TP53INP1, were identified to be targeted by miR-524-5p (Fig. 2).
Repression of the PI3K/PKB/Akt/mTOR and TGFβ pathways, such as PTEN, p21/CDK1NA, TGFβR1, and SMAD2/3/4, has been reported to promote self-renewal and proliferation by blocking the G1 to S transition boundary of the cell cycle [13, 28–30]. Furthermore, p53, a pro-apoptotic, antiproliferative, and antioxidant regulator, is indirectly regulated by miR-524-5p through targeting TP53INP1 and HIPK2 (Fig. 2). Suppression of HIPK2 could inhibit p53 expression [31] whereas TP53INP1 is a major mediator of p53-driven responses to oxidative stress [32]. Besides p53, miR-524-5p was also predicted to target a member of the Rb family, RB1, an event that regulates the cell cycle by enhancing G1 to S transition and proliferation. TP53INP1 plays im-portant roles not only in reprogramming by regulating p53 [33, 34] but also in cancer stem cells in which TP53INP1 deficiency results in increased self-renewal and acquisition of cancer stem cell phenotype [35, 36]. Thus, the possible correlation between miR-524-5p and TP53INP1 was further investigated.
TP53INP1 is a direct target of miR-524-5p
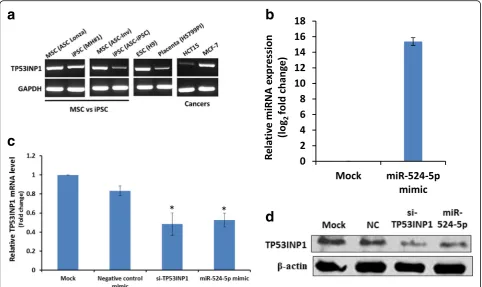
To investigate the relationship between miR-524-5p and TP53INP1, endogenous TP53INP1 expression in MSC and iPSC lines was first established by RT-PCR (Fig. 3a). TP53INP1 was found to be expressed in both MSCs and
Table 1Number of ESC-like and AP+Nanog+colonies obtained on OSKM/mir-524 co-transduction of HFF-1 cells
Transduction Colonies in experiment (n) Total colonies (n) SD Reprogramming
efficiency (%)
1 2 3
OSKM only 4 3 6 12 1.53 0.005
OSKM + CD511 6 4 3 12 1.53 0.005
OSKM + mir-524 8 7 12 27* 2.65 0.012*
ESC-like and AP+
Nanog+
colonies in triplicate wells in a 12-well plate were counted under a microscope as described in Methods. Reprogramming efficiency was calculated as the total number of AP+
Nanog+
iPSCs, albeit at higher levels in MSCs than in the de-rived iPSCs. Interestingly, our previous study has shown that miR-524-5p was abundantly expressed in iPSCs whereas miR-524-5p expression was undetected or de-tected at very low levels in MSC cell lines [7], suggesting an inverse correlation between the expression of miR-524-5p and TP53INP1 and negative regulation of TP53INP1 by miR-524-5p. ESCs and placenta, which comprehensively express all the C19MC miRNAs and, therefore, miR-524-5p [7], also expressed TP53INP1, and in higher levels in ESCs. Surprisingly, the two cancer cell line controls, the colorectal HCT-15 and the breast cancer MCF-7, also expressed TP53INP1 to different levels (Fig. 3a). Notably, all these cell lines, except for the placenta HS799.PI cells, also expressed various levels of miR-524-5p [7], but correlation could not be made between the TP53INP1 and miR-524-5p expression levels. The observation of the lack of inverse correlation between miR-524-5p and TP53INP1 in some cell lines suggests that, besides regulation by miR-524-5p, other factors are involved in regulating TP53INP1 expression, particularly in cancer cells (see Discussion).
When HCT-15 cells were transfected with a miR-524-5p mimic to achieve a ~ 16-fold upregulation of the miR-524-5p level 48 h post-transfection (Fig. 3b), the TP53INP1 mRNA and protein levels were assayed in qRT-PCR and Western blots (Fig. 3c and d). As con-trols, a miRNA negative transfection control (NC) and a siRNA to knockdown TP53INP1 expression were also included. Similar to siRNA-mediated TP53INP1 suppres-sion, forced overexpression of miR-524-5p significantly
downregulated TP53INP1 at both the mRNA and protein levels compared with the mock control (Fig. 3c and d), further confirming a reverse relationship between miR-524-5p and TP53INP1 expression. The data further sug-gested that miR-524-5p regulated TP53INP1 expression probably via downregulation of the TP53INP1 transcript.
Interestingly, when the TP53INP1 transcript sequences of various species were compared, TP53INP1 sequences of the primate (human and chimpanzee) showed a tight clustering with a high sequence homology of 98.6% and late evolutionary emergence in comparison with other mammalian orthologs (Fig. 4a). Keeping in mind that miR-524-5p belongs to the primate-specific C19MC cluster, the observation may hint at primate-specific co-evolution of the miR-524-5p and TP53INP1 gene se-quences. The long 4521-bp 3’-UTR of the TP53INP1 transcript (NM_033285) encompasses four putative miR-524-5p-targeted sites, each with a six- to seven-nucleotide seed sequence alignment with the TP53INP1 sequence at nucleotide (nt) positions 1461–1466, nt 3397–3403, nt 5450–5455, and nt 5530–5536 of the transcript (Fig. 4b). Target sites 1, 3, and 4 did not show appreciable downregulation of luciferase activities in lu-ciferase assays using the pmirGLO vector (data not shown). On the other hand, luciferase construct of target site 2, designated as WT2, when co-transfected with the miR-524-5p mimic resulted in a reduction to ~ 40% of luciferase activity relative to that in the control cells transfected with the blank vector (Fig. 4c). Specific tar-geting was confirmed with transfection of the mutated target site 2 in the Mut2 construct, which did not show
appreciable effects on luciferase activities (Fig. 4c). Echo-ing possible co-evolution of miR-524-5p and TP53INP1 suggested above, the active target site 2 also showed identical sequences between the two primate genes, but not with other mammalian orthologs (Fig. 4d). Taken to-gether, luciferase assays confirmed that miR-524-5p dir-ectly targets TP53INP1 to downregulate TP53INP1 expression, and that the miRNA and target gene may have co-evolved late in the evolution of the primate.
miR-524-5p regulates processes relevant to reprogramming
The cellular reprogramming process is a dynamic and tightly controlled process driven by cascades of cellular and molecular events. Two such events that occur at the early stages of reprogramming are accelerated prolifera-tion rates and suppression of apoptosis [3]. Since a Wharton’s Jelly MSC 0706 (WJ0706) cell line was used in subsequent experiments, the endogenous expression levels of both miR-524-5p and TP53INP1 in WJ0706 cells were first determined based on transcript copy
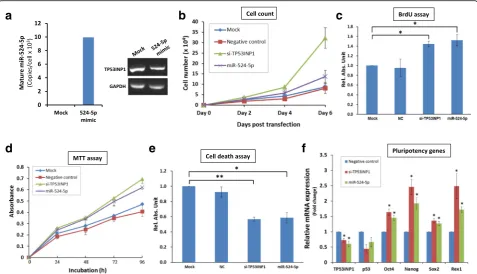
number and RT-PCR, respectively (Fig. 5a). The results indicated that miR-524-5p was undetectable in WJ0706 cells (Fig. 5a, left panel, the mock control), whereas the expression level was upregulated to about 10,000 copies/ cell 48 h post-transfection of the miR-524-5p mimic (Fig. 5a, left panel, 524-5p mimic). On the other hand, the endogenous TP53INP1 transcript level was high in WJ0706 (Fig. 5a, right panel, mock control); however, the TP53INP1 transcript level was reduced 48 h post-transfection of the miR-524-5p mimic (Fig. 5a, right panel), which also echoed the miR-524-5p-suppressed TP53INP1 transcript and protein levels in HCT-15 cells (Fig. 3c and d; see also Fig. 6b, left most panel below). Next, to examine whether miR-524-5p expression influ-ences the cell proliferation rate, WJ0706 cells were trans-fected with the miR-524-5p mimic and in vitro cell proliferation assays were performed. The data showed en-hanced cell proliferation rates 3 to 4 days post-transfection, correlating with results of the TP53INP1 knockdown (Fig. 5b). The miR-524-5p-transfected cells also showed ~ 50% significantly higher BrdU incorporation
b
d
a
c
compared to the mock control as in the experiment with TP53INP1 knockdown by siRNA transfection, which also significantly increased BrdU incorporation by 40% (Fig. 5c). Hence, miR-524-5p enhances cell proliferation which may partially be due to TP53INP1 downregulation.
Reprogramming is a stressful process that increases cellular levels of reactive oxygen species (ROS), resulting in the activation of apoptosis [37]. To analyze the effects of miR-524-5p on cell viability in response to oxidative stress, miR-524-5p-transfected cells were exposed to 200μM H2O2for 2 h and the metabolic activities in the
treated cells were measured by MTT assay. The results indicated that transfection of the miR-524-5p mimic suppressed the damaging effects of H2O2-induced
oxi-dative stress on cell viability, and the protection was likely via TP53INP1 since TP53INP1 knockdown also resulted in similar protection effects (Fig. 5d). The ef-fects of miR-524-5p on oxidative stress-induced apop-tosis was further determined by ELISA quantification of the histone-associated DNA fragments in mono- and oligonucleosomes produced during nuclear DNA de-naturation of apoptotic cells (Fig. 5e). The result showed
~ 40% significant reduction of nucleosome production in the miR-524-5p- or siTP53INP1-transfected cells com-pared to the mock control, further indicative of miR-524-5p suppression of apoptosis via TP53INP1.
The transition from the initiation to the maturation phase of the reprogramming process is also highlighted by upregulation of pluripotency-associated genes, including Oct4, Nanog, Sox2, and Rex1 [2, 3], which were assayed in miR-524-5p mimic- and siTP53INP1-transfected cells (Fig. 5f). Overexpression of miR-524-5p downregulated TP53INP1 mRNA levels as anticipated, as did the transfec-tion of siTP53INP1. Furthermore, expression of the p53 gene, which acts downstream of TP53INP1 (Fig. 2), was concurrently downregulated, also as anticipated [32]. The data clearly showed that both overexpression of miR-524-5p and TP53INP1 knockdown upregulated the expression of all four pluripotency genes tested in the transfected cells (Fig. 5f). Hence, the results support that miR-524-5p nega-tively regulates TP53INP1, which in turn regulates p53, to upregulate expression of pluripotency genes. Taken to-gether, our results demonstrated involvement of miR-524-5p in events relevant to reprogramming, namely promotion
of cell proliferation, suppression of oxidant-induced apop-tosis, and upregulation of pluripotency-associated genes via targeting and downregulation of the TP53INP1 transcript in the p53 signaling pathway.
miR-524-5p promotes MET required for initiating reprogramming by downregulating EMT-related genes On reprogramming, besides promotion of cell prolifera-tion, suppression of oxidant-induced apoptosis, and up-regulation of pluripotency-associated genes, MET is also an essential initiation step for progression towards pluri-potency [3]. Our bioinformatics analysis revealed identical seed sequence and high degree of sequence homology be-tween miR-524-5p and miR-520d-5p (Fig. 1a). Import-antly, miR-520-5p has previously been reported to inhibit expression of the EMT-related gene TWIST1 [38]. Hence, we hypothesized that miR-524-5p may also enhance MET by targeting the EMT-associated genes that were pre-dicted to be targeted by miR-524-5p. To test this hypoth-esis, a miR-524-5p mimic was first transiently transfected
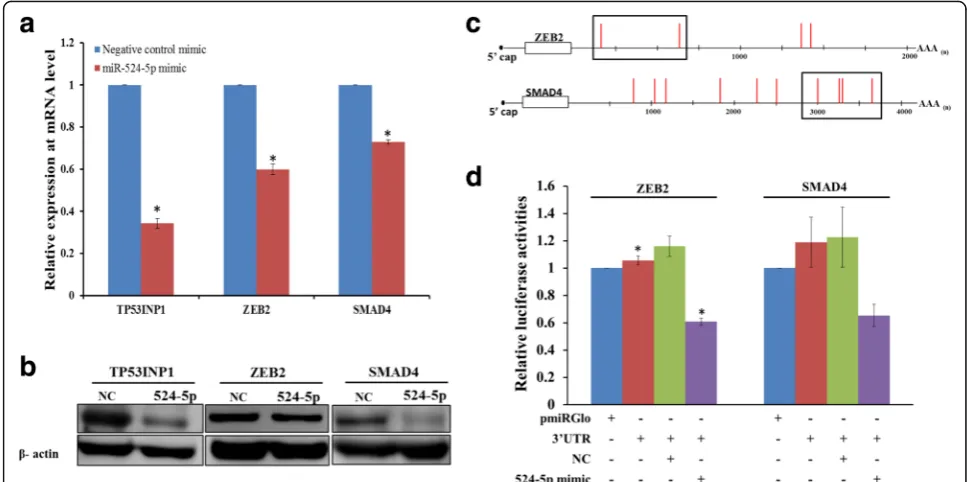
into WJ0706 cells, which do not express miR-524-5p, and the mimic transfection resulted in an increase of the miR-524-5p to ~ 10,000 copies/cell 48 h post-transfection (see above and Fig. 5a, left panel). It was also noted that the transfected miR-524-5p expression level in WJ0706 was lower than that in HCT-15 (Fig. 3b), suggesting different efficiencies in transient miRNA transfection of cancer and stem cells. Nevertheless, the upregulated miR-524-5p level in WJ0706 was sufficient to downregulate the expression of its target genes including TP53INP1, ZEB2, and SMAD4 (Fig. 6a).
The expression of the predicted EMT-related target genes, including TGFβR1, SMAD2, SMAD3, SMAD4, ZEB1, ZEB2, and TWIST1, was determined by RT-PCR, which showed that only ZEB2 and SMAD4 expression were downregulated 48 h post-transfection with the miR-524-5p mimic (data not shown). miR-miR-524-5p downregula-tion of endogenous expression of ZEB2 and SMAD4 was confirmed in quantitative real-time RT-PCR and Western blot analysis (Fig. 6a and b). Compared to transfection
d
e
f
a
b
c
with the negative control mimic, forced expression of miR-524-5p significantly inhibited endogenous mRNA ex-pression of ZEB2 and SMAD4 by almost 40% and 30%, re-spectively (Fig. 6a). The protein levels of ZEB2 and SMAD4 were also diminished by miR-524-5p mimic (Fig. 6b). Thus, these data suggested negative regulation of expression of ZEB2 and SMAD4 by miR-524-5p, which was confirmed by demonstration of direct miRNA target-ing in luciferase assays (Fig. 6c and d). The 3’-UTR con-struct of ZEB2 carried the two 5’ predicted target sites whereas the SMAD4 construct carried a cluster of four putative target sites (Fig. 6c). The ZEB2 or SMAD4 3’ -UTR construct was individually transfected into HCT-15 cells alone, or in the presence of miR-524-5p mimic or a NC, which resulted in 40% and 35% reduction of lucifer-ase activity, respectively, when co-transfected with the miR-524-5p mimic (Fig. 6d). Taken together, the results confirmed that miR-524-5p targeted and repressed the ex-pression of the EMT-associated genes ZEB2 and SMAD4, which may have a direct bearing on the initial phase of es-tablishing pluripotency.
Discussion
Emerging evidence has indicated that miRNAs play some crucial roles in somatic cell reprogramming,
self-renewal, and differentiation [5]. Overexpression of miR-520d-5p alone has been reported to successfully convert hepatoma cells into iPSC-like cells [15]. Since both C19MC members including miR-520d-5p and miR-524-5p are highly homologous in sequences and share the same seed sequence (Fig. 1a), the two miRNAs may share similar biological functions. It was first noted that miR-524-5p alone was unable to reprogram the normal fibroblast cells tested (data not shown). However, miR-524-5p was effective in enhancing the OSKM factor-driven reprogramming process. By targeting TP53INP1, miR-524-5p was shown to enhance proliferation and suppress apoptosis (Fig. 5a–d), both of which are early crucial events for reprogrammable cells to enter subse-quent phases of activation or upregulation of pluripo-tency genes in the progression of the reprogramming process [2, 3]. Furthermore, miR-524-5p was shown to target and downregulate expression of the EMT-related genes ZEB2 and SMAD4 and, hence, promoting MET, which is also an essential initial event of reprogramming [2, 3]. Others have reported that introduction of multiple members of the miR-302/367 family was able to rapidly and efficiently reprogram fibroblasts into iPSCs with or without other reprogramming factors [9, 10]. The miR-302/367 cluster enhances reprogramming efficiency by
Fig. 6EMT-related genes ZEB2 and SMAD4 are direct targets of miR-524-5p.a,bEffects of miR-524-5p overexpression on the expression of the EMT-related genes. A miR-524-5p mimic was transfected to WJ0706 cells for 48 h before the cells were harvested for analysis. The analysis of the expression of ZEB2 and SMAD4 by real-time RT-PCR (a) and Western blot analysis (b). In both experiments, TP53INP1 was included as a control.
increasing cell division rate [13] and suppressing apop-tosis [39], as well as promoting epigenetic reactivation of pluripotency genes [40], as shown here for miR-524-5p. In addition, miR-138 suppresses expression of p53 and its downstream genes, and significantly enhances iPSC generation [41]. Moreover, the miR-17-92, miR-106b-25, and miR-106a-363 clusters are highly expressed in the early phases of somatic cell reprogramming and directly target PTEN, p21, and TGFβR2, resulting in promoted iPSC induction by accelerating MET, cell cycle transi-tions, and regulation of epigenetic factors [11, 42]. In the reprogramming of somatic cells, miRNAs are more likely to act as co-factors by enhancing the reprogramming process, as shown with miR-524-5p in this work, rather than acting in solo to exert their effects. It also seems likely that different miRNA-driven regulatory mecha-nisms and pathways may be involved in reprogramming normal somatic cells as opposed to cancer cells, as in the case of miR-520d-5p and hepatoma [15].
Furthermore, we also observed in this study the lack of inverse correlation in expression levels between miR-524-5p and TP53INP1 in some cell lines, suggesting that besides regulation by miR-524-5p, TP53INP1 expression is likely regulated by other factors, notably by different transcription factors. Upon exposure to genotoxic agents, TP53INP1 expression was previously shown to be induced through p53-dependent and p53-independent pathways by transcription factors p53 and p73, respectively [32, 43, 44]. Furthermore, the transcription factor E2F1 directly upregulates TP53INP1 transcription independent of p53 and p73 [44], as do the inflammatory mediators tumor necrosis factor alpha and interleukin-6 [45]. On the other hand, recent studies have also demonstrated that TP53INP1 expression is often downregulated or si-lenced in cancer cells by numerous onco-miRNAs in-cluding miR-130b, miR-155, and miR-125b which are present in tumor cells [35, 46, 47]. In short, TP53INP1 is subjected to both positive and negative regulation by a battery of transcription factors and miRNAs, includ-ing miR-524-5p as shown in this work.
TP53INP1 and p53 are involved in many cellular pro-cesses, including apoptosis and regulation of cell cycle and ROS-induced stress [32, 43]. On induction by p53, TP53INP1 is SUMOylated and, in turn, regulates p53 transcriptional activity by targeting antiproliferative and proapoptotic genes, such as p21, Bax, and PUMA, lead-ing to cell-cycle arrest at the G1 phase or apoptotic cell death [32]. In another study, TP53INP1 was also shown to regulate p53 activity on genes related to cell-cycle regulation (Mdm2 and p21) and apoptosis (Pig3 and Bax) [48]. Hence, TP53INP1 and p53 form a positive feedback loop in their action. Furthermore, ectopic ex-pression of miR-504, miR-33, and miR-1285 has been shown to induce phenotypic changes associated with
the loss of p53, including reduced apoptosis and in-creased stemness [49]. Data from this and other works therefore strongly indicate that miRNA modulating the expression of both the TP53INP1 and p53 genes is important in fine-tuning the regulation of cell proli-feration and apoptosis in the induction of pluripotency in iPSCs.
miR-524-5p was also shown in this work to upre-gulate the expression of pluripotency genes Oct4, Nanog, Sox2, and Rex1 (Fig. 5f ). Expression of Oct4, Nanog, and Sox2 is known to be negatively regulated by p53 [1, 50, 51] and Rex1 expression is, in turn, regu-lated by Nanog, Oct4, and Sox2 [52, 53]. Hence, it may be speculated that the miR-524-5p/TP53INP1-induced upregulated expression of pluripotency genes observed in this study may be a consequence of TP53INP1-induced p53 repression.
To achieve successful iPSC induction, exogenous fac-tors are needed to initiate the MET program at the early stage of process by inhibiting EMT signals and ac-tivating the epithelial program [3, 54]. In this study, miR-524-5p was found to promote MET by inhibiting the expression of the EMT-related genes SMAD4 and ZEB2 (Fig. 6), which may thereby be associated with enhancing the reprogramming process. More specific-ally, reprogramming has been reported to be associated with the loss of the somatic cell signatures, such as ex-pression of the transcription factors SNAIL1/2 or ZEB1/2, and the gain of epithelial signatures, including expression of E-cadherin [3]. A SNAIL1-SMAD3/4 complex has previously been shown to promote the TGFβ-mediated downregulation of E-cadherin while ZEB2 regulates repression by binding to the E-box motif of the regulatory sequence of the E-cadherin gene [54]. Similarly, miR-302/367 and miR-200 play a crucial role in iPSC generation by targeting EMT-related genes TGFβR2 and ZEB1/ZEB2, respectively [12, 14], echoing our finding of miR-524-5p regulation of ZEB2.
Conclusions
In this work, we have provided experimental evidence to support that the C19MC miR-524-5p targets TP53INP1 to enhance cell proliferation and to suppress apoptosis, which are critical events in the early phase of cellular re-programming. Our data also show that miR-524-5p tar-gets the EMT-associated SMAD4 and ZEB2 genes to suppress MET, which is also a crucial step in initiating re-programming. Other C19MC miRNAs, particularly those that share the same seed sequence with the known repro-gramming miR-302/-372 families [7], may also be shown to contribute to cellular reprogramming in future studies.
Additional files
Additional file 1: Table S1.mRNA primers. (DOCX 19 kb)
Additional file 2: Table S2.Primers for cloning of luciferase constructs. (DOCX 21 kb)
Abbreviations
AP:Alkaline phosphatase; BrdU: 5-Bromo-2’-deoxyuridine;
C19MC: Chromosome 19 miRNA cluster; DMEM: Dulbecco’s modified Eagle’s medium; Dox: Doxycycline; ELISA: Enzyme-linked immunosorbent assay; EMT: Epithelial-to-mesenchymal transition; ESC: Embryonic stem cell; FBS: Fetal bovine serum; iPSC: Induced pluripotent stem cell; KEGG: Kyoto Encyclopedia of Genes and Genomes; KOSR: Knockout serum replacement; MEF: Mouse embryonic fibroblast; MET: Mesenchymal-to-epithelial transition; miRNA: microRNA; MSC: Mesenchymal stem cell; MTT: 3-(4,5-Dimethylthiazol-2-yl)-2,5-diphenyltetrazolium bromide; NC: Negative control;
NEAA: nonessential amino acids; nt: Nucleotide; OSKM: Oct4, Sox2, Klf4, and c-Myc; PCR: Polymerase chain reaction; ROS: Reactive oxygen species;
siRNA: Small interfering RNA; UTR: Untranslated region; WJ0706: Wharton’s Jelly MSC 0706
Acknowledgements
We thank Dr. Sandhya Sriram, Fat Metabolism and Stem Cell Group, Laboratory of Metabolic Medicine, Singapore Bioimaging Consortium, Biomedical Sciences Institutes (A-STAR), for total RNA preparation from the iPSCs used in this work.
Funding
This work was supported by the University of Malaya HIR-MoE Grant Initiative (Reference number UM.C/625/1/HIR/MOHE/CHAN/03, account number A000003-50001) to KBC, SKC, and TK, and a grant (FRGS/2/2014/SKK01/UTAR/ 01/2) to KBC from the Ministry of Higher Education, Malaysia.
Availability of data and materials
The datasets used and/or analyzed in the current study are available from the corresponding author on reasonable request.
Authors’contributions
PNNN, CJH, and KBC conceived and designed all the experiments and performed the data analysis in the study. PNNN performed the experiments with contribution from CJH in bioinformatics analysis. PNNN and KBC wrote the paper. SS provided the iPSC and human ESC cell lines and advice on culture. SKC provided advice and resources. TK provided the funding to conduct the study. All authors have read and approved the final manuscript.
Ethics approval and consent to participate
Not applicable.
Consent for publication
All authors have read and given consent to the publication of the manuscript.
Competing interests
The authors declare that they have no competing interests.
Publisher’s Note
Springer Nature remains neutral with regard to jurisdictional claims in published maps and institutional affiliations.
Author details
1Centre for Stem Cell Research, Universiti Tunku Abdul Rahman, Sungai
Long, Kajang, Selangor DE, Malaysia.2Department of Preclinical Sciences, Faculty of Medicine and Health Sciences, Universiti Tunku Abdul Rahman, Sungai Long Campus, Bandar Sungai Long, Cheras, 43000 Kajang, Selangor DE, Malaysia.3Faculty of Medicine and Health Sciences, Universiti Tunku Abdul Rahman, Sungai Long, Kajang, Selangor DE, Malaysia.4Department of Animal Science, Chinese Culture University, Taipei, Taiwan.5Graduate Institute of Biotechnology, Chinese Culture University, Taipei, Taiwan. 6Singapore BioImaging Consortium A*Star, Singapore, Singapore.7Duke-NUS
Graduate Medical School, Singapore, Singapore.8Tissue Engineering Group, National Orthopaedic Centre of Excellence for Research and Learning, Kuala Lumpur, Malaysia.9Department of Orthopaedic Surgery, Faculty of Medicine, University of Malaya, Kuala Lumpur, Malaysia.
Received: 21 March 2017 Revised: 29 August 2017 Accepted: 12 September 2017
References
1. Takahashi K, Yamanaka S. Induction of pluripotent stem cells from mouse embryonic and adult fibroblast cultures by defined factors. Cell. 2006;126:663–76.
2. Buganim Y, Faddah DA, Jaenisch R. Mechanisms and models of somatic cell reprogramming. Nat Rev Gene. 2013;14:427–39.
3. David L, Polo JM. Phases of reprogramming. Stem Cell Res. 2014;12:754–61. 4. Plath K, Lowry WE. Progress in understanding reprogramming to the
induced pluripotent state. Nat Rev Genet. 2011;12:253–65.
5. Leonardo TR, Schultheisz HL, Loring JF, Laurent LC. The functions of microRNAs in pluripotency and reprogramming. Nat Cell Biol. 2012;14:1114–21. 6. Stadler B, Ivanovska I, Mehta K, Song S, Nelson A, et al. Characterization of
microRNAs involved in embryonic stem cell states. Stem Cells Dev. 2010;19:935–50.
7. Nguyen PN, Huang CJ, Sugii S, Cheong SK, Choo KB. Selective activation of miRNAs of the primate-specific chromosome 19 miRNA cluster (C19MC) in cancer and stem cells and possible contribution to regulation of apoptosis. J Biomed Sci. 2017;24:20.
8. Miyoshi N, Ishii H, Nagano H, Haraguchi N, Dewi DL, et al. Reprogramming of mouse and human cells to pluripotency using mature microRNAs. Cell Stem Cell. 2011;8:633–8.
9. Anokye-Danso F, Trivedi CM, Juhr D, Gupta M, Cui Z, et al. Highly efficient miRNA-mediated reprogramming of mouse and human somatic cells to pluripotency. Cell Stem Cell. 2011;8:376–88.
10. Hu S, Wilson KD, Ghosh Z, Han L, Wang Y, et al. MicroRNA-302 increases reprogramming efficiency via repression of NR2F2. Stem Cells. 2013;31:259–68.
11. He X, Cao Y, Wang L, Han Y, Zhong X, et al. Human fibroblast reprogramming to pluripotent stem cells regulated by the miR19a/b-PTEN axis. PLoS One. 2014;9, e95213.
12. Wang G, Guo X, Hong W, Liu Q, Wei T, et al. Critical regulation of miR-200/ZEB2 pathway in Oct4/Sox2-induced mesenchymal-to-epithelial transition and induced pluripotent stem cell generation. Proc Natl Acad Sci U S A. 2013;110:2858–63. 13. Wang Y, Melton C, Li YP, Shenoy A, Zhang XX, et al. miR-294/miR-302
promotes proliferation, suppresses G1-S restriction point, and inhibits ESC differentiation through separable mechanisms. Cell Rep. 2013;4:99–109. 14. Subramanyam D, Lamouille S, Judson RL, Liu JY, Bucay N, et al. Multiple
targets of miR-302 and miR-372 promote reprogramming of human fibroblasts to induced pluripotent stem cells. Nat Biotechnol. 2011;29:443–8. 15. Tsuno S, Wang X, Shomori K, Hasegawa J, Miura N. Hsa-miR-520d induces
hepatoma cells to form normal liver tissues via a stemness-mediated process. Sci Rep. 2014;4:3852.
16. Bortolin-Cavaille ML, Dance M, Weber M, Cavaille J. C19MC microRNAs are processed from introns of large Pol-II, non-protein-coding transcripts. Nucleic Acids Res. 2009;37:3464–73.
17. Lin S, Cheung WK, Chen S, Lu G, Wang Z, et al. Computational identification and characterization of primate-specific microRNAs in human genome. Comput Biol Chem. 2010;34:232–41.
18. Liang Y, Ridzon D, Wong L, Chen C. Characterization of microRNA expression profiles in normal human tissues. BMC Genomics. 2007;8:166.
19. Spence T, Perotti C, Sin-Chan P, Picard D, Wu W, et al. A novel C19MC amplified cell line links Lin28/let-7 to mTOR signaling in embryonal tumor with multilayered rosettes. Neuro Oncol. 2014;16:62–71.
20. Vaira V, Elli F, Forno I, Guarnieri V, Verdelli C, et al. The microRNA cluster C19MC is deregulated in parathyroid tumours. J Mol Endocrinol. 2012;49:115–24. 21. Choo KB, Tai L, Hymavathee KS, Wong CY, Nguyen PN, et al. Oxidative
stress-induced premature senescence in Wharton's jelly-derived mesenchymal stem cells. Int J Med Sci. 2014;11:1201–7.
22. Hockemeyer D, Soldner F, Cook EG, Gao Q, Mitalipova M, et al. A drug-inducible system for direct reprogramming of human somatic cells to pluripotency. Cell Stem Cell. 2008;3:346–53.
23. Chen C, Ridzon DA, Broomer AJ, Zhou Z, Lee DH, et al. Real-time quantification of microRNAs by stem-loop RT-PCR. Nucleic Acids Res. 2005;33, e179. 24. Ishihara Y, Tsuno S, Kuwamoto S, Yamashita T, Endo Y, et al. Hsa-miR-520d
converts fibroblasts into CD105+ populations. Drugs RD. 2014;14:253–64. 25. Singh VK, Kalsan M, Kumar N, Saini A, Chandra R. Induced pluripotent stem
cells: applications in regenerative medicine, disease modeling, and drug discovery. Front Cell Dev Biol. 2015;3:2.
26. Robinton DA, Daley GQ. The promise of induced pluripotent stem cells in research and therapy. Nature. 2012;481:295–305.
27. Kapinas K, Grandy R, Ghule P, Medina R, Becker K, et al. The abbreviated pluripotent cell cycle. J Cell Physiol. 2013;228:9–20.
28. Jung CJ, Iyengar S, Blahnik KR, Jiang JX, Tahimic C, et al. Human ESC self-renewal promoting microRNAs induce epithelial-mesenchymal transition in hepatocytes by controlling the PTEN and TGFbeta tumor suppressor signaling pathways. Mol Cancer Res. 2012;10:979–91.
29. Itoh F, Watabe T, Miyazono K. Roles of TGF-beta family signals in the fate determination of pluripotent stem cells. Semin Cell Dev Biol. 2014;32:98–106. 30. Woltjen K, Stanford WL. Preview. Inhibition of TGF-beta signaling improves
mouse fibroblast reprogramming. Cell Stem Cell. 2009;5:457–8.
31. Puca R, Nardinocchi L, Givol D, D'Orazi G. Regulation of p53 activity by HIPK2: molecular mechanisms and therapeutical implications in human cancer cells. Oncogene. 2010;29:4378–87.
32. Peuget S, Bonacci T, Soubeyran P, Iovanna J, Dusetti NJ. Oxidative stress-induced p53 activity is enhanced by a redox-sensitive TP53INP1 SUMOylation. Cell Death Differ. 2014;21:1107–18.
33. Choi YJ, Lin CP, Ho JJ, He X, Okada N, et al. miR-34 miRNAs provide a barrier for somatic cell reprogramming. Nat Cell Biol. 2011;13:1353–60.
34. He L, He X, Lim LP, de Stanchina E, Xuan Z, et al. A microRNA component of the p53 tumour suppressor network. Nature. 2007;447:1130–4. 35. Ma S, Tang KH, Chan YP, Lee TK, Kwan PS, et al. miR-130b promotes CD133(+)
liver tumor-initiating cell growth and self-renewal via tumor protein 53-induced nuclear protein 1. Cell Stem Cell. 2010;7:694–707.
36. Liu F, Kong X, Lv L, Gao J. TGF-beta1 acts through miR-155 to down-regulate TP53INP1 in promoting epithelial-mesenchymal transition and cancer stem cell phenotypes. Cancer Lett. 2015;359:288–98.
37. Mah N, Wang Y, Liao MC, Prigione A, Jozefczuk J, et al. Molecular insights into reprogramming-initiation events mediated by the OSKM gene regulatory network. PLoS One. 2011;6, e24351.
38. Tsukerman P, Yamin R, Seidel E, Khawaled S, Schmiedel D, et al. MiR-520d-5p directly targets TWIST1 and downregulates the metastamiR miR-10b. Oncotarget. 2014;5:12141–50.
39. Zhang Z, Hong Y, Xiang D, Zhu P, Wu E, et al. MicroRNA-302/367 cluster governs hESC self-renewal by dually regulating cell cycle and apoptosis pathways. Stem Cell Rep. 2015;4:645–57.
40. Lin SL, Chang DC, Lin CH, Ying SY, Leu D, et al. Regulation of somatic cell reprogramming through inducible mir-302 expression. Nucleic Acids Res. 2011;39:1054–65.
41. Ye D, Wang G, Liu Y, Huang W, Wu M, et al. MiR-138 promotes induced pluripotent stem cell generation through the regulation of the p53 signaling. Stem Cells. 2012;30:1645–54.
42. Li Z, Yang CS, Nakashima K, Rana TM. Small RNA-mediated regulation of iPS cell generation. EMBO J. 2011;30:823–34.
43. Seillier M, Peuget S, Gayet O, Gauthier C, N'Guessan P, et al. TP53INP1, a tumor suppressor, interacts with LC3 and ATG8-family proteins through the LC3-interacting region (LIR) and promotes autophagy-dependent cell death. Cell Death Differ. 2012;19:1525–35.
45. Giusiano S, Garcia S, Andrieu C, Dusetti NJ, Bastide C, et al. TP53INP1 overexpression in prostate cancer correlates with poor prognostic factors and is predictive of biological cancer relapse. Prostate. 2012;72:117–28.
46. Zhang J, Cheng C, Yuan X, He JT, Pan QH, et al. MicroRNA-155 acts as an oncogene by targeting the tumor protein 53-induced nuclear protein 1 in esophageal squamous cell carcinoma. Int J Clin Exp Pathol. 2014;7:602–10. 47. Jiang F, Liu T, He Y, Yan Q, Chen X, et al. MiR-125b promotes proliferation and migration of type II endometrial carcinoma cells through targeting TP53INP1 tumor suppressor in vitro and in vivo. BMC Cancer. 2011;11:425. 48. Tomasini R, Samir AA, Carrier A, Isnardon D, Cecchinelli B, et al. TP53INP1s
and homeodomain-interacting protein kinase-2 (HIPK2) are partners in regulating p53 activity. J Biol Chem. 2003;278:37722–9.
49. Hermeking H. MicroRNAs in the p53 network: micromanagement of tumour suppression. Nat Rev Cancer. 2012;12:613–26.
50. Li M, He Y, Dubois W, Wu X, Shi J, et al. Distinct regulatory mechanisms and functions for p53-activated and p53-repressed DNA damage response genes in embryonic stem cells. Mol Cell. 2012;46:30–42.
51. Feng B, Jiang J, Kraus P, Ng JH, Heng JC, et al. Reprogramming of fibroblasts into induced pluripotent stem cells with orphan nuclear receptor Esrrb. Nat Cell Biol. 2009;11:197–203.
52. Hosler BA, Rogers MB, Kozak CA, Gudas LJ. An octamer motif contributes to the expression of the retinoic acid-regulated zinc finger gene Rex-1 (Zfp-42) in F9 teratocarcinoma cells. Mol Cell Biol. 1993;13:2919–28.
53. Shi W, Wang H, Pan G, Geng Y, Guo Y, et al. Regulation of the pluripotency marker Rex-1 by Nanog and Sox2. J Biol Chem. 2006;281:23319–25. 54. Lamouille S, Xu J, Derynck R. Molecular mechanisms of epithelial-mesenchymal
transition. Nat Rev Mol Cell Biol. 2014;15:178–96.
• We accept pre-submission inquiries
• Our selector tool helps you to find the most relevant journal
• We provide round the clock customer support
• Convenient online submission
• Thorough peer review
• Inclusion in PubMed and all major indexing services
• Maximum visibility for your research
Submit your manuscript at www.biomedcentral.com/submit
![Fig. 7 A proposed scheme of miR-524-5p regulation of the early stage of the reprogramming process [2, 3]](https://thumb-us.123doks.com/thumbv2/123dok_us/829907.2077960/13.595.58.539.87.302/fig-proposed-scheme-regulation-early-stage-reprogramming-process.webp)