O R I G I N A L A R T I C L E
Open Access
Do state work eligibility verification laws
reduce unauthorized immigration?
Pia M. Orrenius
1and Madeline Zavodny
2** Correspondence: mzavodny@agnesscott.edu 2Agnes Scott College and IZA, 141
E. College Ave., Decatur, GA 30030, USA
Full list of author information is available at the end of the article
Abstract
During the 2000s, several states adopted laws requiring employers to verify new employees’eligibility to work legally in the USA. This study uses data from the 2005–2014 American Community Survey to examine how such laws affect unauthorized immigrants’ locational choices. The results indicate that having an E-Verify law reduces the number of less-educated prime-age immigrants from Mexico and Central America—immigrants who are likely to be unauthorized—living in a state. We find evidence that some new migrants are diverted to other states, but also suggestive evidence that some already-present migrants leave the country entirely.
JEL codes:J15, J61, J68
Keywords:Illegal immigration, Undocumented immigrants, Enforcement, E-Verify
1 Introduction
US states and localities adopted an unprecedented number of laws regarding immi-grants during the late 2000s and early 2010s. Many of these laws were aimed at redu-cing the unauthorized immigrant population, with state lawmakers claiming they were responding to inaction by the federal government. One of the most commonly adopted laws requires employers to electronically verify new employees’eligibility to work le-gally in the USA. These provisions, often called “E-Verify laws” because they require employers to use the federal E-Verify system, may reduce the number of unauthorized immigrants living in a state by making it harder for them to find or switch jobs.
Understanding the effect of E-Verify laws on the number and locational choices of unauthorized immigrants is important given this population’s size. About 11.3 million unauthorized immigrants lived in the USA in 2014, accounting for 3.5 % of the US population and more than 5 % of the labor force (Passel and Cohn 2015). Slightly more than one quarter of immigrants living in the USA were unauthorized. Despite these sizable numbers, the unauthorized immigrant population has shrunk in recent years. In 2007, before the Great Recession, it totaled about 12.2 million and 30 % of all immi-grants living in the USA.
The recession likely was the major cause of the decline in the unauthorized immi-grant population, which fell by almost one million between 2007 and 2009. The drop appears to have been comprised of both a decline in new arrivals and an increase in departures from the USA (Passel et al. 2012). Stricter enforcement policies, including implementation of E-Verify requirements in several states as well as record numbers of
deportations and removals from the country, may also have played a role in the unauthorized immigrant population’s drop and failure to rebound even as the economic recovery gained steam.
Previous research generally shows that stricter enforcement policies, including state E-Verify laws, have a negative effect on unauthorized immigrants’ labor market out-comes. The wage penalty incurred by unauthorized immigrant workers from Mexico rose after the 1986 Immigration Reform and Control Act (IRCA) first made it illegal to hire unauthorized immigrants (Donato and Massey 1993). Employment and earnings fell among unauthorized immigrants as border and interior enforcement ramped up in the USA in the wake of the 9/11 terrorist attacks (Orrenius and Zavodny 2009). After Arizona became the first state to require virtually all employers to electronically verify new hires’eligibility to work in the USA, wage-and-salary employment fell among non-US citizen Hispanics there while self-employment rose (Bohn and Lofstrom 2013). Nationwide, unauthorized immigrants’ employment and earnings tended to fall in states that adopted E-Verify laws, although there is also some evidence of positive ef-fects on earnings and labor force participation (Amuedo-Dorantes and Bansak 2012, 2014; Orrenius and Zavodny 2015).
Evidence on the impact of stricter enforcement policies on the number and locational choices of unauthorized immigrants is based largely on Arizona. Arizona’s population of non-naturalized citizens fell dramatically after the state’s E-Verify mandate went into ef-fect in 2007 (Amuedo-Dorantes and Lozano 2015; Bohn et al. 2014). The decrease was concentrated among less-educated and Hispanic immigrants. One study suggests that many of these immigrants left the USA altogether rather than moved to other states, per-haps because they were deported (Amuedo-Dorantes and Lozano 2014). Other research, however, indicates an increase in migration from Arizona to other states (Ellis et al. 2014). It is unclear whether a later anti-unauthorized immigration law (SB 1070) passed in Arizona in 2010 further reduced the state’s population of unauthorized immigrants. A sur-vey of undocumented migrants along the border in Mexico suggests that the flow of un-documented migrants planning to enter Arizona fell by 30 to 70 % after the bill was passed, but undocumented immigrants already living in Arizona did not return to Mexico in large numbers (Hoekstra and Orozco-Aleman 2014). US population data suggest little effect of SB 1070 on the number of unauthorized immigrants in Arizona (Amuedo-Dorantes and Lozano 2015). Evidence beyond Arizona on state omnibus immigration laws, many of which included a universal E-Verify mandate, suggests a sizable drop in the population of unauthorized immigrants in states that adopted such laws (Good 2013).1
immigrants to other states and to cause some unauthorized immigrants already present in the USA to leave the country entirely.
2 Background on E-Verify
The employment eligibility verification laws that we examine require virtually all em-ployers to use E-Verify. E-Verify is a free online system created and managed by the federal government. It was first rolled out to several states in 1997 under the name Basic Pilot. It became available to employers in all states in 2003, but participation remained voluntary. Employers who use E-Verify enter the new worker’s information on the employment eligibility form (“Form I-9”), and E-Verify compares that informa-tion with Social Security Administrainforma-tion (SSA) and, if needed, Department of Home-land Security (DHS) records. If there is a discrepancy, the employer is notified of a tentative non-confirmation and is told to notify the worker, who then has 8 federal work days to contest the discrepancy. During those 8 days, the employer cannot fire the worker because of the discrepancy; however, the employer must fire the worker if the discrepancy is not resolved after that period.
Employers may disclose that they participate in E-Verify, but they are not allowed to verify applicants’ eligibility before making a job offer. Unauthorized workers can pass E-Verify only by committing identity fraud—by supplying another person’s valid Social Security number and name. In response to this concern, DHS added a photo matching tool in 2009 and now requires the employer, when possible, to verify that the photo in E-Verify is identical to the photo the employee presented when completing Form I-9. However, driver’s licenses—which most workers present as their photo identificatio-n—are not currently included in the DHS database.
In 2007, Arizona became the first state to require virtually all employers to use E-Verify. Six other states later adopted universal E-Verify laws, as listed in Table 1.2These laws require employers to use E-Verify for new hires, not for existing employees. In 2009, the federal government began requiring some government contractors and sub-contractors to use E-Verify for new and existing workers assigned to a federal contract. Several other states have adopted E-Verify laws that cover government employees and/ or government contractors, which are not listed in the table and are not our focus. Laws that cover government employees are considerably less likely to affect
Table 1States mandating universal use of E-Verify
State Adoption
date
Implementation date
Comments
Alabama June 2011 April 2012 Government contractors only in January–March 2012
Arizona July 2007 January 2008
Georgia May 2011 January 2012 Size phase in
Mississippi March 2008 July 2008 Size phase in
North Carolina June 2011 October 2012 Size phase in
South Carolina June 2011 January 2012
Utah March 2010 July 2010 Government employees and government contractors only in July 2009–June 2010
unauthorized immigrants than universal laws since relatively few immigrants work in the public sector. E-Verify laws that cover government contractors have greater poten-tial to affect unauthorized immigrants than laws that cover government employees, but less than universal laws.
3 Data
We use data from the 2005–2014 American Community Survey (ACS), a large-scale survey of the US population.3The ACS surveys about 1 % of US households each year; it replaced the long-form decennial census but is administered on a continuous basis instead of every 10 years. Households answer questions about members’ demographic characteristics, including country of birth, year of entry into the USA, and US citizen-ship status.
Ideally, we would identify immigrants in the ACS who are unauthorized. However, the ACS does not ask about legal status. We therefore infer whether immigrants are likely to be unauthorized based on their age, education, country of birth and US citizenship sta-tus.4Most unauthorized immigrants to the USA are prime-aged because they migrate in order to work. Most have relatively little education because they are from countries with low average levels of educational attainment. In addition, unauthorized immigrants are typically only able to get jobs in less-skilled sectors, such as agriculture, construction, manufacturing, and leisure and hospitality. This reduces the incentive for more-educated people to migrate illegally. About three - quarters of adult unauthorized immigrants have no more education than a high school degree (Passel and Cohn 2009). Because of geographic proximity and poor economic and social conditions at home, as well as extensive migrant networks, more than two - thirds of unauthorized immigrants in the USA are from Mexico and Central America. Unauthorized immigrants are not eli-gible for US citizenship.
We define likely unauthorized immigrants here as immigrants aged 20–54 who have at most completed high school, are from Mexico or Central America, and are not US citizens.5Of course, some people in the group we examine are legally present in the USA. Our estimates therefore may reflect the lower bound of the effect of E-Verify laws. However, migration often occurs as a family unit. A legal immigrant who is mar-ried to an unauthorized immigrant may also move in response to E-Verify laws. More than three - quarters of married-with-spouse-present, less-educated, prime-age, non-US citizen immigrants from Mexico or Central America in the ACS are married to an-other likely unauthorized immigrant.6
New immigrants’ locational choices are likely to be particularly sensitive to E-Verify mandates since they may have the fewest roots in the USA and they need to find a job. As Borjas (2001) points out, new arrivals tend to be more responsive to geographic dif-ferences in economic opportunities because they have a lower marginal cost than earl-ier immigrants or US natives of moving to any particular state since they are coming from abroad.
We also report baseline regression results below for immigrants who have at least attended some college and for less-educated US natives. For comparability with our sample of likely unauthorized immigrants, we include only prime-age adults in these groups, and the sample of more-educated immigrants is restricted to those who are not naturalized citizens and are from Mexico and Central America. These groups serve as a check on whether we are capturing effects of E-Verify laws instead of other factors. Finding similar effects among likely unauthorized immigrants and these groups would suggest we are capturing something other than the effects of E-Verify laws. However, E-Verify laws may have an indirect effect on these groups if employers turn to them in-stead of to unauthorized immigrants. We therefore may observe in-migration effects among more-educated immigrants or less-educated natives if E-Verify laws lead to bet-ter labor market opportunities for those groups.8On the other hand, effects may not be positive among US-born Hispanics if E-Verify laws lead to discrimination against them. There is a precedent for this: Labor market outcomes worsened among US-born Hispanics after the 1986 IRCA made it illegal to hire unauthorized immigrants (Dávila et al. 1998). In addition, some more-educated immigrants or less-educated natives may move in response to E-Verify laws that affect an unauthorized-immigrant spouse.
4 Methodology
We first examine the effect of the E-Verify mandates on population size using ordinary least squares (OLS) regression models of the basic form
ln Populationst¼ α þ β1E‐Verifystþ β2Economic Conditionsst−1
þ Statesþ Yeartþ Trendstþ εst;
ð1Þ
where sindexes states andtindexes time (year). The dependent variable is the natural log of a measure of population size.9E-Verify is the fraction of the year that a state has a universal E-Verify mandate in effect. We use the fraction of the year that an E-Verify mandate is in effect because we do not know the month that people were surveyed and some of the laws went into effect mid-year. We report results from specifications that measure E-Verify at time tor at timet−1, the previous year, since unauthorized immi-grants may not move immediately in response to implementation of E-Verify.
conditions that prevailed in the recent past. Results for those variables are not reported here but are available on request.
The regressions include state and time fixed effects that control for unobservable state- or year-specific factors that affect population size. The year fixed effects capture the national business cycle or other changes common to all states, such as the imple-mentation of the federal E-Verify law in 2009. The regressions also include state-specific linear time trends to control for underlying trends. We caution that these trend variables may capture part of any effect of the mandates since some mandates coin-cided with the recession and a general decline in the unauthorized immigrant popula-tion. The data are weighted using the sum of the ACS person weights for a given cell. The estimated standard errors are clustered at the state level.
Our identification scheme compares the size of the likely unauthorized immigrant population before and after states implemented E-Verify. Because the regressions in-clude state fixed effects, year fixed effects, and state-specific time trends, the esti-mated coefficients onE-Verify measure whether the population size changed within a state after it implemented E-Verify, controlling for the linear trend in the state’s unauthorized immigrant population and for the business cycle. States that have not adopted Verify do not contribute to the identification of the coefficient on the E-Verify variable, but they do help identify the coefficients on the business cycle con-trols and the year fixed effects.
This approach assumes that whether a state implements E-Verify is unrelated to the size of its unauthorized immigrant population and factors that affect population size, controlling for business cycle conditions in that state. In other words, it assumes that E-Verify mandates are exogenous. The state fixed effects capture any time-invariant dif-ferences across states that might attract unauthorized immigrants, while the state-specific time trends capture any linear trends in a state that might attract unauthorized immigrants. Non-linear trends are not captured, however. If unmeasured non-linear changes in the state attract unauthorized immigrants, which in turn leads the state to implement E-Verify, the estimated coefficient on the E-Verify variable is biased up-wards, or too positive. Although not a conclusive test for exogeneity, we separately examine whether the population size of likely unauthorized immigrants is related to whether a state adopted E-Verify.
One of the key questions regarding state-level E-Verify laws is whether they lead to a decrease in the total number of unauthorized immigrants in the USA or just a realloca-tion of unauthorized immigrants across states. We use several techniques to examine whether unauthorized immigrants already in the country move to other states in re-sponse to E-Verify laws and whether newly arriving unauthorized immigrants are diverted to other states.
models are similar to Eq. (1) but add a variable measuring the presence of E-Verify in other states:
ln Populationst¼ α þ β1E‐Verifystþ β2E‐Verify in Nearby Statesst
þ β3Economic Conditionsst−1þ Statesþ Yeart
þ Trendstþ εst:
ð2Þ
If E-Verify laws cause immigrants to relocate to non-E-Verify states, β2will be
posi-tive. As before, we estimate the regression using either contemporaneous or year-ago E-Verify laws.
Second, we examine the effect of E-Verify on mobility among likely unauthorized im-migrants. The ACS asks where people lived 1 year ago. We use those answers to count the number of likely unauthorized immigrants in four groups: stayers (people who lived in the state this year and last year); domestic in-migrants (people who moved to that state from another state); international in-migrants (people who moved to that state from abroad); and domestic out-migrants (people who moved from that state to an-other state).10We examine the relationship between the presence of an E-Verify law in a state last year or this year and migration into and out of that state by applying Eq. (1) to the number of immigrants in each of these four groups.
5 Results
We first examine the effect of E-Verify on the size of the likely unauthorized immigrant population—less-educated, prime-age, non-US citizen immigrants from Mexico and Central America—using OLS regressions to estimate Eq. (1). Table 2 reports the results. The presence of a universal E-Verify mandate last year has a significant negative effect on the number of likely unauthorized immigrants who arrived 1 to 5 years ago (row 1, column 3). The estimated effects for likely unauthorized immigrants as a whole, non-recent immigrants, and new immigrants are also negative but not significantly different from zero. The results suggest the number of recent immigrants falls by almost 40 % if a state had a universal E-Verify law in effect all last year.
The presence of an E-Verify mandate this year has a significant negative effect on the number of likely unauthorized immigrants overall and the numbers of recent and new likely unauthorized immigrants. Although the estimates are less precise, they suggest that the effect of having an E-Verify mandate a year ago on the number of all and re-cent likely unauthorized immigrants is larger than the effect of having a mandate this year. This suggests that some immigrants already present in the USA respond with a
Table 2The effect of E-Verify laws on likely unauthorized immigrant population size
All Not recent Recent New
A. E-Verify last year −0.096 (0.062) −0.069 (0.046) −0.385*** (0.080) −0.229 (0.162)
B. E-Verify this year −0.061** (0.023) −0.026 (0.026) −0.258*** (0.071) −0.464* (0.259)
N 510 510 510 510
*p< 0.1; **p< 0.05; ***p< 0.01
lag to E-Verify mandates. They may need to experience adverse consequences in the labor market, such as not easily being able to switch jobs, before leaving a state that has enacted an E-Verify mandate. New immigrants, in contrast, appear to be more re-sponsive to the contemporaneous presence of a law than to the presence of a law a year ago. This makes sense if immigrants newly arriving in the country are more forward looking than immigrants already present in the country.
If the sample is restricted to likely unauthorized immigrant men who are not married with a spouse present—a group particularly likely to be unauthorized (Caponi and Plesca 2014)—most of the results are even larger (in absolute value) than those re-ported in Table 2.11Notably, the number of new likely unauthorized immigrants falls by more than 50 % (a result that is statistically significant at the 1 % level) when a state has an E-Verify law in effect all of the current year.
No particular state appears to drive the results. We generally find similar results when dropping, one by one, each of the seven states that adopted a universal E-Verify law during 2005–2014. Table 3 shows the results for specifications with the contempor-aneous E-Verify variable. The top row reproduces the result with all states. The nega-tive effect for new likely unauthorized immigrants is smaller and no longer statistically significant if Arizona is dropped from the sample, while the negative effect for non-recent immigrants becomes significant. This suggests that new immigrants particularly avoided Arizona after that state became the first one to adopt a universal E-Verify law, but long-time immigrants did not leave the state in large numbers.
It is possible that federal immigration enforcement efforts are not entirely captured by the year fixed effects and are correlated with state E-Verify laws, driving some of the observed population changes. To test this, we added a regional measure of the number of immigrant removals during 2005–2013.12 The results are robust to controlling for the number of immigrants ordered removed by federal immigration courts, most of whom are unauthorized immigrants. The number of immigrants ordered removed is positively related to the number of recent and new likely unauthorized immigrants, as expected if areas with more unauthorized immigrants experience more removals.
Table 3Robustness of estimates to dropping individual states with an E-Verify law
All Not recent Recent New
A. All states −0.061** (0.023) −0.026 (0.026) −0.258*** (0.071) −0.464* (0.259)
N 510 510 510 510
B. Without Alabama −0.043*** (0.013) −0.017 (0.026) −0.212*** (0.059) −0.463* (0.266)
C. Without Arizona −0.060* (0.033) −0.050* (0.028) −0.306*** (0.093) −0.055 (0.180)
D. Without Georgia −0.070** (0.034) −0.024 (0.040) −0.233** (0.102) −0.629*** (0.219)
E. Without Mississippi −0.062** (0.023) −0.029 (0.027) −0.256*** (0.074) −0.469* (0.265)
F. Without North Carolina −0.060* (0.030) −0.015 (0.029) −0.247*** (0.086) −0.514* (0.290)
G. Without South Carolina −0.057** (0.024) −0.014 (0.025) −0.279*** (0.079) −0.514* (0.277)
H. Without Utah −0.069*** (0.022) −0.032 (0.025) −0.280*** (0.069) −0.456* (0.270)
N 500 500 500 500
*p< 0.1; **p< 0.05; ***p< 0.01
However, controlling for this variable has little effect on the relationship between a state’s E-Verify law and the number of likely unauthorized immigrants. Further, the presence of an E-Verify law is not significantly related to the number of immigrants or-dered removed in a state if specifications similar to Eq. (1) are estimated with the log of removals as the dependent variable. It is worth noting that most removals occur at the US-Mexico border and, as a result, the great majority of very recently arrived immi-grants who are deported never show up in surveys like the ACS.
The results are also robust to controlling for the presence of state-wide 287(g) agree-ments.13 These agreements delegated federal authority to enforce immigration laws to local law enforcement officials.14In essence, likely unauthorized immigrants who come into contact with the police in areas with a 287(g) agreement may be reported to Immi-gration and Customs Enforcement and then detained and eventually deported. Control-ling for whether a state has signed a 287(g) agreement does not affect the relationship between E-Verify laws and the number of likely unauthorized immigrants. Interestingly, we do not find that having a 287(g) agreement in place significantly reduces the num-ber of likely unauthorized immigrants in a state.
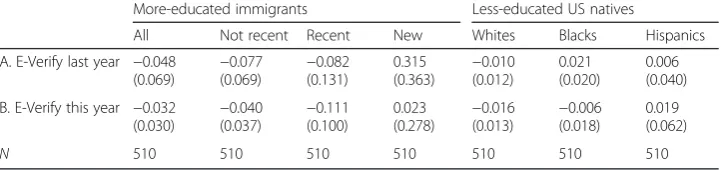
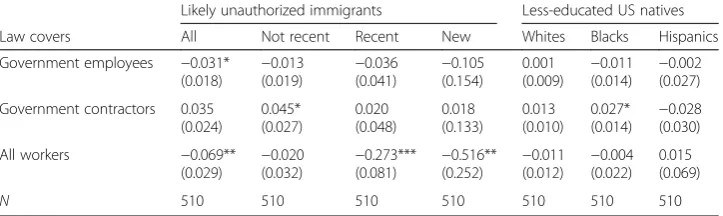
Table 4 shows the results of specifications similar to Table 2 for our comparison groups: more-educated, prime-age, non-naturalized immigrants from Mexico and Central America and less-educated US natives. As expected, the presence of an E-Verify law last year or this year is not significantly related to the population size of these groups. Further, the estimated coefficients for US natives (columns 5–7) are very small, indicating the laws do not affect natives’ locational choices. This suggests that our regressions capture the effect of E-Verify laws rather than factors that affect all non-naturalized immigrants from Mexico and Central America or all low-skilled workers. Another way to examine the validity of our empirical approach is to look at the ef-fect of non-universal E-Verify laws. As discussed earlier, some states enacted E-Verify requirements that apply only to government employees or contractors. Table 5 shows the estimated effects of E-Verify laws that cover government employees and contrac-tors as well as the effects of universal laws on the number of likely unauthorized im-migrants in a state; for brevity, we only report results for contemporaneous laws. We also look at effects on less-educated US natives since these laws may increase demand for US-born workers who are substitutes for immigrants.
The results indicate that E-Verify requirements for government employees and gov-ernment contractors have relatively little effect on the number of likely unauthorized
Table 4The effect of E-Verify laws on comparison groups’population size
More-educated immigrants Less-educated US natives
All Not recent Recent New Whites Blacks Hispanics
A. E-Verify last year −0.048 (0.069) −
0.077 (0.069) −
0.082 (0.131)
0.315 (0.363) −
0.010 (0.012)
0.021 (0.020)
0.006 (0.040)
B. E-Verify this year −0.032 (0.030)
−0.040 (0.037)
−0.111 (0.100)
0.023 (0.278)
−0.016 (0.013)
−0.006 (0.018)
0.019 (0.062)
N 510 510 510 510 510 510 510
immigrants or less-educated US natives in a state. This is not surprising since relatively few unauthorized immigrants are directly affected by those laws. Laws affecting govern-ment employees have a small negative effect on the total number of likely unauthorized immigrants (row 1, column 1), while laws covering government contractors appear to boost the number of long-term immigrants (row 2, column 2) and less-educated black natives (row 2, column 6) in a state. As the bottom row of the table reports, universal laws continue to reduce the number of all, recent, and new likely unauthorized immi-grants in a state when controlling for other types of E-Verify laws, which five of the seven states with a universal mandate had before putting a universal mandate into effect.15
The effect of E-Verify laws on the number of unauthorized immigrants in a state may increase or decrease over time. It may take a while for unauthorized immigrants to learn about E-Verify laws or to be affected by them, in which case the effect may in-crease over time. Alternatively, unauthorized immigrants (and their employers) may initially react to E-Verify laws but learn over time that the laws are not strictly enforced or are easily evaded. To examine the effect of E-Verify over time, we added to Eq. (1) a variable that measures the number of years that a universal E-Verify law has been in place; the variable equals zero the first year a law is in effect and increases by one each subsequent year.
Table 6 reports the regressions results. The negative effect of E-Verify on the number of recent immigrants grows significantly over time (column 3). For new arrivals, in Table 5The effect of different types of E-Verify laws on population size
Likely unauthorized immigrants Less-educated US natives
Law covers All Not recent Recent New Whites Blacks Hispanics
Government employees −0.031* (0.018) − 0.013 (0.019) − 0.036 (0.041) − 0.105 (0.154) 0.001 (0.009) − 0.011 (0.014) − 0.002 (0.027)
Government contractors 0.035 (0.024) 0.045* (0.027) 0.020 (0.048) 0.018 (0.133) 0.013 (0.010) 0.027* (0.014) − 0.028 (0.030)
All workers −0.069** (0.029) −0.020 (0.032) −0.273*** (0.081) −0.516** (0.252) −0.011 (0.012) −0.004 (0.022) 0.015 (0.069)
N 510 510 510 510 510 510 510
*p< 0.1; **p< 0.05; ***p< 0.01
Note: Shown are estimated coefficients on a variable measuring the fraction of the year that an E-Verify law covering government employees, government contractors, or all workers was in effect in a state. The dependent variable is logged. Each column is from a separate OLS regression. The regressions include the log of state real GDP per capita, the unemployment rate, housing permits, housing starts, and the log of real state government expenditures per capita (all lagged 1 year); state and year fixed effects; and state-specific linear time trends. Observations are weighted using the sum of the person weights in the population group. Standard errors are robust and clustered on state
Table 6The effect of E-Verify laws on likely unauthorized immigrant population size over time
All Not recent Recent New
E-Verify in effect this year −0.059**
(0.025) − 0.023 (0.018) − 0.254*** (0.066) − 0.461* (0.240)
Number of years in effect −0.025 (0.024) −0.033 (0.026) −0.111*** (0.029) 0.050 (0.062)
N 510 510 510 510
*p< 0.1; **p< 0.05; ***p< 0.01
contrast, the effect does not change significantly over time—the drop in the number of newly arriving likely unauthorized immigrants appears to be sustained but not to grow over time (column 4). However, the more-negative effect over time among recent im-migrants may be partly mechanical.16Since new arrivals in yeartare recent immigrants in years t +1 through t +5, the large, sustained drop in the number of newly arriving likely unauthorized immigrants is likely to translate into a negative effect on the num-ber of recent likely unauthorized immigrants that grows over time. In any case, we cau-tion that only three states had E-Verify laws in place for more than 3 years in our sample: Arizona, Mississippi, and Utah. A longer time period for more states is needed to better understand how the effect of E-Verify changes over time.
5.1 Does the number of unauthorized immigrants affect E-Verify law adoption?
The seven states that adopted universal E-Verify mandates are all relatively conservative states located in the South or Southwest. To varying degrees, these states experienced an influx of immigrants during the 1990s and early 2000s. However, some other states that also experienced an influx of immigrants during that period did not adopt universal E-Verify laws. Many of those states are in the Midwest and also tend to lean Republican. Determining exactly what caused some states to adopt E-Verify laws is beyond the scope of this paper, but we briefly address whether increases in the population of likely unauthorized immigrants caused states to adopt a universal E-Verify law. To do this, we estimate regressions in which the dependent variable equals one if a state adopted a universal E-Verify law that year. The regressions include the log level or the growth rate of the population of all, non-recent, recent, or new likely unauthorized immi-grants, our lagged measures of economic conditions, state and year fixed effects, and state-specific time trends.
As shown in Table 7, none of the results indicate that having a larger number of likely unauthorized immigrants or a faster growth rate of that population caused states to adopt E-Verify.17Although not conclusive proof that the adoption of E-Verify is exogenous, the results suggest that something other than changes in the population of unauthorized immigrants or factors that led to changes in that population caused states to adopt E-Verify.
Table 7The effect of likely unauthorized immigrant population size on E-Verify law adoption
All Not recent Recent New
A. Population size last year 0.143 (0.138)
0.029 (0.074)
0.109 (0.091)
0.010 (0.020)
N 459 459 459 459
B. Population size this year 0.318 (0.211)
0.235 (0.146)
0.137 (0.101)
0.036 (0.044)
N 510 510 510 510
C. Population growth rate 0.047 (0.050)
0.007 (0.058)
−0.042 (0.043)
0.021 (0.019)
N 459 459 459 459
5.2 Evidence on spillovers
To determine whether E-Verify laws reduce the total population of unauthorized immi-grants or just reallocate them across states, we first examine spillovers, or whether E-Verify laws in other states affect the number of likely unauthorized immigrants living in a given state. To do this, we construct two measures of E-Verify laws in other states: the fraction of bordering states with a universal E-Verify law in effect and a distance-weighted measure of the presence of universal E-Verify laws in other states that gives less weight to states that are further away. As in Eq. (2), the regressions include one of those two variables and a variable measuring the presence of E-Verify in a given state that year.
Table 8 gives the results. The presence of E-Verify in other states does not appear to increase the number of all, non-recent, or recent likely unauthorized immigrants in a given state, but it does boost the number of new likely unauthorized immigrants in a given state. The number of new likely unauthorized immigrants in a state is about 57 % higher if every contiguous state has E-Verify (panel A, column 4). The distance-weighted measure also indicates a positive effect, although its coefficient does not lend itself to a clear interpretation because of the weighting scheme (panel B, column 4). Both measures thus suggest that E-Verify laws divert some new arrivals to other states. Meanwhile, immigrants who are already settled in the USA do not appear to move to nearby states in response to E-Verify laws. In fact, the fraction of bordering states with E-Verify is negatively related to the number of non-recent likely unauthorized immi-grants in a state (panel A, column 2). This result may be an artifact of the geographic clustering of states that adopted E-Verify laws.
Our failure to find that E-Verify mandates increase the number of already-present likely unauthorized immigrants in nearby states does not necessarily mean that they leave the country entirely when a state requires E-Verify. Instead, they may relocate in a pattern unrelated to the distance from E-Verify states. We therefore turn next to an analysis of mobility patterns among likely unauthorized immigrants.
Table 8The effect of own and other states’E-Verify laws on likely unauthorized immigrant population size
All Not recent Recent New
A. Own state and fraction of bordering states
E-Verify in own state −0.053* (0.027)
−0.005 (0.027)
−0.261*** (0.086)
−0.580*** (0.201)
E-Verify in bordering states −0.032 (0.041) −
0.082* (0.042)
0.014 (0.126)
0.571*** (0.132)
B. Own state and distance-weighted fraction of other states
E-Verify in own state −0.040
(0.028)
0.006 (0.032) −0.202**
(0.077) −
0.614*** (0.190)
E-Verify in other states −4.856 (3.663)
−7.386 (4.541)
−14.929 (9.482)
50.153** (19.435)
N 510 510 510 510
*p< 0.1; **p< 0.05; ***p< 0.01
5.3 Mobility
In a final effort to determine how E-Verify laws affect the number of unauthorized im-migrants, we examine the effect of universal E-Verify laws on the number of likely unauthorized immigrants who stay in a state, the number who migrate to a state from other states and from abroad, and the number who leave a state in order to migrate to another state. Table 9 shows the regression results for these four groups. Looking first at stayers, the presence of an E-Verify law in a state last year reduces the total number of likely unauthorized immigrants who stay in that state by about 10 % (row 1, column 1). This result is driven by recent immigrants—the number of recent immigrants who remain in a state is almost 40 % lower if a state had a universal E-Verify law last year (row 1, column 3). The contemporaneous presence of an E-Verify law also reduces the number of stayers (row 2), although the effects are slightly smaller.
The presence of an E-Verify law last year or this year does not affect the number of in-migrants from other states, as panel B reports. Panel C reproduces the results for new immigrants as those are the number of in-migrants from abroad. The presence of an E-Verify law this year reduces the number of in-migrants from abroad. The number of non-recent likely unauthorized immigrants who left a state is lower if a state had an E-Verify law last year; this result is the opposite of the expected effect if E-Verify laws cause unauthorized immigrants to leave. However, a relatively low share of non-recent immigrants is unauthorized compared with the two other time-since-migration groups we examine here. More of the non-recent group is presumably made up of documented
Table 9The effect of E-Verify laws on likely unauthorized immigrants’mobility
All Not recent Recent and new
A. Remain in state
E-Verify last year −0.100*
(0.059) −
0.070
(0.044) −
0.394*** (0.079)
E-Verify this year −0.062***
(0.022)
−0.029 (0.027)
−0.259*** (0.071)
B. In-migration from other states
E-Verify last year −0.068
(0.191) −
0.080
(0.195) −
0.107 (0.223)
E-Verify this year 0.032
(0.150)
0.095 (0.187)
−0.157 (0.249)
C. In-migration from abroad
E-Verify last year −0.229
(0.162) – −
0.229 (0.162)
E-Verify this year −0.464*
(0.259)
– −0.464*
(0.259)
D. Out-migration to other states
E-Verify last year −0.251
(0.198) −
0.430* (0.214)
0.175 (0.305)
E-Verify this year −0.131
(0.266)
−0.189 (0.319)
−0.055 (0.302)
N 510 510 510
*p< 0.1; ***p< 0.01
immigrants, who may benefit from E-Verify laws that reduce competition in the labor market.
The results in Table 9 do not indicate major migration across states by unauthorized immigrants already present in the USA. If so, we would expect to observe a negative ef-fect on in-migration from other states and a positive efef-fect on out-migration to other states. We do not observe such effects. This is consistent with the failure to find posi-tive effects of other states’policies on the number of long-time and recent immigrants in a given state in Table 8. Yet E-Verify laws cause the number of likely unauthorized immigrants who remain in a state to fall, as shown in Table 9, and the population of re-cent likely unauthorized immigrants to decline, as shown in Table 2. Taken as a whole, the results here thus suggest that most of the drop in the number of already-present unauthorized immigrants in states that adopt universal E-Verify laws is due to them leaving the USA entirely.
6 Conclusions
The results here point to several conclusions: First, E-Verify laws reduce the number of unauthorized immigrants in a state. This effect tends to be concentrated among recent arrivals and is particularly large for newly arriving immigrants. Second, the evidence suggests that E-Verify laws divert some newly arriving unauthorized immigrants to other states. The number of new likely unauthorized immigrants rises in a state as more nearby states begin requiring employers to use E-Verify.
Among immigrants already present in the country, however, we do not find evidence of migration to other states in response to E-Verify laws. This suggests that at least some of these immigrants—and perhaps many of them—leave the country entirely. However, the American Community Survey data that we use here do not allow us to directly examine immigrants who leave the USA entirely. The survey also does not ask about legal status, which we proxy using age, education, place of birth, and reported US citizenship status. Data that include legal status and that encompass people who leave the USA would give a more complete understanding of whether unauthorized im-migrants leave in response to employment eligibility verification laws. Nonetheless, our results together with previous findings that E-Verify laws and other enforcement mea-sures generally lead to worse labor market outcomes among likely unauthorized immi-grants may give policymakers additional reason to consider adopting such policies if they hope to reduce the number of unauthorized immigrants in the USA and are not concerned about adverse effects on those who remain.
Endnotes 1
laws and 287(g) participation had slower growth in their unauthorized immigrant population during the 2000s (Leerkes et al. 2012).
2
We do not only include states that require employers to use E-Verify but also give them another option, such as retaining a copy of the documents used to complete Form I-9; Louisiana and Tennessee have such laws. Including those states as mandatory E-Verify states gives estimated coefficients that are closer to zero, as expected if those laws have little effect.
3
We use IPUMS data from Ruggles et al. (2015).
4
Studies conclude that the ACS and similar surveys include unauthorized immigrants to a significant extent, although they are undercounted (e.g., Hanson 2006; Massey 2013).
5
Although some unauthorized immigrants may report being naturalized citizens in the ACS, we do not examine naturalized citizens since the share that is unauthorized immigrants is presumably very low. We do not include people whose place of birth or citizenship status was imputed by the ACS. We also do not include people born abroad to US-citizen parents since they are usually eligible for US citizenship at birth.
6
Authors’own calculations.
7
In our sample, about 16 % of all likely unauthorized immigrants arrived 1 to 5 years ago and another 1.6 % within the last year.
8
However, research does not suggest this is the case for less-educated natives in Arizona (Bohn et al. 2015).
9
For cells with zero population in them in the ACS data, we replace them with a value of 1 before taking the log. The results are similar if those cells are not included in the regressions.
10
We are not able to look directly at international out-migrants since the ACS only captures people who live in the USA. In theory, this number can be backed out by comparing the change in a state’s population with the number of in-migrants and the number of out-migrants to other states. However, such calculations are based on a re-sidual and require strong assumptions about the ability of the ACS weights to measure short-run changes in an itinerant population.
11
All results discussed but not shown here are available on request.
12
Counts of the number of immigrants ordered removed are from Syracuse University’s Transactional Records Access Clearinghouse (http://trac.syr.edu/phptools/immigration/ court_backlog/court_proctime_outcome.php). Not all states have immigration courts, so we assign removals across states within jurisdictions based on the distribution of unauthorized immigrants within each jurisdiction. The results are robust to using distri-butions that changed each year and distridistri-butions from 2005. The distribution of unauthorized immigrants across states is based on data from Warren and Warren (2013) and Warren (2014); details available from the authors on request.
13
We thank Sarah Bohn for providing us with information on these laws.
14
The 287(g) program was only in effect through 2012. Our results are not sensitive to whether we keep the 287(g) variable equal to 1 or set it equal to 0 after 2012 in states that had signed a 287(g) agreement.
15
The two exceptions are Arizona and Mississippi. In our specification, the public sector and contractor dummy variables equal zero if the universal mandate variable equals one.
16
This is not the case for recent likely unauthorized immigrants. In addition, if states that adopt an E-Verify law are included in the sample only the first year that an E-Verify law goes into effect there, having an E-Verify law remains significantly negatively related to the number of all and recent likely unauthorized immigrants.
17
Consistent with this, Ramakrishnan and Wong (2010) find that political factors are more important than changes in the size of the Latino immigrant population in explaining the proposal and passage of anti-unauthorized immigration measures at the state and local levels.
Competing interests
The IZA Journal of Migration is committed to the IZA Guiding Principles of Research Integrity. The authors declare that they have observed these principles.
Acknowledgements
The views expressed here are solely those of the authors and do not reflect those of the Federal Reserve Bank of Dallas or the Federal Reserve System. The authors thank an anonymous referee, Marie Mora, and Todd Sorensen for their helpful comments along with the seminar participants at Princeton University, the 12th IZA Annual Migration Meeting, the 2015 Federal Reserve System Applied Microeconomics conference, and the 2015 Southern Economic Association conference.
Responsible editor: Amelie Constant
Author details
1Federal Reserve Bank of Dallas and IZA, 2200 N. Pearl St., Dallas, TX 75201, USA.2Agnes Scott College and IZA, 141 E.
College Ave., Decatur, GA 30030, USA.
Received: 30 December 2015 Accepted: 4 February 2016
References
Amuedo-Dorantes C, Bansak C. The labor market impact of mandated employment verification systems. Am Econ Rev: Papers Proc. 2012;103:543–8.
Amuedo-Dorantes C, Bansak C. Employment verification mandates and the labor market outcomes of likely unauthorized and native workers. Contemp Econ Policy. 2014;32:671–80.
Amuedo-Dorantes C, Lozano F. Piecemeal immigration enforcement and the new destinations of interstate undocumented migrants: evidence from Arizona. Mimeo: Pomona College and San Diego State University; 2014. Amuedo-Dorantes C, Lozano F. On the effectiveness of SB1070 in Arizona. Econ Inq. 2015;53:335–51.
Bohn S, Lofstrom M. Employment effects of state legislation. In: Card D, Raphael S, editors. Immigration, Poverty, and Socioeconomic Inequality. New York: Russell Sage; 2013. p. 282–314.
Bohn S, Lofstrom M, Raphael S. Did the 2007 Legal Arizona Workers Act reduce the state’s unauthorized immigrant population? Rev Econ Stat. 2014;96:258–69.
Bohn S, Lofstrom M, Raphael S. Do E-Verify mandates improve labor market outcomes of low-skilled native and legal immigrant workers? Southern Econ J. 2015;81:960–79.
Borjas GJ. Does immigration grease the wheels of the labor market? Brookings Papers Econ Activ. 2001;2001:69–119. Caponi V, Plesca M. Empirical characteristics of legal and illegal immigrants in the USA. J Popul Econ. 2014;27:923–60. Dávila A, Pagán JA, Grau MV. The impact of IRCA on the job opportunities and earnings of Mexican-American and
Hispanic-American workers. Int Migr Rev. 1998;32:79–85.
Donato KM, Massey DD. Effect of the Immigration Reform and Control Act on the wages of Mexican migrants. Soc Sci Q. 1993;74:523–41.
Ellis M, Wright R, Townley M, Copeland K. The migration response to the Legal Arizona Workers Act. Polit Geogr. 2014; 42:46–56.
Good M. Do immigrant outflows lead to native inflows? An empirical analysis of the migratory responses to US state immigration legislation. Appl Econ. 2013;45:4275–97.
Hanson GH. Illegal migration from Mexico to the United States. J Econ Lit. 2006;44:869–924.
Hoekstra M, Orozco-Aleman S. Illegal immigration, state law, and deterrence, NBER WP 20801. Cambridge: NBER; 2014. Leerkes A, Leach M, Bachmeier J. Borders behind the border: an exploration of state-level differences in migration
control and their effects on US migration patterns. J Ethnic Migr Stud. 2012;38:111–29. Massey D. Comment: building a better underclass. Demography. 2013;50:1093–5.
O’Neil K. Do local anti-immigration policies slow demographic change? Mimeo: Princeton University; 2011. Orrenius PM, Zavodny M. The effects of tougher enforcement on the job prospects of recent Latin American
immigrants. J Policy Anal Manage. 2009;28:239–57.
Orrenius PM, Zavodny M. The impact of E-Verify mandates on labor market outcomes. Southern Econ J. 2015;81:947–59. Passel JS, Cohn D’Vera. A portrait of unauthorized immigrants in the United States. Pew Research Center: Washington,
D.C. 2009. http://www.pewhispanic.org/2009/04/14/a-portrait-of-unauthorized-immigrants-in-the-united-states/. Accessed 13 January 2015.
Passel JS, Cohn D’Vera, Gonzalez-Barrera A. Net migration from Mexico falls to zero—and perhaps less, Pew Research Center: Washington, D.C. 2012. http://www.pewhispanic.org/2012/04/23/net-migration-from-mexico-falls-to-zero-and-perhaps-less/. Accessed 13 January 2015.
Ramakrishnan SK, Wong T. Partisanship, not Spanish: explaining municipal ordinances affecting undocumented immigrants. In: Varsanyi MW, editor. Taking Local Control: Immigration Policy Activism in U.S. Cities and States. Stanford: Stanford University Press; 2010. p. 73–93.
Ruggles S, Genadek K, Goeken R, Grover J, Sobek M. Integrated Public Use Microdata Series: Version 6.0. Minneapolis: University of Minnesota; 2015.
Warren R. Unauthorized residents in the United States: estimates and public-use data, 2010 to 2013. J Migr Hum Secur. 2014;2:305–28.
Warren R, Warren JR. Unauthorized immigration to the United States: annual estimates and components of change, by state, 1990 to 2010. Int Migr Rev. 2013;47:296–329.
Watson T. Enforcement and immigrant location choice, NBER WP 19626. Cambridge: NBER; 2013.
Submit your manuscript to a
journal and benefi t from:
7 Convenient online submission
7 Rigorous peer review
7 Immediate publication on acceptance
7 Open access: articles freely available online
7 High visibility within the fi eld
7 Retaining the copyright to your article