R E S E A R C H
Open Access
Reliability and validity of the weight status and
dietary intake measures in the COMPASS
questionnaire: are the self-reported measures of
body mass index (BMI) and Canada
’
s food guide
servings robust?
Scott T Leatherdale
*and Rachel E Laxer
Abstract
Background:The COMPASS study is designed to follow a cohort of ~30,000 grade 9 to 12 students attending ~60 secondary schools for four years to understand how changes in school characteristics (policies, programs, built environment) are associated with changes in youth health behaviours. Since the student-level questionnaire for COMPASS (Cq) is designed to facilitate multiple large-scale school-based data collections using passive consent
procedures, the Cqis only comprised of self-reported measures. The present study assesses the 1-week (1wk)
test-retest reliability and the concurrent validity of the Cqmeasures for weight status and dietary intake.
Methods:Validation study data were collected from 178 grade 9 students in Ontario (Canada). At time 1 (T1),
participants completed the Cqand daily recoding of their dietary intake using the web-based eaTracker tool. After
one week, (T2), students completed the Cqagain, participants submitted their daily eaTracker logs and staff
measured their height and weight. Test-retest reliability of the self-reported (SR) weight status and dietary intake measures at T1and T2, and the concurrent validity of the objectively measured and SR weight status and dietary
intake measures at T2were examined using intraclass correlation coefficients (ICC).
Results:Test-retest reliability for SR height (ICC 0.96), weight (ICC 0.99), and BMI (ICC 0.95) are considered
substantial. The concurrent validity for SR height (ICC 0.88), weight (ICC 0.95), and BMI (ICC 0.84) are also considered substantial. The test-retest reliability for SR dietary intake for fruits and vegetables (ICC 0.68) and milk and
alternatives (ICC 0.69) are considered moderate, whereas meat and alternatives (ICC 0.41), and grain products (ICC 0.56) are considered fair. The concurrent validity for SR dietary intake identified that fruits and vegetables (ICC 0.53), milk and alternatives (ICC 0.60), and grain products (ICC 0.41) are considered fair, whereas meat and alternatives (ICC 0.34) was considered slight.
Conclusions:While the test-retest reliability of the measures used in this study were all high, the concurrent validity of the measures was considered acceptable. The results support the use of the self-reported COMPASS weight status and dietary intake measures for use in research where objective measures are not possible.
Keywords:Reliability, Validity, Body mass index, Diet, Food groups, Youth
* Correspondence:[email protected]
School of Public Health and Health Systems, University of Waterloo, 200 University Avenue, Waterloo, ON N2L 3G1, Canada
Background
Age-related increases in obesity and unhealthy eating that occur among youth are cause for concern as they are asso-ciated with increased risk of cardiovascular disease, cancer and diabetes [1-4]. Since overweight, obesity, and poor eating behaviours are prevalent among youth populations [5-7], it is important to promote healthier body weights and eating habits among youth populations.
Excessive weight gain among youth is an ongoing public health problem in Canada. For instance, data from the 2007–09 Canadian Health Measures Survey (CHMS) suggest that among Canadian youth aged 15 to 19, 31% of boys and 26% of girls are overweight or obese [6]. This represents a dramatic populationlevel increase from 25 -years ago where only 14% of boys and 14% of girls were considered overweight or obese [6]. According to the World Health Organization (WHO), adequate fruit and vegetable intake is the most important dietary indicator related to weight management and disease prevention [8]. For optimal health outcomes, the Canada Food Guide makes recommendations for teens aged 14 to 18 years pertaining to daily recommendations for the consumption of fruits and vegetable, grain products, milk and alterna-tives, and meats and alternatives [9]. However, according to the 2010 Canadian Community Health Survey (CCHS), only 48% of males and 50% of females 12 to 19 years of age consumed the recommended five daily servings of fruits and vegetables [10]. Although these national recom-mendations exist, data pertaining to the prevalence of youth meeting these benchmarks for grain products, milk and alternatives, and meats and alternatives are not avail-able in the published literature. A simple tool to measure whether youth are consuming the appropriate number of servings per day for the four food groups could provide valuable insight for stakeholders developing programs or policies to promote healthy eating behaviours.
Since youth spend a large part of their days at school, schools are increasingly tasked with preventing overweight and obesity and promoting healthy eating behaviour among youth populations. However, school stakeholders are not provided with the tools or resources necessary to develop evidence-based programs related to overweight, obesity, and healthy eating [11,12]. The COMPASS study was designed to fill this gap [www.compass.uwaterloo.ca]; it is a longitudinal study (starting in 2012–13) following a cohort of ~30,000 grade 9 to 12 students attending ~60 Ontario secondary schools for four years to understand how changes in school environment characteristics (pol-icies, programs, built environment) are associated with changes in youth health behaviours. COMPASS originated to provide school stakeholders with the evidence to guide and evaluate school-based interventions related to obesity and healthy eating (as well as tobacco use, alcohol and drug use, physical activity and sedentary behaviour, school
connectedness, bullying, and academic achievement). The student-level questionnaire for COMPASS has been de-signed to facilitate multiple large-scale school-based data collections. As such, there were key issues for measuring both weight status and dietary intake that had to be con-sidered when the questionnaire for COMPASS question-naire was developed.
To accurately assess and monitor weight and nutritional status among youth, researchers often rely on retrospect-ive self-reports, requiring the recall of behaviours. While accuracy may be compromised due to recall problems or social desirability bias (i.e., misreporting on sensitive or embarrassing behaviours to appear more favourable) [13], any misreporting is likely to remain consistent over time [14]. This is most important for longitudinal research and tracking youth over time (such as in the COMPASS study). While objective measures of height, weight, and dietary behaviours provide the most accurate and valid results, they are often costly, time consuming, and not feasible for use in large population-based studies [13]. For example, objective measures of height and weight require active consent procedures and the time of a trained re-searcher, while those for dietary behaviours require costly machinery and may be considered invasive and impracti-cal in non-cliniimpracti-cal settings (i.e., doubly labeled water), or are far too tedious and outside the realm for classroom based studies (i.e., 7-day food recall). It is therefore im-portant to develop valid tools to measure self-reported weight status and dietary behaviours (i.e., surveys, ques-tionnaires) that offer the advantage of being quick, inex-pensive, and easy to administer in large samples using passive consent procedures.
The protocol for COMPASS involves active information with passive consent procedures. This ensures representa-tive whole-school samples to inform and evaluate program and policy decisions at the school-level. To facilitate this large-scale data collection, enable fast and accurate pro-cessing of questionnaires, and minimize labour costs and transcription errors, the student-level questionnaire nee-ded to be in a machine-readable format. The use of pas-sive consent and questionnaire processing protocols do not allow for objective measures of height and weight of whole school samples. This is consistent with previous large scale studies using similar methods [11,15,16]. As such, we needed to develop and test the psychometric properties of self-reported height and weight measures to be used in COMPASS.
domain. Within this protocol restriction, it was not pos-sible to use a detailed food frequency questionnaire to measure eating behaviours in COMPASS (i.e., limited to 1-page for measuring dietary intake). The purpose of this study was to assess the 1-week (1wk) test-retest reliability and the concurrent validity of the self-reported COM-PASS questionnaire measures used to determine weight status and dietary intake associated with Canada Food Guide servings.
Methods Data collection
Validation study data were collected using a convenience sample of 178 students in grade 9 from four schools in Southwestern Ontario (Canada). Participants comple-ted the COMPASS questionnaire (Cq) during class time (~30 min) on two separate occasions between September and December 2011. At time 1 (T1), staff administered the Cqin classrooms using a common protocol and standard-ized instructions. Once the Cq was completed, student participants were instructed on the eaTracker food con-sumption diary [17]. eaTracker is a web-based dietary measurement tool developed by the Dieticians of Canada [17]; participants enter detailed information on their daily food and beverage consumption [www.eatracker.ca]. Par-ticipants completed daily food consumption logs using the eaTracker website for seven days following T1. After one week, the Cq was re-administered to the same students (T2). A self-generated code was included on the cover sheet of the Cqto permit accurate tracking of participants
over time. Upon T2completion of the Cqstudy staff veri-fied that all participants completed their daily eaTracker logs and uploaded their data. Each participant’s weight and height were then measured by study staff consistent with existing protocols [18,19]. Students were provided an honorarium of $35 for completing the Cqat T2. Ethics ap-proval was granted by the University of Waterloo Office of Research Ethics and participating school board and school ethics committees.
Measures
Overweight and obesity
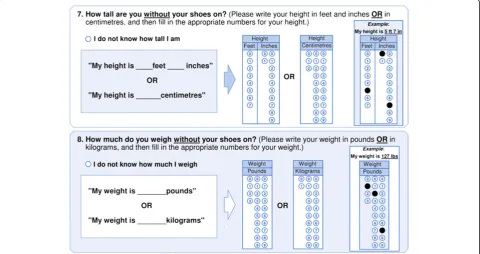
Self-reported height and weight were measured using two questions in the Cq(see Figure 1). The self-reported height and weight items were consistent to those used in the Youth Risk Behavior Survey (YRBS) [18] and the School Health Action, Planning and Evaluation System (SHAPES) [20]. We also provided respondents with both metric and imperial response options and a blank line prefaced by “My weight is ____ pounds/kilograms” and
“My height is ____ inches/centimetres”. Because of the different format of response options from the YRBS, and the preface wording from SHAPES, it was important to establish the test–retest reliability and concurrent vali-dity of the height and weight items used in the Cq. Ob-jective measures of height and weight were taken by study staff. Standing height was objectively measured to the nearest 1 cm with shoes off, feet together, and back against the wall with a horizontal measuring tape. Body weight was measured to the nearest 1 kg using a digital
scale with participants wearing light clothes and no shoes. Body Mass Index (BMI) was calculated for each participant using self-reported and objectively measured body weight (kg) and height (m) (BMI = kg/m2). Overweight and obesity status were then determined using the International Obes-ity Task Force BMI classification system [21] based on age and sex adjusted BMI cut-points. A participant was classi-fied as overweight if their age and sex adjusted BMI cut-point was≥25 and <30 kg/m2, and obese if their age and sex adjusted BMI cut-point was≥30 kg/m2. Students with an age and sex adjusted BMI of 18 < 25 kg/m2were classi-fied as normal weight.
Dietary intake
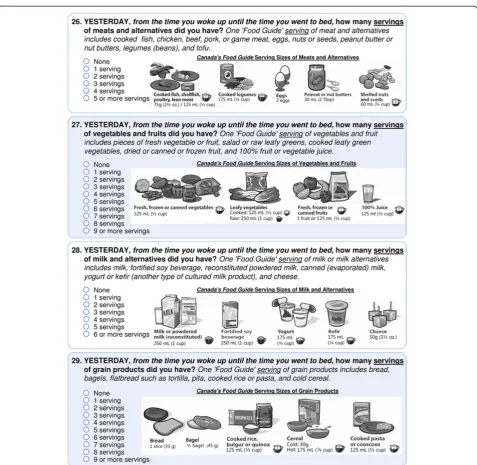
The Cq includes four questions to measure respondent consumption of the four food groups outlined in the Canada Food Guide [9]. Respondents were asked to re-port: “Yesterday, from the time you woke up until the time you went to bed, how many servings of meats and alternatives did you have? One ‘Food Guide’ serving of meat and alternatives includes cooked fish, chicken, beef, pork, or game meat, eggs, nuts or seeds, peanut butter or nut butters, legumes (beans), and tofu;” “Yesterday, from the time you woke up until the time you went to bed, how many servings of vegetables and fruits did you have?One‘Food Guide’serving of vegetables and fruit in-cludes pieces of fresh vegetable or fruit, salad or raw leafy greens, cooked leafy green vegetables, dried or canned or frozen fruit, and 100% fruit or vegetable juice;” “ Yester-day, from the time you woke up until the time you went to bed, how many servings of milk and alternatives did you have?One‘Food Guide’serving of milk or milk alter-natives includes milk, fortified soy beverage, reconstituted powdered milk, canned (evaporated) milk, yogurt or kefir (another type of cultured milk product), and cheese;”and,
“Yesterday, from the time you woke up until the time you went to bed, how many servings of grain products did you have?One‘Food Guide’serving of grain products includes bread, bagels, flatbread such as tortilla, pita, cooked rice or pasta, and cold cereal.” (see Figure 2). Health Canada granted permission for the COMPASS study to use the Canada Food Guide images for the types of servings and serving sizes for food groups sured within the Cq. We used these self-reported mea-sures to determine the number of servings of each food group consumed, and whether the respondents met the recommended number of servings for each food groups as outlined in the Canada Food Guide. Participants are classified as meeting the food guide recommendations based on the following minimum number of servings: meats and alternatives (2 for females, 3 for males), fruits and vegetables (7 for females, 8 for males), milk and al-ternatives (3 for females and males), and grain products (6 for females, 7 for males). The eaTracker online tool
was used to measure daily food consumption. As calcu-lated in eaTracker, the dietary intake scores for Day 6 were used to determine both the total number of serv-ings for each of the four food groups, and whether or not the respondent met the thresholds for the Canada Food Guide recommendations for teens.
Analyses
Conventional descriptive statistics were used for the self-reported and measured weight status and dietary intake measures (examined by sex). Test-retest reliability of the self-reported weight status and dietary intake mea-sures at T1 and T2, and the concurrent validity of the objectively measured and self-reported weight status and dietary intake measures at T2 were examined using intraclass correlation coefficients (ICC). Given gender biases in self-reported height and weight among youth identified in previous research [22], we also examined the concurrent validity of the weight status measures by sex. For the purpose of comparison to previous studies, test-retest reliability and concurrent validity were also determined using Cronbach’s Alpha and Spearman cor-relations for weight status and dietary intake (Spearman correlations were used instead of Pearson correlations since these data were not normally distributed), and weighted Kappa for dietary intake. In order to make our results meaningful and easier to interpret for a broader audience of stakeholders and researchers, correlation rating interpretations [23,24] are also provided to help with the interpretation of the strength of the results presented for our reliability and validity values: ICC (0.00 to 0.10 virtually none, 0.11 to 0.40 slight, 0.41 to 0.60 fair, 0.61 to 0.80 moderate, and 0.81 to 1.0 substan-tial); Spearman correlation (0.10 to 0.30 weak, 0.30 to 0.50 moderate, >0.50 strong); Cronbach’s Alpha (<0.50 unacceptable, 0.50 to 0.59 poor, 0.60 to 0.69 question-able, 0.70 to 0.79 acceptquestion-able, 0.80 to 0.89 good, ≥ 0.90 excellent); and, Kappa statistic (≤0.20 slight, 0.21 to <0.40 fair, 0.40 to <0.60 moderate, 0.60 to <0.80 substan-tial, 0.81 to 1.00 excellent). Means and standard devia-tions for the objectively measured and CqT2self-reported weight status and dietary intake measures were calculated to determine the difference between the self-reported and objective measures and the accuracy (over or under reporting) of the self-reported measures. The statistical package SAS 9.2 was used for all analyses.
Results
Descriptive statistics
data were missing from 30.9% of females (n = 29) and 11.9% of males (n = 10).
Test-retest reliability
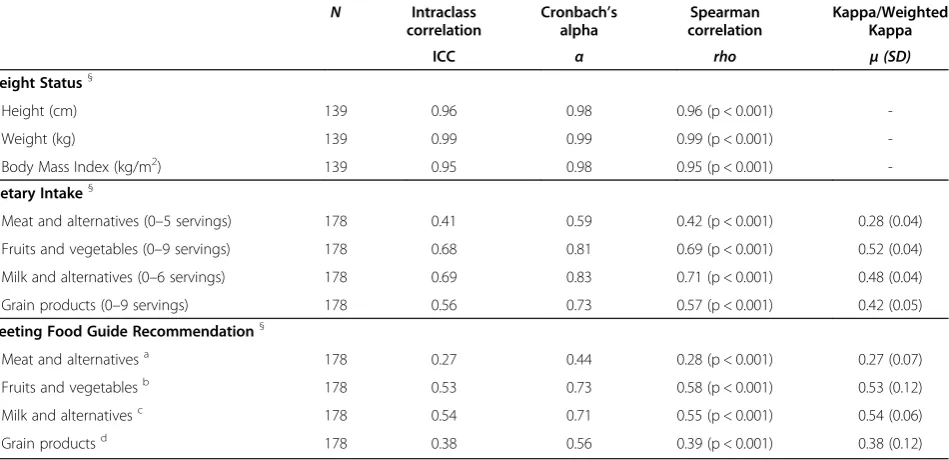
As shown in Table 2, test-retest reliability for self-reported height (ICC 0.96), weight (ICC 0.99), and BMI (ICC 0.95) are considered substantial. The test-retest reliability for self-reported dietary intake for fruits and vegetables (ICC 0.68) and milk and alternatives (ICC 0.69) are considered moderate, whereas meat and alternative (ICC 0.41), and grain products (ICC 0.56) are considered fair. Test-retest reliability for meeting the food guide recommendations
identified that for fruits and vegetables (ICC 0.53) and milk and alternatives (ICC 0.54), the correlations are considered fair, whereas meat and alternative (ICC 0.27), and grain products (ICC 0.38) are considered slight. The strength of the Spearman correlations, Cronbach’s Alpha and Kappa values were consistent with the ICC estimates.
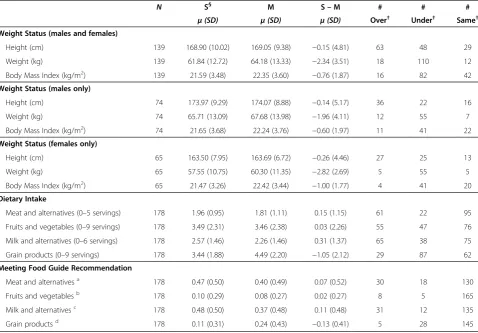
for the whole sample and when examined by sex. For in-stance, on average in the whole sample, weight was underestimated by 2.34 kg, height was underestimated by 1.5 cm, and therefore BMI was also underestimated (by 0.76 kg/m2). For dietary intake, the mean difference in self-reported consumption of grain product was negative (underestimated by 1.04 servings), whereas mean diffe-rences were positive for self-reported consumption of meat and alternatives (overestimated by 0.15 servings) and milk and alternatives (overestimated by 0.31 servings). Although the mean difference in self-reported fruits and vegetables consumption was positive, it was only overestimated by 0.03 servings. Self-reported measures of grain products underestimated the true prevalence of respondents meet-ing the food guide recommendation by 13%, whereas self-reported measures of meat and alternatives and milk and alternatives overestimated the prevalence of respondents meeting the food guide recommendation by 7% and 11%
respectively. Self-reported fruit and vegetable intake only overestimated the prevalence of respondents meeting the food guide recommendation by 2%.
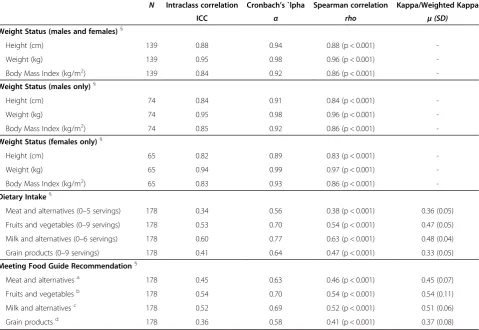
Concurrent validity
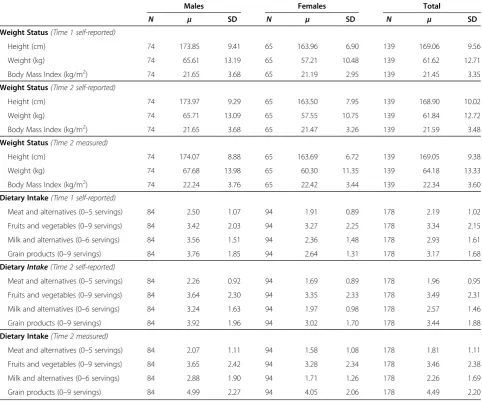
As shown in Table 4, the concurrent validity for self-reported height (ICC 0.88), weight (ICC 0.95), and BMI (ICC 0.84) are considered substantial for the entire sam-ple. Among males, concurrent validity for self-reported height (ICC 0.84), weight (ICC 0.95), and BMI (ICC 0.85) are considered substantial. Similarly, among females, con-current validity for self-reported height (ICC 0.82), weight (ICC 0.94), and BMI (ICC 0.83) are considered substantial. The concurrent validity for self-reported dietary intake identified that fruits and vegetables (ICC 0.53), milk and alternatives (ICC 0.60), and grain products (ICC 0.41) are considered fair, whereas meat and alternative (ICC 0.34) was considered slight. The concurrent validity for meeting Table 1 Means and standard deviations of COMPASS weight status and dietary intake measures
Males Females Total
N μ SD N μ SD N μ SD
Weight Status(Time 1 self-reported)
Height (cm) 74 173.85 9.41 65 163.96 6.90 139 169.06 9.56
Weight (kg) 74 65.61 13.19 65 57.21 10.48 139 61.62 12.71
Body Mass Index (kg/m2) 74 21.65 3.68 65 21.19 2.95 139 21.45 3.35
Weight Status(Time 2 self-reported)
Height (cm) 74 173.97 9.29 65 163.50 7.95 139 168.90 10.02
Weight (kg) 74 65.71 13.09 65 57.55 10.75 139 61.84 12.72
Body Mass Index (kg/m2) 74 21.65 3.68 65 21.47 3.26 139 21.59 3.48
Weight Status(Time 2 measured)
Height (cm) 74 174.07 8.88 65 163.69 6.72 139 169.05 9.38
Weight (kg) 74 67.68 13.98 65 60.30 11.35 139 64.18 13.33
Body Mass Index (kg/m2) 74 22.24 3.76 65 22.42 3.44 139 22.34 3.60
Dietary Intake(Time 1 self-reported)
Meat and alternatives (0–5 servings) 84 2.50 1.07 94 1.91 0.89 178 2.19 1.02
Fruits and vegetables (0–9 servings) 84 3.42 2.03 94 3.27 2.25 178 3.34 2.15
Milk and alternatives (0–6 servings) 84 3.56 1.51 94 2.36 1.48 178 2.93 1.61
Grain products (0–9 servings) 84 3.76 1.85 94 2.64 1.31 178 3.17 1.68
DietaryIntake(Time 2 self-reported)
Meat and alternatives (0–5 servings) 84 2.26 0.92 94 1.69 0.89 178 1.96 0.95
Fruits and vegetables (0–9 servings) 84 3.64 2.30 94 3.35 2.33 178 3.49 2.31
Milk and alternatives (0–6 servings) 84 3.24 1.63 94 1.97 0.98 178 2.57 1.46
Grain products (0–9 servings) 84 3.92 1.96 94 3.02 1.70 178 3.44 1.88
Dietary Intake(Time 2 measured)
Meat and alternatives (0–5 servings) 84 2.07 1.11 94 1.58 1.08 178 1.81 1.11
Fruits and vegetables (0–9 servings) 84 3.65 2.42 94 3.28 2.34 178 3.46 2.38
Milk and alternatives (0–6 servings) 84 2.88 1.90 94 1.71 1.26 178 2.26 1.69
the food guide recommendations identified that meats and alternatives (ICC 0.45), fruits and vegetables (ICC 0.54), and milk and alternatives (ICC 0.52) are considered fair, whereas grain products (ICC 0.36) are considered slight. The strength of the Spearman correlations, Cronbach’s Alpha and Kappa values were consistent with the ICC esti-mates, although the Spearman correlations for dietary intake of meats and alternatives and meeting the food guide rec-ommendation for grain products were considered moderate.
Discussion
Large scale school-based studies aiming to improve youth health behaviours require instruments that are easily administered in large populations, simple to fill out, cost-effective, reproducible, and accurate [11,15,16,20]. How-ever, due to the complexity, cost, and necessity of active consent procedures when objectively measuring health behaviours and weight status of youth populations, objec-tive measures are often not feasible or appropriate. Yet, in order to evaluate school-based programs and policies associated with obesity prevention or dietary intake, re-searchers require measures that provide both reliable esti-mates over time and valid measures of the constructs they intend to change. The present study was designed to assess the test-retest reliability and concurrent validity of self-reported measures of height, weight, and dietary intake within the Cq. We demonstrate that the concise yet simple measures in the Cqprovide reliable and valid mea-sures for collecting self-reported data on weight status
and eating patterns for use in large scale school-based studies.
Reliability of the Cqmeasures
We identified that the Cqself-report measures of weight and height (and the derived measure for BMI) were highly reliable with 1-week test-retest (Cronbach’s Alpha >0.98 for all measures). This is consistent with available evidence from studies examining both 1-week test retest [18] and 2-week test-retest [18] of self-reported height and weight. We also identified that the Cq self-report measures of dietary intake pertaining to the four food groups and meeting Canada’s Food Guide recommenda-tions had sufficient 1-week test-retest reliability. This is consistent with previous research [25-28]. Given that eating patterns and food choices fluctuate day-to-day, it is to be expected that there would be some variability in self-reported dietary behaviours of youth between weeks and days and that reports would not be as robust as for weight status measures [29]. As such, a 50% agreement is considered to be reasonable and sufficient for measur-ing reliability of self-reported dietary intake in youth [29]. And since diets vary daily, a 7-day food record should provide estimates of population means for nutri-ents [30,31] and be sufficient to capture normal eating patterns in the adolescent population. No research had previously examined the reliability or validity of dietary intake measures based on the four food groups outlined in Canada’s Food Guide.
Table 2 Test-retest reliability of the COMPASS weight status and dietary intake measures
N Intraclass correlation
Cronbach’s alpha
Spearman correlation
Kappa/Weighted Kappa
ICC α rho μ(SD)
Weight Status§
Height (cm) 139 0.96 0.98 0.96 (p < 0.001)
-Weight (kg) 139 0.99 0.99 0.99 (p < 0.001)
-Body Mass Index (kg/m2) 139 0.95 0.98 0.95 (p < 0.001)
-Dietary Intake§
Meat and alternatives (0–5 servings) 178 0.41 0.59 0.42 (p < 0.001) 0.28 (0.04)
Fruits and vegetables (0–9 servings) 178 0.68 0.81 0.69 (p < 0.001) 0.52 (0.04)
Milk and alternatives (0–6 servings) 178 0.69 0.83 0.71 (p < 0.001) 0.48 (0.04)
Grain products (0–9 servings) 178 0.56 0.73 0.57 (p < 0.001) 0.42 (0.05)
Meeting Food Guide Recommendation§
Meat and alternativesa 178 0.27 0.44 0.28 (p < 0.001) 0.27 (0.07)
Fruits and vegetablesb 178 0.53 0.73 0.58 (p < 0.001) 0.53 (0.12)
Milk and alternativesc 178 0.54 0.71 0.55 (p < 0.001) 0.54 (0.06)
Grain productsd 178 0.38 0.56 0.39 (p < 0.001) 0.38 (0.12)
§
Self-reported measure at Time 1 and Time 2. a≥
2 servings for females,≥3 servings for males. b
≥7 servings for females,≥8 servings for males. c
≥3 servings for females and males. d
Validity of the Cqmeasures
We identified that the concurrent validity of the Cq self-report measures of weight and height (and the derived measure for BMI) were substantial although discrepancies between self-reported and actual measured height and weight did exist. Consistent with the literature [18,32-35], the Cq measures underestimated weight (by 2.34 kg on average) and subsequently BMI (by 0.76 kg/m2on aver-age). While the average self-reported height was an under-estimate of actual measured height (by only−0.15 cm), the majority of respondents (45% of the sample) actually over-report their height, a finding consistent with the literature [18,32,36,37]. Although relying exclusively on self-reported height and weight measures may provide erroneous esti-mates for overweight and obesity, the Cqderived measure for BMI was similar in robustness to other similar mea-sures [18,20,32,34,38,39], and only underestimated BMI by 0.76 kg/m2. It appears that the Cq measures can provide valid measures of BMI for use in large-scale school-based data collections requiring self-report measures among both
males and females. Moreover, since the Cqis designed for use in a longitudinal study of youth populations (i.e., exam-ining temporal patterns and tracking the same youth over time), any modest biases in the data should remain consist-ent within studconsist-ents over time [14].
Since there is no gold standard to assess dietary beha-viours, determining the validity of a dietary measurement technique must be done in comparison to one that would seemingly capture more accurate measures [40]. Advances in technology and the increased accessibility of the Inter-net allow for the use of web-based alternatives to the 24-hour recall or a demanding food-frequency questionnaire [41,42]. Among youth populations, there are benefits to using an Online tool (i.e., the eaTracker) as a gold standard relative to the traditional food-frequency questionnaires [41,42] as they offer immediate checks for incomplete re-sponses, the opportunity to update consumption of food products at any time throughout the day, and the use of photographs to enhance portion size estimation [41]. The comparison of the Cqdietary intake responses to the online Table 3 Comparison between self-reported (S) and objectively measured (M) weight status and dietary intake
N S§ M S–M # # #
μ(SD) μ(SD) μ(SD) Over† Under† Same†
Weight Status (males and females)
Height (cm) 139 168.90 (10.02) 169.05 (9.38) −0.15 (4.81) 63 48 29
Weight (kg) 139 61.84 (12.72) 64.18 (13.33) −2.34 (3.51) 18 110 12
Body Mass Index (kg/m2) 139 21.59 (3.48) 22.35 (3.60)
−0.76 (1.87) 16 82 42
Weight Status (males only)
Height (cm) 74 173.97 (9.29) 174.07 (8.88) −0.14 (5.17) 36 22 16
Weight (kg) 74 65.71 (13.09) 67.68 (13.98) −1.96 (4.11) 12 55 7
Body Mass Index (kg/m2) 74 21.65 (3.68) 22.24 (3.76) −0.60 (1.97) 11 41 22
Weight Status (females only)
Height (cm) 65 163.50 (7.95) 163.69 (6.72) −0.26 (4.46) 27 25 13
Weight (kg) 65 57.55 (10.75) 60.30 (11.35) −2.82 (2.69) 5 55 5
Body Mass Index (kg/m2) 65 21.47 (3.26) 22.42 (3.44) −1.00 (1.77) 4 41 20
Dietary Intake
Meat and alternatives (0–5 servings) 178 1.96 (0.95) 1.81 (1.11) 0.15 (1.15) 61 22 95
Fruits and vegetables (0–9 servings) 178 3.49 (2.31) 3.46 (2.38) 0.03 (2.26) 55 47 76
Milk and alternatives (0–6 servings) 178 2.57 (1.46) 2.26 (1.46) 0.31 (1.37) 65 38 75
Grain products (0–9 servings) 178 3.44 (1.88) 4.49 (2.20) −1.05 (2.12) 29 87 62 Meeting Food Guide Recommendation
Meat and alternativesa 178 0.47 (0.50) 0.40 (0.49) 0.07 (0.52) 30 18 130
Fruits and vegetablesb 178 0.10 (0.29) 0.08 (0.27) 0.02 (0.27) 8 5 165
Milk and alternativesc 178 0.48 (0.50) 0.37 (0.48) 0.11 (0.48) 31 12 135
Grain productsd 178 0.11 (0.31) 0.24 (0.43) −0.13 (0.41) 5 28 145
§
Self-reported measure at Time 2.
†Values were rounded to 0 decimal places (i.e., 21.59 = 22).
a
≥2 servings for females,≥3 servings for males. b
≥7 servings for females,≥8 servings for males. c
≥3 servings for females and males. d≥
eaTracker data identified that the Cq measures of dietary intake and meeting food guide recommendations demon-strated sufficient validity for use as self-reported measures in a school-based survey tool.
It is difficult to compare the findings in this study to the literature because no other studies have used Canada’s Food Guide (or their international equivalent) to measure dietary behaviours based on food group guidelines. Most validation studies, rather, have made comparisons of eat-ing behaviours in youth to serveat-ings as recommended in Canada’s Food Guide or the American Food Pyramid [25,43], but none have used Canada’s Food Guide itself as the unit of measure. Studies have examined consump-tion of nutrients instead of specific food group items. By assessing patterns of food group consumption, it may be easier to identify the cause of nutrient deficiencies [44] and design appropriate interventions. Studies assessing dietary behaviours may be limited by recall bias. Even pro-vided with food descriptions, it is possible that students will not properly classify their consumption behaviours;
this may be attributed to their difficulty conceptualizing portion sizes [45], or because portion sizes are often not provided in schools, snack bars, or restaurants. This may lead to erroneous estimates of student dietary behaviours since portions are most often overestimated [46]. The Cq questions using Canada’s Food Guide include a brief de-scription of serving sizes and images. The use of food pho-tographs helps in estimating portion sizes and increases the accuracy in estimation compared to unaided estimates [47,48], but only slightly [45]. Therefore responses to questions in the Cq may be more accurate depictions of youth eating behaviours.
There are several limitations to this study. Since this is the first time that these items have been used to measure dietary behaviours, there are no direct comparison studies. Second, the use of Canada’s Food Guide excludes any de-piction in the measures of several food items which may be unhealthy (e.g., there are no specific depictions of oils or fats, or junk food/sugary beverage consumption). As well, youth consuming meals made of several ingredients Table 4 Validity of COMPASS self-reported (S) and objectively measured (M) weight status and dietary intake
measures
N Intraclass correlation Cronbach’s `lpha Spearman correlation Kappa/Weighted Kappa
ICC α rho μ(SD)
Weight Status (males and females)§
Height (cm) 139 0.88 0.94 0.88 (p < 0.001)
-Weight (kg) 139 0.95 0.98 0.96 (p < 0.001)
-Body Mass Index (kg/m2) 139 0.84 0.92 0.86 (p < 0.001)
-Weight Status (males only)§
Height (cm) 74 0.84 0.91 0.84 (p < 0.001)
-Weight (kg) 74 0.95 0.98 0.96 (p < 0.001)
-Body Mass Index (kg/m2) 74 0.85 0.92 0.86 (p < 0.001)
-Weight Status (females only)§
Height (cm) 65 0.82 0.89 0.83 (p < 0.001)
-Weight (kg) 65 0.94 0.99 0.97 (p < 0.001)
-Body Mass Index (kg/m2) 65 0.83 0.93 0.86 (p < 0.001)
-Dietary Intake§
Meat and alternatives (0–5 servings) 178 0.34 0.56 0.38 (p < 0.001) 0.36 (0.05)
Fruits and vegetables (0–9 servings) 178 0.53 0.70 0.54 (p < 0.001) 0.47 (0.05)
Milk and alternatives (0–6 servings) 178 0.60 0.77 0.63 (p < 0.001) 0.48 (0.04)
Grain products (0–9 servings) 178 0.41 0.64 0.47 (p < 0.001) 0.33 (0.05)
Meeting Food Guide Recommendation§
Meat and alternativesa 178 0.45 0.63 0.46 (p < 0.001) 0.45 (0.07)
Fruits and vegetablesb 178 0.54 0.70 0.54 (p < 0.001) 0.54 (0.11)
Milk and alternativesc 178 0.52 0.69 0.52 (p < 0.001) 0.51 (0.06)
Grain productsd 178 0.36 0.58 0.41 (p < 0.001) 0.37 (0.08)
§
Self-reported measure at Time 2 and objective measure taken at Time 2. a
≥2 servings for females,≥3 servings for males. b
≥7 servings for females,≥8 servings for males. c≥
3 servings for females and males. d
may not be able to distinguish or divide meals into its constituent parts. Perhaps the addition of a‘mixed foods’ category will better apportion the nutrients from mixed food products [49] while capturing consumption of cer-tain unhealthy foods. Third, researchers relied on a small convenience sample of grade 9 students (age 14–15) from southwestern Ontario, which may have limited the generalizability of the findings. Fourth, while it would have been ideal to collect test-retest data for a longer period of time [24], the timeframe we used was consistent with other similar validation studies with youth populations in Canada [20,50]. However, there is little reason to believe that high school students in Ontario would respond diffe-rently to the survey than respondents in other jurisdic-tions. And fourth, it is possible that youth consuming foods/meals made up of several ingredients may not be able to distinguish and divide the constituent parts into the different food groups.
Conclusion
Traditional measures of height, weight, and dietary beha-viours are not always feasible for large-scale school-based studies. While the test-retest reliability of the measures used in this study were all high, the validity of the mea-sures was considered acceptable. Despite few limitations, the results support the use of the Cqto obtain proxy mea-sures of weight status and dietary behaviours in youth. This study is the first to contribute information on the use of the food guide for self-reported measures of dietary intake. The role of the four food groups in the Food Guide is well established in Canada, where Canada’s first Food Guide was introduced to the public in 1942 [51]. Compa-ring dietary behaviours to national Food Guide recom-mendations by using the recomrecom-mendations themselves is a novel way to explore and understand the reach of the guidelines and youth dietary behaviours to help guide fu-ture interventions. In addition to identifying reliable and valid measures for future investigation of youth health be-haviours, this study found that youth are not meeting dietary recommendations for achieving health benefits. With knowledge of the weight status and dietary beha-viours of a representative sample of grade nine students, it is possible to guide program and policy development. Pre-liminary data from this validation study stress the urgency for additional policies and programs in schools to improve eating behaviours and reduce the risk of overweight and obesity among youth in Ontario; if eating behaviours re-main as found in this study, youth susceptibility to over-weight and obese will likely increase.
Abbreviations
BMI:Body mass index; Cm: Centimeter; Cq: COMPASS questionnaire;
CCHS: Canadian community health survey; CHMS: Canadian health measures survey; ICC: Intraclass correlation coefficients; Kg: Kilogram; kg/m2: Kilogram
per meter squared; SR: Self-reported; T1: Time 1; T2: Time 2; WHO: World
health organization; YRBS: Youth risk behavior survey; 1wk: One week.
Competing interests
The authors declare that they have no competing interests.
Authors’contributions
SL developed the COMPASS questionnaire, was the principal investigator for the data collection for this study, conceived the manuscript idea, performed the analyses, interpreted the results, and contributed to the writing of the manuscript. RL contributed to the writing of the manuscript and the interpretation of the results. Both authors read and approved the final manuscript.
Acknowledgement
Dr. Leatherdale is a Cancer Care Ontario Research Chair in Population Studies funded by the Ontario Ministry of Health and Long-term Care. This project was supported by an operating grant from the Canadian Institutes of Health Research (CIHR) Institute of Nutrition, Metabolism and Diabetes (INMD) through the“Obesity–Interventions to Prevent or Treat”priority funding awards (OOP-110788; grant awarded to S. Leatherdale). Rachel Laxer is a doctoral student at the University of Waterloo, funded by the CIHR Training Grant in Population Intervention for Chronic Disease Prevention: A Pan-Canadian Program (Grant #: 53893). The authors would also like to thank Chad Bredin (COMPASS study project manager), Dr. Dana Church (COMPASS study recruitment coordinator), and Audra Thompson-Haile (COMPASS school coordinator) for their assistance with this project, and Health Canada who granted COMPASS permission to use food images from Canada’s Food Guide in the COMPASS questionnaire.
Received: 11 January 2013 Accepted: 29 March 2013 Published: 5 April 2013
References
1. Horton ES:Effects of lifestyle changes to reduce risks of diabetes and associated cardiovascular risks: results from large scale efficacy trials.
Obesity2009,17:S43–S48.
2. Heart and Stroke Foundation:A Perfect Storm of Heart Disease Looming on our Horizon, 2010 Heart and Stroke Foundation Annual Report on Canadians’Health. Ottawa ON; 2010.
3. Colditz GA, DeJong W, Hunter D, Trichopoulos D, Willett W:Harvard report on cancer prevention.Cancer Causes Control1996,7:S3–S58.
4. Adami HO, Day NE, Trichopoulos NE, Willett WC:Primary and secondary prevention in the reduction of cancer morbidity and mortality.Eur J Cancer2001,37:S118–S127.
5. Leatherdale ST, Papadakis S:A multi-level examination of the association between older social models in the school environment and overweight and obesity among younger students.J Youth Adolescence2011,
40:361–372.
6. Tremblay M, Shields M, Laviolette M, Craig CL, Janssen I, Connor Gorber S:
Fitness of Canadian Children and Youth: Results from the 2007–2009 Canadian Health Measures Survey.Health Rep2010,21:1–7. 7. American Dietetic Association:Position of the American Dietetic
Association: individual-, family-, school-, and community-based interventions for pediatric overweight.J Am Diet Assoc2006,106:925–945. 8. World Health Organization:Diet, nutrition and the prevention of chronic diseases.
Joint WHO/FAO Expert Consultation on Diet, Nutrition and the Prevention of Chronic Diseases, WHO Technical Report Series (916). Geneva; 2003. 9. Health Canada:Eating Well with Canada’s Food Guide.Minister of Health;
2011. http://www.hc-sc.gc.ca/fn-an/alt_formats/hpfb-dgpsa/pdf/food-guide-aliment/print_eatwell_bienmang-eng.pdf [Accessed June 9, 2012]. 10. Statistics Canada:Fruit and vegetable consumption.2010. http://www.statcan.gc.ca/
tables-tableaux/sum-som/l01/cst01/health89a-eng.htm [Accessed June 16, 2012]. 11. Leatherdale ST, Manske S, Wong S, Cameron R:Integrating research, policy
and practice in school-based physical activity prevention programming: The School Health Action, Planning and Evaluation System (SHAPES) Physical Activity Module.Health Promot Pract2009,10:254–261. 12. Green LW:Public health asks of systems science: to advance our
13. Brener ND, Billy JOG, Grady WR:Assessment of factors affecting the validity of self-reported health-risk behavior among adolescents: evidence from the scientific literature.J Adolesc Health2003,33:436–457. 14. Brener ND, Collins JL, Kann L, Warren CW, Williams BI:Reliability of the
Youth Risk Behavior survey questionnaire.Am J Epidemiol1995,
141:575–580.
15. Elton-Marshall T, Leatherdale ST, Manske SR, Wong K, Ahmed R, Burkhalter R:Research Methods of the Youth Smoking Survey (YSS).Chronic Dis Can 2011,32:47–54.
16. Cameron R, Manske S, Brown KS, Jolin MA, Murnaghan D, Lovato C:
Integrating Public Health Policy, Practice, Evaluation, Surveillance, and Research: The School Health Action Planning and Evaluation System.Am J Public Health2007,97:648–654.
17. Dieticians of Canada:eaTracker - eating and activity tracker.2007. http:// www.eatracker.ca/.
18. Brener N, Mcmanus T, Galuska D, Lowry R, Wechsler H:Reliability and validity of self-reported height and weight among high school students.
J Adolescent Health2003,32:281–287.
19. Fonseca H, Silva AM, Matos MG, Esteves I, Costa P, Guerra A, Gomes-Pedro J:
Validity of BMI based on self-reported weight and height in adolescents.
Acta Paediatr2010,99:83–88.
20. Wong S, Leatherdale ST, Manske S:Reliability and validity of a school-based physical activity questionnaire.Med Sci Sports Exer2006,38:1593–1600. 21. Cole TJ, Bellizzi MC, Flegal KM, Dietz WH:Establishing a standard definition
for child overweight and obesity worldwide: international survey.
Brit Med J2000,320:1–6.
22. Arbour-Nicitopoulos KP, Faulker GE, Leatherdale ST:Learning from non-reported data: interpreting missing Body Mass Index values in young children.Meas Phys Educ Exerc Sci2010,14:241–251.
23. Kline P:The handbook of psychological testing.2nd edition. London: Routledge; 1999.
24. Kolodziejczyk JK, Merchant G, Norman GJ:Reliability and validity of child/ adolescent food frequency questionnaires that assess foods and/or food groups.J Pediatr Gastroenterol Nutr2012,55:4–13.
25. Vereecken CA, Maes L:A Belgian study on the reliability and relative validity of the Health Behaviour in School-Aged Children food-frequency questionnaire.Public Health Nutr2003,6:581–588.
26. Speck B, Bradley C, Harrell J, Belyea M:A food frequency questionnaire for youth: psychometric analysis and summary of eating habits in adolescents.J Adolescent Health2001,28:16–25.
27. Rockett H, Wolf A, Colditz G:Development and reproducibility of a food frequency questionnaire to assess diets of older children and adolescents.J Am Diet Assoc1995,95:336–340.
28. Buzzard IM, Stanton CA, Figueiredo M, Fries EA, Nicholson R, Hogan CJ, Danish SJ:Development and reproducibility of a brief food frequency questionnaire for assessing the fat, fiber, and fruit and vegetable intakes of rural adolescents.J Am Diet Assoc2001,101:1438–1446.
29. Frank G, Nicklas T, Webber L, Major C, Miller J, Berenson G:A food frequency questionnaire for adolescents: defining eating patterns.J Am Diet Assoc1992,92:313–318.
30. Rockett H, Berkey C, Colditz G:Evaluation of dietary assessment instruments in adolescents.Curr Opin Clin Nutr2003,6:557–562. 31. Stang J:Assessment of nutritional status and motivation to make
behavior changes among adolescents.J Am Diet Assoc2002,102:S13–S29. 32. Giacchi M, Mattei R, Rossi S:Correction of the self-reported BMI in a
teenage population.Int J Obes1998,22:673–677.
33. Elgar F, Roberts C, Tudor-Smith C, Moore L:Validity of self-reported height and weight predictors of bias in adolescents.J Adolescent Health2005,
37:371–375.
34. Tsigilis N:Can secondary school students’self-reported measures of height and weight be trusted? An effect size approach.Eur J Public Health2006,16:532–535.
35. Wang Z, Patterson C, Hills A:A comparison of self-reported and measured height, weight and BMI in Australian adolescents.Aust N Z J Public Health 2002,26(5):473–478.
36. Tokmakidis S, Christodoulos A, Mantzouranis N:Validity of self-reported anthropometric values used to assess body mass index and estimate obesity in Greek school children.J Adolescent Health2007,40:305–310. 37. Fortenberry J:Reliability of adolescents’reports of height and weight.
J Adolescent Health1992,13:114–117.
38. Goodman E, Hinden B, Khandelwal S:Accuracy of teen and parental reports of obesity and body mass index.Pediatrics2000,106:52–58. 39. Himes J, Story M:Validity of self-reported weight and stature of American
Indian youth.J Adolesc Health1992,13:118–120.
40. Willet W:Nutritional Epidemiology.New York: Oxford University Press; 1998. 41. Vereecken C, Covents M, Maes L:Comparison of a food frequency
questionnaire with an online dietary assessment tool for assessing preschool children’s dietary intake.J Hum Nutr Diet2010,23:502–510. 42. Baranowski T, Islam N, Baranowski J, Cullen KW, Myres D, Marsh T, de Moor
C:The food intake recording software system is valid among fourth grade children.J Am Diet Assoc2002,102:380–385.
43. Hanning RM, Woodruff SJ, Lambraki I, Jessup L, Driezen P, Murphy CC:
Nutrient intakes and food consumption patterns among Ontario students in grades six, seven, and eight.C J Public Health2007,98:12–16. 44. Millen AE, Midthune D, Thompson FE, Kipnis V, Subar AF:The National
Cancer Institute diet history questionnaire: validation of pyramid food servings.Am J Epidemiol2006,163:279–288.
45. Livingstone M, Robson P, Wallace J:Issues in dietary intake assessment of children and adolescents.Brit J Nutr2004,92:S213–S222.
46. McPherson RS, Hoelscher DM, Alexander M, Scanlon KS, Serdula MK:Dietary assessment methods among school-aged children: validity and reliability.Prev Med2000,31:S11–S33.
47. Foster E:Children’s estimates of food portion size: the development and evaluation of three portion size assessment tools for use with children.
Brit J Nutr2008,99:175–184.
48. Lucas F, Niravong M, Villeminot S, Kaaks R, Clavel-Chapelon F:Estimation of food portion size using photographs: validity, strengths, weaknesses and recommendations.J Hum Nutr Diet1995,8:65–74.
49. Starkey L, Johnson-Down L, Gray-Donald K:Food habits of Canadians: Comparison of intakes in adults and adolescents to Canada’s Food Guide to Healthy Eating.Can J Diet Pract Res2011,62:61–69.
50. Storey KE, McCargar LJ:Reliability and validity of Web-SPAN, a web-based method for assessing weight status, diet and physical activity in youth.
J Hum Nutr Diet2012,25:59–68.
51. Health Canada:Canada’s Food Guides from 1942 to 1992.Minister of Health; 2007. http://www.hc-sc.gc.ca/fn-an/food-guide-aliment/context/fg_history-histoire_ga-eng.php [Accessed March 10, 2013].
doi:10.1186/1479-5868-10-42
Cite this article as:Leatherdale and Laxer:Reliability and validity of the
weight status and dietary intake measures in the COMPASS
questionnaire: are the self-reported measures of body mass index (BMI) and Canada’s food guide servings robust?.International Journal of Behavioral Nutrition and Physical Activity201310:42.
Submit your next manuscript to BioMed Central and take full advantage of:
• Convenient online submission
• Thorough peer review
• No space constraints or color figure charges
• Immediate publication on acceptance
• Inclusion in PubMed, CAS, Scopus and Google Scholar
• Research which is freely available for redistribution