M E T H O D O L O G Y
Open Access
Development of a database and
visualization system integrating various
models of seismic velocity structure and
subducting plate geometry around Japan
Yasuko Yamagishi
1*, Ayako Nakanishi
2, Seiichi Miura
2, Shuichi Kodaira
2and Hide Sakaguchi
1Abstract
To estimate strong ground motions caused by future earthquakes in Japan and to more accurately predict seismic hazards and tsunamis, it is necessary to accurately model the geometry of the subducting plate and the seismic velocity structure around Japan, particularly in offshore areas. Although various seismic velocity structure and plate boundary models have been proposed around Japan, they are all managed individually and differ in extent, data type, and format. Ensuring consistency among those models requires knowledge of their spatial distribution around the subduction zones of Japan. Here, we describe a database system to store and serve various velocity structure and plate geometry datasets from around Japan. Seismic structure models in this database include 3D seismic velocity models obtained by seismic tomography, 3D plate geometry models, 2D seismic velocity structure models, 2D plate geometry models obtained by offshore seismic surveys, and hypocenter distributions determined by offshore observations and the Japan Meteorological Agency. Using this database (currently available only in Japanese), users can obtain data from several structural models at once in the form of the original model data, equal-interval gridded data in a text file, and Keyhole Markup Language (KML) data. Users can grasp the distributions of all available seismic models and hypocenters using a web-based interface, simultaneously view various models and hypocenters as KML output files in Google Earth, and easily and freely handle the structural models in a selected area of interest using the gridded text-file output data. This system will be useful in creating more accurate models of the geometries of the subducting plate and the seismic velocity structure around Japan.
Keywords:Seismic velocity structure, Subducting plate, Database, Visualization, Google Earth, KML
Introduction
The Japanese Islands are in a complex tectonic setting, with the Pacific and Philippine Sea plates subducting beneath Japan from the east and southeast, respectively. Strong ground motions and tsunamis generated by large thrust earthquakes occurring on the subducting plate interfaces cause considerable damage to coastal areas, as illustrated by the 2011 Tohoku earthquake (e.g., Fujiwara et al.2011).
To estimate strong ground motions and predict seismic hazards for such large thrust events, it is necessary to
create accurate models of the geometries of the subduct-ing plates and seismic velocity structure. In preparsubduct-ing the National Seismic Hazard Maps (2017), the Earthquake Re-search Committee, Headquarters for Earthquake ReRe-search Promotion in the Ministry of Education, Culture, Sports, Science and Technology (MEXT) constructed a standard velocity structure model around Japan based on data from Koketsu et al. (2008) and Fujiwara et al. (2009). This model, the Japan Integrated Velocity Structure Model (Koketsu et al.2008), was created to simulate long-period ground motions and their associated seismic hazards. However, large thrust earthquakes often occur in deep off-shore locations in subduction zones, where the velocity structure remains poorly understood because standard velocity structure models are based only on onshore
* Correspondence:[email protected]
1Department of Mathematical Science and Advanced Technology, Japan
Agency for Marine-Earth Science and Technology, 3173-25, Showa-machi, Kanazawa-ku, Yokohama 236-0001, Japan
Full list of author information is available at the end of the article
geophysical and geological data. Nakamura et al. (2015) observed from ocean-bottom data that long-period (10– 20 s) ground motions developed in ocean areas during a moderate (Mw 5.8) earthquake. It is thus necessary to consider the submarine velocity structure, including thick, low-velocity sedimentary layers, in simulations of long-period ground motions and associated seismic haz-ards because long-period ground motions in ocean areas could affect source analyses such as magnitude estimates and finite fault slips.
Various seismic velocity structure models have been constructed for the plate boundaries around Japan, in-cluding crustal structure and tomographic models based on offshore seismic surveys and observations. However, each model is different and managed individually by its constructor organization. It is therefore an opportune time to construct a new and more realistic model of the subducting plate geometry and seismic velocity struc-ture. Integrated plate configuration data based on many seismic studies (Hirose2013) and a visualization system for subsurface structures of Japan (Active Fault Database 2016) are available, although the structural information is of insufficient resolution for offshore application. To produce a fully integrated submarine velocity structure and subducting plate geometry model, we need to know the spatial distribution of the various subordinate models (i.e., 2D and 3D seismic velocity models and plate geometries) and visually compare their hypocentral distributions.
Here, we describe a newly developed database to store the various types of velocity structure and plate geometry data around Japan, available athttp://www.kozo.jishin.go.jp. We introduce the concept, development, and maintenance of this database and provide some examples of its use.
Methods/Experimental
To better understand and conveniently compare sub-marine seismic velocity structure and subducting plate geometry models, we developed a database to store and visualize the various kinds of seismic velocity structure models around Japan. In this section, we first explain the storage of the seismic velocity structure models as data in the database and then describe the development and use of the database.
Data used for database development
We collected published and officially announced 2D vel-ocity structure models and plate geometries along off-shore seismic profile lines, 3D tomographic velocity models, and 3D plate geometries. We prepared four per-mission levels for the data and sources used to construct the database, depending on data availability: (1) only the areal extent of the data and the source reference can be indicated, (2) the data and source reference can be
displayed but not distributed, (3) the data and reference are approved for both display and download, or (4) nothing is provided. For example, option 2 is chosen if the model was only reported in documents issued by governmental institutions.
2D velocity structure models and plate geometries along offshore seismic profile lines were provided by the Univer-sity of Tokyo, Hokkaido UniverUniver-sity, Tokyo UniverUniver-sity of Marine Science and Technology, the Japan Coast Guard, and the Japan Agency for Marine-Earth Science and Tech-nology (JAMSTEC). 3D velocity models estimated by seis-mic tomography and 3D subducting plate geometries were provided by the University of Tokyo, Tohoku Uni-versity, Tokyo Institute of Technology, the Meteorological Research Institute, the National Research Institute for Earth and Disaster Resilience, and JAMSTEC. Hypocen-tral parameters were provided by the Japan Meteorological Agency (JMA) and JAMSTEC. We standardized the for-mat of all models and parameters because their contents, notation systems, and sampling intervals were different depending on the data provider.
Development of the database
In addition to the original data files, our database pro-vides reconstructed 250-m equal-interval gridded data files. We included a function to convert the data into Keyhole Markup Language (KML), an XML-based lan-guage schema for visualizing geographic data in Google Earth. Users can acquire various data files from several models at once, regardless of model type. We con-structed a web-based graphical user interface (GUI) to search the database, display the extent of the data in each model, and retrieve the desired model data.
Database design
We constructed the database as a Java SE 8 application and developed the web GUI so that anyone can access the database via the Internet. The system uses Apache HTTP Server 2.2 and Apache Tomcat 8 as middleware. For searching and processing data, we developed a Java Servlet without a database management system (e.g., MySQL, PostgreSQL). Because the data archiving system uses only a file system (see Table 1), no knowledge of database language (e.g., SQL) is needed for management of the data. Instead, an information file must be created for each kind of model data (including the source refer-ence, file name, and permission level of the data) and uploaded to the parent directory (Table1).
File formats accepted by the database
latitude, longitude, and depth, plus either a seismic vel-ocity (2D and 3D velvel-ocity models), seismic velvel-ocity per-turbation (if available for 3D velocity models), or magnitude and origin time (hypocenter distributions). Except for original data files provided by various insti-tutes, universities, and researchers, the database requires space-delimited plain text files organized for each model type as shown in Table 2. To provide 250-m equal-interval gridded data, the database requires hori-zontal equal-interval grid point data (except for hypo-center distributions); 2D and 3D seismic velocity models further require vertical equal-interval grid point data. For 3D seismic velocity and plate geometry models, the extent of the data is displayed in the web GUI as a rect-angle on the map, in which the existence of blank or dummy data is permitted; thus, the database can accept “incomplete”data within the model extent. For 2D seis-mic velocity and plate geometry models, the data extent is displayed as a profile on the map, and data must exist across the entire profile. In addition to the formatted text file, the database can store original, unprocessed data files for download.
Searching the database
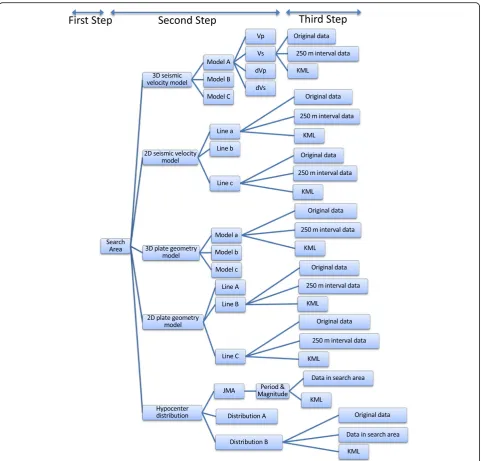
The database can be searched using user-specified pa-rameters (Fig. 1). Users begin by setting the geographic
region of interest as follows: (1) the user sets the geo-graphic coordinates of the start and end points of a pro-file by drawing the propro-file on the Earth’s surface, (2) the user sets the distance from the profile within which they wish to capture data, and (3) a rectangular region is cre-ated from the user-specified parameters (Fig. 2). All models containing data within the rectangular region of interest are searched. The user can then select the de-sired model(s) and output file type; the original data file (depending on permissions), the 250-m equal-interval gridded data file, and the KML file are available for download.
Users can select and acquire data files for 2D seismic velocity models, 2D plate geometry models, and hypo-center distributions simultaneously. However, 3D seis-mic velocity and plate geometry models must be selected individually, and only one data type (seismic velocity, Vp or Vs, and seismic velocity perturbation, dVp or dVs) can be selected at a time for 3D seismic vel-ocity models. Because of their large data volume, when JMA hypocenter distributions are selected as output data, users must further specify a period of occurrence and maximum and minimum magnitudes.
A “ReadMe” file included with the downloaded data files provides the contents of each downloaded data file, the format of the equal-interval gridded data, the refer-ence for the selected model, the user-selected search area, etc. The reference information provides users the method and observational data used to create the ori-ginal model.
Generating 250-m equal-interval gridded data
The equal-interval gridded data files provided by the database are interpolated from the original data at equal horizontal and vertical intervals of 250 m using the bicu-bic method (ignoring the curvature of the Earth) and then written into a text file for output. The 250-m equal-interval data are produced automatically when
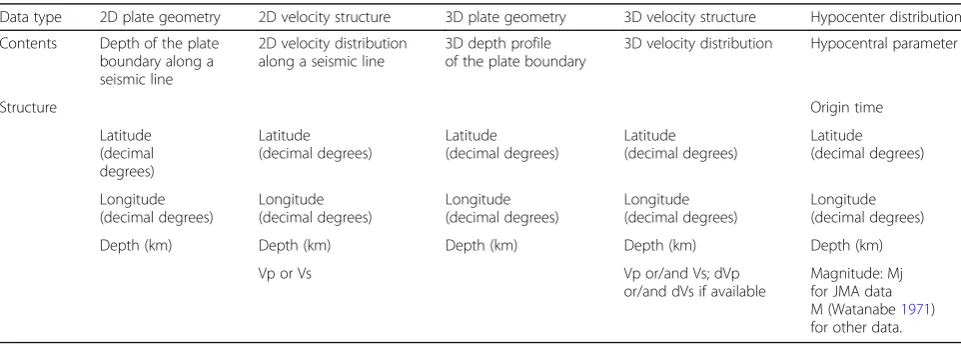
Table 2Data types, contents, and structures required by the database
Data type 2D plate geometry 2D velocity structure 3D plate geometry 3D velocity structure Hypocenter distribution Contents Depth of the plate
boundary along a seismic line
2D velocity distribution along a seismic line
3D depth profile of the plate boundary
3D velocity distribution Hypocentral parameter
Structure Origin time
Latitude (decimal degrees) Latitude (decimal degrees) Latitude (decimal degrees) Latitude (decimal degrees) Latitude (decimal degrees) Longitude (decimal degrees) Longitude (decimal degrees) Longitude (decimal degrees) Longitude (decimal degrees) Longitude (decimal degrees) Depth (km) Depth (km) Depth (km) Depth (km) Depth (km)
Vp or Vs Vp or/and Vs; dVp or/and dVs if available
Magnitude: Mj for JMA data M (Watanabe1971) for other data.
Table 1Structure of the file system used for data archiving
Directory structure Contents
2D seismic velocity and plate geometry models are stored in the database and are regarded as existing in a vertical rectangle. For 3D seismic velocity and plate geometry models, the equal-interval data are produced each time the database is searched; 3D plate geometry models are inter-polated from the original data only within the user-specified search region, whereas only the data in the vertical cross section just beneath the user-specified profile are newly interpolated for 3D seismic velocity models. The equal-interval data are regarded as existing within a rect-angular parallelepiped in 3D seismic velocity models and
are projected onto the Earth’s surface as a horizontal rect-angle in 3D plate geometry models. Grid points containing no data in the projected 3D models are given dummy values of −9999, and new grid points interpolated from dummy values will be passed dummy values of −9999. Dummy data are ignored upon conversion into KML.
Converting equal-interval data to KML
For simultaneous visualization of 2D and 3D seismic velocity structure models in Google Earth, the data-base converts the 250-m equal-interval gridded data
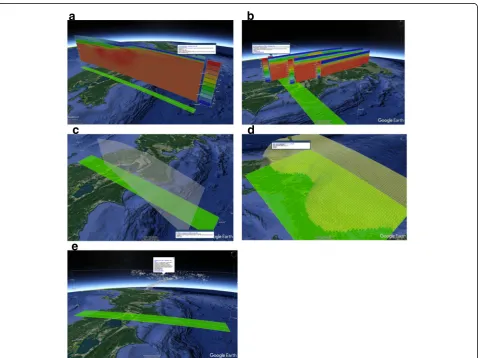
to KML when KML is selected as the output file. For 2D and 3D seismic velocity models, the KML files show vertical cross sections of the seismic velocity (or velocity perturbation in 3D) distributions just beneath the selected profile as color contour maps (Fig. 3a, b). Users can set the minimum and maximum seismic velocity/seismic velocity perturbation values shown by the color scale for 3D velocity models, whereas the maximum and minimum 2D seismic velocities shown by the color scale are 8.5 and 1.5 km/s, respectively. The 2D and 3D seismic velocity color contour maps are composed of polygons colored according to the value of the seismic velocity at each grid point. To minimize the KML file size, polygons are merged if the values of neighboring grids are very close. In Google Earth, the polygons are visible from the front and back; the KML files are thus created such that the south-facing side of the cross section is regarded as the “front” of the color contour map. For 2D plate
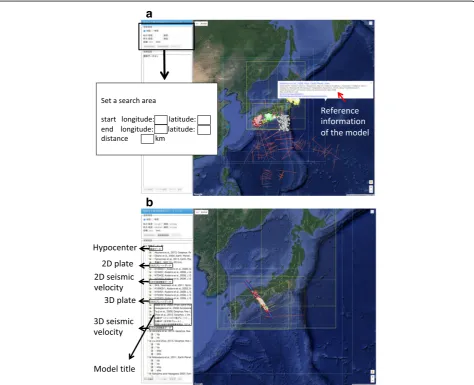
Fig. 2Selection of the search region in the database system. Users input the latitudes and longitudes of points (A) and (B) to draw a profile (red line) and then set the distance from the profile (d) within which to capture model data (green rectangular region).
Alternatively, the search profile can be drawn directly on the map
a
b
c
e
d
Fig. 3Examples of seismic structural model visualizations using Google Earth. The green rectangles on the Earth’s surface show the user-defined search area, and the source references of the models are shown in the white balloons.a3D seismic velocity model (Liu and Zhao2014; Liu et al.
geometry models, the depth to the top of the plate is rep-resented as lines connecting the plate depths (Fig.3c). For 3D plate geometry models, the plate geometry data are converted into KML as an aggregate surface of triangular polygons (Fig. 3d). Hypocenters are displayed as spheres (Fig. 3e). KML placemarks show the source data used in the models; upon clicking the placemark in Google Earth, the source reference appears in a white balloon (Fig. 3). As the Earth’s interior is not visible in Google Earth, the data must be displayed outside of the Earth; the depths of the data are thus converted into altitudes relative to an “imaginary Earth’s surface”altitude defined by the user.
Web GUI
A web-based GUI enables users to easily access the data-base via the Internet (presently only available in Japanese).
A map embedded in the GUI shows the extent of all models in the database (Fig.4a). In this view, source refer-ences can be viewed by clicking the profile line (2D plate geometry and seismic velocity models) or the margin of the bounding box (3D plate geometry and seismic velocity models) of individual models. In the GUI, users can easily adjust the geographic coordinates of the rectangular search region by clicking on the map, and the map is re-drawn showing only the models that include data within the search region (Fig. 4b). For 3D seismic vel-ocity and plate geometry models, the model area is shown by a rectangle, although some blank points may exist within that area. In these cases, the rect-angle represents the maximum extent of the selected data. We developed this web GUI assuming use of the Google Chrome browser.
a
b
Results
Towards the goal of constructing an integrated seismic structural model beneath the Pacific Ocean around Japan, we have developed a database that stores various seismic structural models (obtained by seismic surveys and tomographic analyses) and hypocentral parameters. Using this database, users can (1) acquire various data files from several models at once, regardless of the model type, (2) view the extent of the existing seismic structural models in the web GUI (Fig.4a), and (3) easily visualize the structural data distribution, particularly in the offshore region, by interfacing with Google Earth (Fig. 3). Moreover, by using the original dataset or the gridded data provided by this database, users can analyze individual structural models. Therefore, this database will be useful in creating a better model of the subduct-ing plate and seismic velocity structure around Japan.
Discussion
In this section, we introduce several example applications of the database. We first explain the use of the equal-interval gridded data and then show an example of simultaneous visualization of different seismic velocity models.
At present, the GUI is only available in Japanese. How-ever, we believe that this database will be useful to all re-searchers interested in the seismic velocity structure and subducting plate geometry around Japan. We recognize that this system should be improved in the future to re-spond to users’requests, including an English GUI.
Use of 250-m equal-interval gridded data
The database provides three data output options: (1) the original data files, (2) 250 m equal-interval grid-ded data files, and (3) KML files. The unprocessed original data files are the intact datasets provided by various institutes or researchers; these are different from the formatted input data (text) files accepted by the database. JMA hypocenter data are the exception; the original data files are not provided because of their large volume. The equal-interval data files provide interpolated data gridded horizontally and vertically at 250-m intervals. The 250-m equal-interval data are vided in a vertical section beneath the user-specified pro-file for 3D seismic velocity models or in a rectangular parallelepiped under the user-specified search region for 3D plate geometry models. For 2D seismic velocity and
plate geometry models, the equal-interval data are pro-vided beneath the entire survey line across the search area. Because the original data are often provided as a program or in a unique file format, complicated procedures may be necessary to process different types of original model data. The equal-interval gridded data are space-separated and provided as a plain text file in a simple format summa-rized by the“ReadMe”file so that users can easily analyze or visualize the models in their software of choice. If needed, users can easily convert the equal-interval gridded data to other data formats such as GeoCSV (Stults et al. 2015) or JSON (JavaScript Object Notation) for seismic tomographic data (Postpischl et al.2011).
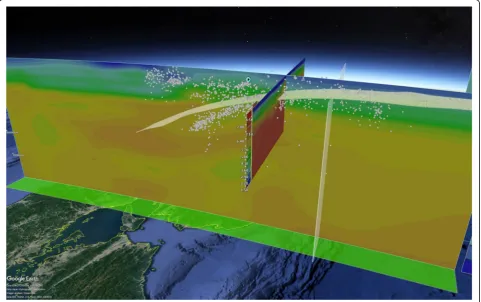
Visualization of seismic structure models
The database provides KML files produced from the 250-m equal-interval data for display in Google Earth. The layer system of Google Earth allows various geographic data to be displayed simultaneously on a virtual globe. Therefore, the database can simultaneously visualize several seismic structure models, regardless of the model types. Figure 5 shows a visual comparison of 3D plate geometry (Nakanishi et al. 2018) and seismic velocity models (Nakajima and Hasegawa 2007), 2D plate geometry and seismic velocity models (Kodaira et al.2006), and hypocentral distributions (Akuhara et al. 2013). Differences between the 3D plate geometry model, 3D seismic velocity model, and hypocen-ters are notable at greater depths; for example, hypocenhypocen-ters located at the subducting slab interface are consistently deeper than the top of the slab in the 3D plate geometry model.
Conclusion
We developed a database system with a web GUI, avail-able at http://www.kozo.jishin.go.jp, to provide seismic structure model data via the Internet. Using this data-base, users can easily obtain various kinds of seismic structure model data and visualize them simultaneously in Google Earth. By interfacing with Google Earth, this database allows users to easily understand the structural data distribution in offshore regions of Japan. This sys-tem also provides 250-m equal-interval gridded data from the desired structural models as a text file, which users can employ to analyze individual models without any complicated data preparation. As a result, we believe that the database will be useful to produce a more accur-ate seismic structure model beneath the Pacific Ocean around Japan.
Abbreviations
GUI:Graphical user interface; JAMSTEC: Japan Agency for Marine-Earth Science and Technology; JMA: Japan Meteorological Agency; KML: Keyhole Markup Language; MEXT: Ministry of Education, Culture, Sports, Science and Technology
Acknowledgements
This study was performed as a“research project for development of seismological information database for modeling seismic velocity structure offshore around Japan”funded by the Ministry of Education, Culture, Sports, Science and Technology (MEXT), Japan. We are grateful to all who have kindly agreed to the incorporation of their models and data into our database. The earthquake catalog used in this study is produced by the JMA in cooperation with MEXT. The catalog is based on seismic data provided by the National Research Institute for Earth Science and Disaster Prevention, JMA, Hokkaido University, Hirosaki University, Tohoku University, the University of Tokyo, Nagoya University, Kyoto University, Kochi University, Kyushu University, Kagoshima University, the National Institute of Advanced Industrial Science and Technology, the Geographical Survey Institute, Tokyo Metropolis, Shizuoka Prefecture, Hot Springs Research Institute of Kanagawa Prefecture, Yokohama City, and JAMSTEC. We are grateful to Riming Zhu (VisCore Co., Ltd.) and Kenji Morimoto (VINAS Co., Ltd.) for their skill in developing this database and the KML data conversion system.
Funding
This study was funded by the Ministry of Education, Culture, Sports, Science and Technology.
Availability of data and materials
All data provided by institutes and researchers for this study is stored in the developed database, available athttp://www.kozo.jishin.go.jp(in Japanese).
Authors’contributions
YY and AN proposed the topic. YY developed the database system. AN investigated existing structural models and coordinated the permissions levels of the data files with the providers. SM and SK helped collect the data files and develop the system. HS contributed to the discussion. All authors read and approved the final manuscript.
Competing interests
The authors declare that they have no competing interests.
Publisher’s Note
Springer Nature remains neutral with regard to jurisdictional claims in published maps and institutional affiliations.
Author details
1Department of Mathematical Science and Advanced Technology, Japan
Agency for Marine-Earth Science and Technology, 3173-25, Showa-machi, Kanazawa-ku, Yokohama 236-0001, Japan.2Research and Development
Center for Earthquake and Tsunami, Japan Agency for Marine-Earth Science and Technology, 3173-25, Showa-machi, Kanazawa-ku, Yokohama 236-0001, Japan.
Received: 18 April 2018 Accepted: 17 August 2018
References
Active Fault Database (2016) National Institute of Advanced Industrial Science and Technology,https://gbank.gsj.jp/subsurface/english/index.html. Accessed 21 Mar 2018
Akuhara T, Mochizuki K, Nakahigashi K, Yamada T, Shinohara M, Sakai S, Kanazawa T, Uehira K, Shimizu H (2013) Segmentation of the Vp/Vs ratio and low-frequency earthquake distribution around the fault boundary of the Tonankai and Nankai earthquakes. Geophys Res Lett 40:1306–1310.https:// doi.org/10.1002/grl.50223
Fujiwara H, Kawai S, Aoi S, Morikawa N, Sennna S, Kudo N, Ooi M, Hao Kx-S, Hayakawa Y, Toyama N, Matsuyama N, Iwamoto L|K, Suzuki H, Ei R (2009) A study on subsurface structure model for deep sedimentary layers of Japan for strong-motion evaluation. Technical note of the National Research Institute for Earth Science and Disaster Prevention, No 337 (in Japanese) Fujiwara T, Kodaira S, No T, Kaiho Y, Takahashi N, Kaneda Y (2011) The 2011
Tohoku-Oki earthquake: displacement reaching the trench axis. Science 334: 1240.https://doi.org/10.1126/science.1211554
Kodaira S, Hori T, Ito A, Miura S, Fujie G, Park J-O, Baba T, Sakaguchi H, Kaneda Y (2006) A cause of rupture segmentation and synchronization in the Nankai trough revealed by seismic imaging and numerical simulation. J Geophys Res 111:B09301.https://doi.org/10.1029/2005JB004030
Kodaira S, Takahashi N, Nakanishi A, Miura S, Kaneda Y (2000) Subducted seamount imaged in the rupture zone of the 1946 Nankaido earthquake. Science 289:104–106.https://doi.org/10.1126/science.289.5476.104.
Koketsu K, Miyake H, Fujiwara H, Hashimoto T (2008) Progress towards a Japan integrated velocity structure model and long-period ground motion hazard map, in Proceedings of the 14th World Conference on Earthquake Engineering: Beijing, China, paper no. S10–038.
Liu X, Zhao D (2014) Structural control on the nucleation of megathrust earthquakes in the Nankai subduction zone. Geophys Res Lett 41:8288–8293.
https://doi.org/10.1002/2014GL062002
Liu X, Zhao D, Li S (2013) Seismic imaging of the Southwest Japan arc from the Nankai trough to the Japan Sea. Phys Earth Planet Inter 216:59–73.https:// doi.org/10.1016/j.pepi.2013.01.003
Nakajima J, Hasegawa A (2007) Subduction of the Philippine Sea slab beneath southwestern Japan: slab geometry and its relationship to arc magmatism. J Geophys Res 112:B08306.https://doi.org/10.1029/2006JB004770
Nakamura T, Takenaka H, Okamoto T, Ohori M, Tsuboi S (2015) Long-period ocean -bottom motions in the source areas of large subduction earthquakes, Scientific Reports 5, Article number: 16648. Doi:https://doi.org/10.1038/ srep16648
Nakanishi A, Takahashi T, Yamamoto Y, Takahashi T, Citak SO, Nakamura T, Obana K, Kodaira S, Kaneda Y (2018) Three-dimensional plate geometry and P-wave velocity models of the subduction zone in SW Japan: Implication for seismogenesis. In: Byrne T, Fisher D, McNeil L, Saffer D, Ujiie K, Underwood M, Yamaguchi A (eds) Geology and tectonics of subduction zones: a tribute to Gaku Kimura. Geological Society of America Special Paper 534 (in press) National Seismic Hazard Maps (2017) Report of Earthquake Research
Committee, Headquarters for Earthquake Research Promotion,https:// www.jishin.go.jp/evaluation/seismic_hazard_map/shm_report/shm_report_ 2017. Accessed 9 Apr 2018
Postpischl L, Danecek P, Morelli A, Pondrelli S (2011) Standardization of seismic tomographic models and earthquake focal mechanisms data sets based on web technologies, visualization with keyhole markup language. Comp Secsci 37:47–56.https://doi.org/10.1016/j.cageo.2010.05.006
Stults M, Arko R A, Davis E, Ertz D J, Turner M, Trabant C M, Valentine Jr D W, Ahem T K, Carbotte S M, Gurnis M, Meertens C, Ramamurthy M K, Zaslavsky L (2015) GeoCSV: tabular text formatting for geoscience data. Abstract IN11F-1809 presented at AGU Fall Meeting 2015, San Francisco, California, 14–18 December 2015.https://agu.confex.com/agu/fm15/webprogram/Paper84142. html. Accessed 8 June 2018