R E S E A R C H
Open Access
Area of the pressure-strain loop during
ejection as non-invasive index of
left ventricular performance: a
population study
Nicholas Cauwenberghs
1, Mahdi Tabassian
2, Lutgarde Thijs
1, Wen-Yi Yang
1, Fang-Fei Wei
1, Piet Claus
2,
Jan D
’
hooge
2, Jan A. Staessen
1and Tatiana Kuznetsova
1*Abstract
Background:Previous studies highlighted the usefulness of integrating left ventricular (LV) deformation (strain) and hemodynamic parameters to quantify LV performance. In a population sample, we investigated the anthropometric and clinical determinants of a novel non-invasive index of LV systolic performance derived from simultaneous registration of LV strain and brachial pressure waveforms.
Methods:Three hundred fifty-six randomly recruited subjects (44.7% women; mean age, 53.9 years; 47.5%
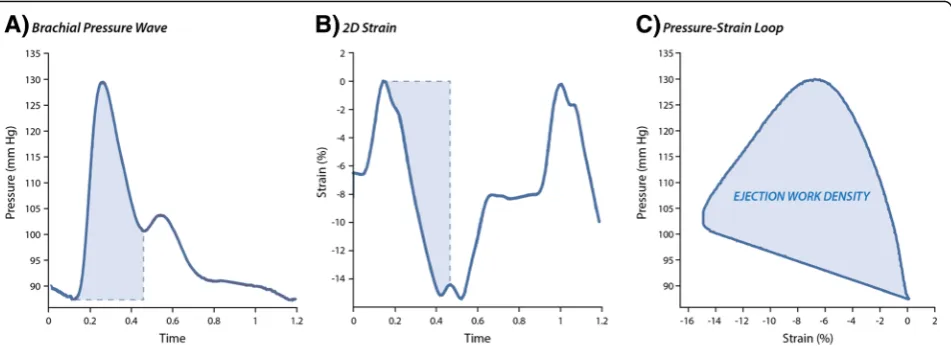
hypertensive) underwent echocardiographic and arterial data acquisition. We constructed pressure-strain loops from simultaneously recorded two-dimensional LV strain curves and brachial pressure waveforms obtained by finger applanation tonometry. We defined the area of this pressure-strain loop during ejection as LV ejection work density (EWD). We reported effect sizes as EWD changes associated with a 1-SD increase in covariables.
Results:In multivariable-adjusted analyses, higher EWD was associated with age, female sex and presence of hypertension (P≤0.0084). In both men and women, EWD increased independently with augmentation pressure (effect size: + 59.1 Pa), central pulse pressure (+ 65.7 Pa) and pulse wave velocity (+ 44.8 Pa;P≤0.0006). In men, EWD decreased with relative wall thickness (−29.9 Pa) and increased with LV ejection fraction (+ 23.9 Pa;P≤0.040). In women, EWD increased with left atrial (+ 76.2 Pa) and LV end-diastolic (+ 43.8 Pa) volume indexes and with E/e’ ratio (+ 51.1 Pa;P≤0.026).
Conclusion:Older age, female sex and hypertension were associated with higher EWD. Integration of the LV
pressure-strain loop during ejection might be a useful tool to non-invasively evaluate sex-specific and interdependent effects of preload and afterload on LV myocardial performance.
Keywords:Echocardiography, Hypertension, Ventricular-arterial coupling, Longitudinal strain, Ejection work density
Background
The performance of the left ventricle (LV) is determined by its intrinsic contractility (inotropy), by the tension on the LV wall at end-diastole (preload) and by the load against which the LV needs to eject blood (afterload) [1]. If myocardial and vascular properties are matched, the
heart can adequately respond to changes in pre- and afterload and regulate cardiac output and blood pressure (BP). However, the adaptive response to increased after-load appears impaired in patients with chronic hyperten-sion [2] and with symptomatic heart failure [2,3].
In line, community-based studies demonstrated the detrimental impact of increased afterload on LV struc-ture and function [4–7]. Indeed, a long-term increased afterload and, consequently, a chronically increased car-diac performance lead to adverse LV maladaptation and increased LV oxygen requirements [8]. In particular,
© The Author(s). 2019Open AccessThis article is distributed under the terms of the Creative Commons Attribution 4.0 International License (http://creativecommons.org/licenses/by/4.0/), which permits unrestricted use, distribution, and reproduction in any medium, provided you give appropriate credit to the original author(s) and the source, provide a link to the Creative Commons license, and indicate if changes were made. The Creative Commons Public Domain Dedication waiver (http://creativecommons.org/publicdomain/zero/1.0/) applies to the data made available in this article, unless otherwise stated.
* Correspondence:[email protected]
1Research Unit Hypertension and Cardiovascular Epidemiology KU Leuven Department of Cardiovascular Sciences, University of Leuven, Leuven, Belgium
older women appear susceptible to the detrimental effects of increased pulsatile load on LV diastolic function [4,6,7], which might be explained by the higher aortic stiffness, en-hanced LV systolic performance, higher preload sensitivity and lower LV compliance in women as in men [9].
Echocardiographic techniques such as two-dimensional (2D) speckle tracking allow quantification of the relative myocardial deformation (i.e. strain) [10]. Furthermore, LV strain and arterial function can be assessed simultaneously in a non-invasive way [11]. In fact, recent developments in construction and quantification of pressure-strain loops illustrates the pressing need for a non-invasive, clinical tool that integrates both LV deformation and its loading conditions [2,12]. Several indexes derived from these sim-ultaneous recordings were suggested to reflect the inter-action between the heart and the arteries (i.e. ventricular-arterial coupling, VAC) [2,12]. For instance, we previously constructed LV pressure-strain loops from simultaneously recorded LV strain curves and carotid pressure waveforms, and defined the area of these loops during ejection as the LV ejection work density (EWD) [2].
In fact, EWD might better reflect LV systolic perform-ance than peak LV deformation, as it integrates the in-stantaneous deformation as well as the inin-stantaneous afterload against which the myocardium has to shorten [2, 11]. However, we should better understand this LV performance index before evaluating its utility in clinical decision-making. Therefore, we investigated in a popula-tion sample the anthropometric and clinical determi-nants of EWD. We also explored the relationship of EWD with indexes reflecting LV structure, LV diastolic function and arterial stiffness.
Materials and methods Study participants
The Flemish Study on Environment, Genes and Health Outcomes (FLEMENGHO) was approved by the Ethics Committee of the University of Leuven. We randomly recruited a family-based population sample in northern Belgium as described before [5]. All subjects provided written informed consent. Between 2011 and 2016, we performed a VAC protocol including simultaneous echo-cardiography and finger applanation tonometry in 405 participants. We excluded 49 subjects from statistical analysis because of a history of myocardial infarction or ischemic heart disease (n = 14), atrial fibrillation (n= 4) or symptomatic heart failure (n = 1), or because of insuf-ficient quality of the echocardiograms (n = 6) or finger pressure waves (n = 24). In total, we thus analysed data from 356 participants.
Echocardiography
Echocardiography and arterial phenotyping were per-formed after the subject had rested for at least 15 min in
supine position. Details on the echocardiography, arterial phenotyping and other measurements are provided as Data Supplement.
Data acquisition - Briefly, one experienced physician (T.K.) did the ultrasound examination using a Vivid E9 (GE Vingmed, Norway) interfaced with a 2.5- to 3.5-MHz phased-array probe, in accordance to recommendations [13] and previous reports [5].
During echocardiography, we recorded continuous fin-ger pressure waves at the subject’s right middle-finger using a Finometer Pro (Finapres Medical Systems, The Netherlands), which were converted to brachial pressure curves by a validated transfer function implemented in the Finometer software [14].
Off-line analysis - One observer (TK) analyzed the echocardiograms using EchoPac software (GE Vingmed). End-diastolic LV dimensions were used to calculate rela-tive wall thickness (RWT) and LV mass. We measured transmitral peak early (E) and late (A) diastolic velocities as well as early (e’) and late (a’) diastolic peak mitral annular velocities at 4 acquisition sites (septal, lateral, inferior and posterior). The E/e’ratio, a surrogate of LV filling pressure, was transmitral E peak divided by e’ averaged from the 4 acquisition sites. Two observers (N.C and T.K.) measured LV global longitudinal strain (LS) using myocardial speckle-tracking software (Q-analysis, GE Vingmed) as described before [15]. We used peak systolic, mid-wall global LS for statistical analysis. Additional file1: Figure S1 shows the relative inter-obser-ver variability of individual segmental LS values.
VAC analysis– We post-processed the simultaneously recorded LV deformation curves and pressure waves using a custom Matlab algorithm (The MathWorks, Inc., USA). The performance of the software was validated in 50 subjects using intermediate and final quality check-points and is available upon request from the corre-sponding author (Additional file 1: Figure S2). First, we constructed pressure-strain loops by plotting the cali-brated brachial pressure wave against the global LS curve (Fig. 1). Next, we calculated EWD as the area of the pressure-strain loop during LV ejection, representing the cumulative work density on the muscle that instant-aneously shortens a given amount (i.e. change in strain) against an instantaneous pressure (Fig. 1) [2]. We averaged EWD from apical 4 and 2 chamber views (Additional file 1: Figure S3). We additionally included the average EWD standardized by RWT in sensitivity analyses to better account for LV wall stress.
Arterial measurements
were calibrated by the supine brachial BP measured imme-diately before tonometry. From radial signals, SphygmoCor software constructed the aortic (central) pulse wave using a validated generalized transfer function. Central pulse pressure (PP) was central systolic minus diastolic pressure. Augmentation pressure (AP) was the pressure difference between the first and second shoulder of the central wave-form. In 157 men and 117 women, we measured aortic pulse wave velocity (PWV), the non-invasive gold standard of arterial stiffness, as the carotid-femoral distance divided by the carotid-femoral pressure transit time [16].
Other measurements
Conventional BP was the average of 5 auscultatory read-ings obtained with the subject in seated position. Hyper-tension was defined as a BP of at least 140 mmHg systolic or 90 mmHg diastolic or the use of antihyperten-sive drugs. Participants on antihypertenantihyperten-sive therapy were defined as having either uncontrolled (BP > 140/90) or controlled (BP≤140/90) hypertension. Diabetes mellitus was determined by self-report, a fasting glucose level of at least 126 mg/dL, or the use of antidiabetic agents.
Statistical analysis
We used SAS software v9.4 (SAS Institute, Cary, NC) for database management and statistical analysis. We compared means and proportions using a large sample z-test and χ2-test, respectively. Statistical significance was a two-sidedP value < 0.05. Using mixed models, we assessed multivariable-adjusted associations of EWD with anthropometric and clinical characteristics, he-modynamics, arterial stiffness and echocardiographic in-dexes of LA volume index (LAVi) and LV structure and function. All models were adjusted for age, sex, heart rate and body height and weight, and accounted for
family clusters modelled as a random effect. We re-ported multivariable-adjusted regression coefficients for EWD per 1-SD increase in the covariable. We repeated regression analyses for men and women separately.
Results
Characteristics of participants
The 356 participants (44.7% women) included 169 (47.5%) hypertensive subjects, of whom 92 (54.4%) were on antihypertensive drug treatment. Mean age was 53.9 ± 13.7 years. Tables 1and 2 list the clinical, arterial and echocardiographic characteristics of the study cohort by sex. EWD averaged 635.8 ± 179.6 Pa in men and 782.3 ± 224.7 Pa in women (P< 0.0001; Table2).
Anthropometric and clinical determinants of EWD
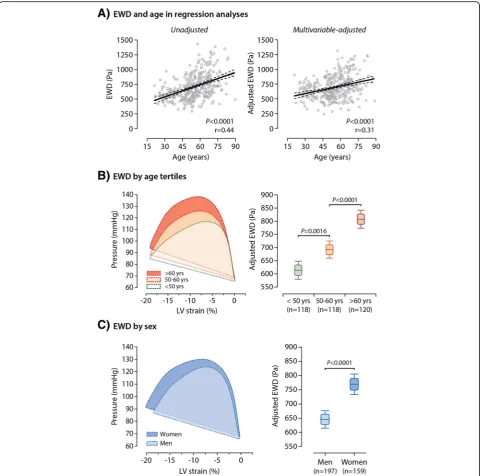
EWD increased significantly with age in both unadjusted and multivariable-adjusted analyses (P < 0.0001; Fig.2a). As shown in Fig. 2b, the pressure-strain loop extended greater along the pressure axis with only little fluctu-ation in peak global LS in older subjects as compared to younger ones. We observed similar age-related changes in pressure-strain loop and EWD in both men and women (Additional file1: Figure S4).Of note, EWD was higher in postmenopausal than in premenopausal women (P< 0.0001; Additional file1: Figure S5).
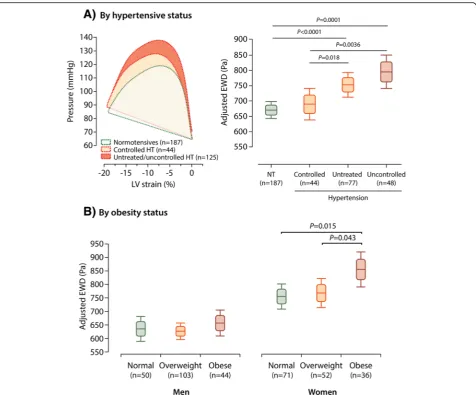
On average, after adjustment for age, heart rate and body size, the pressure-strain loop area during ejection was in its entirety broader in women than in men (Fig. 2c). Hence, averaged EWD was significantly higher in women as com-pared to men (P< 0.0001; Fig. 2c). Furthermore, adjusted EWD was significantly greater in participants whose hyper-tension was either untreated (P = 0.018) or uncontrolled (P = 0.0036) as compared to subjects with controlled hypertension (Fig. 3a). Of note, EWD did not differ
between normotensives and subjects with controlled hypertension (P= 0.49; Fig.3a).
After full adjustment, EWD decreased with the use of β-blockers (−65.4 Pa;P = 0.046), but was not related to the use of ACE-inhibitors/ARBs, calcium channel blockers or diuretics (P ≥0.51). In addition, after accounting for sex and age, EWD was significantly higher in obese than in non-obese women (P≤0.043; Fig.3b). In both unadjusted and fully-adjusted analysis, EWD was not associated with heart rate (P≥0.23) or with smoking (P≥0.22).
Our findings were consistent for the 4 and 2 chamber EWDs analyzed separately (data not shown).
Associations of EWD with arterial hemodynamics and stiffness
Table3presents the overall and sex-specific multivariable-adjusted estimates (95% CI) for EWD associated with a 1-SD increase in hemodynamic and arterial indexes.
As expected, in multivariable-adjusted analyses, higher EWD was independently related to higher systolic (effect size: + 95.2 Pa) and diastolic BP (+ 37.2 Pa;P ≤0.0003) as well as to higher brachial PP (+ 82.1 Pa) and mean arterial pressure (MAP; + 69.6 Pa;P< 0.0001). Moreover, after full adjustment, EWD increased with higher AP (+ 59.1 Pa), central PP (+ 65.7 Pa) and PWV (+ 44.8 Pa; P ≤0.0006; Table 3; Additional file 1: Figure S6). We also observed that EWD increased stronger with higher brachial PP and MAP in women than in men (Table3; Pint≤0.043).
We confirmed the associations between EWD and ar-terial characteristics in a sensitivity analysis excluding
Table 1Clinical characteristics of 356 participants by sex
Characteristic Men (n= 197) Women (n= 159) Pvalue
Anthropometrics
Age, y 53.2 ± 14.6 54.8 ± 12.5 0.27
Body mass index,
kg/m2 27.3 ± 3.56 26.5 ± 4.32 0.060
Systolic BP, mm Hg 131.6 ± 14.8 129.3 ± 17.3 0.18
Diastolic BP, mm Hg 85.3 ± 9.33 81.4 ± 8.85 < 0.0001
Pulse pressure, mm Hg 46.3 ± 12.8 48.0 ± 13.8 0.23
Mean arterial pressure, mm Hg
100.7 ± 9.72 97.4 ± 10.5 0.0020
Heart rate, bpm 58.5 ± 8.98 60.6 ± 8.71 0.026
Questionnaire data
Current smoking, n (%) 31 (15.7) 31 (19.5) 0.35
Drinking alcohol, n (%) 119 (60.4) 37 (23.3) < 0.0001
Hypertensive, n (%) 100 (50.8) 69 (43.4) 0.17
Treated for hypertension, n (%)
54 (27.4) 38 (23.9) 0.45
β-blockers, n (%) 25 (12.7) 18 (11.3) 0.69 ACE or ARB, n (%) 26 (13.2) 10 (6.3) 0.032
CCB, n (%) 18 (9.1) 7 (4.4) 0.082
Diuretics, n (%) 18 (9.1) 16 (10.1) 0.77
History of diabetes, n (%)
8 (4.1) 8 (5.0) 0.66
Biochemical data
Serum creatinine,
μmol/L
81.6 ± 13.0 66.2 ± 17.9 < 0.0001
Total cholesterol, mmol/L
4.84 ± 0.93 5.28 ± 0.96 < 0.0001
Serum insulin,μmol/L 5.20 (2.20–12.0) 4.67 (2.00–10.7) 0.10
Values are mean (±SD), number of subjects (%) or median (10–90% percentile interval).ACEindicates angiotensin-converting enzyme,ARBangiotensin-receptor blockers,bpmbeats per minutes,CCBcalcium channel blockers
Table 2Arterial and echocardiographic characteristics of 356 participants by sex
Characteristic Men (n= 197) Women (n= 159) Pvalue
Arterial characteristics
AP, mm Hg 10.3 ± 8.00 15.3 ± 9.55 < 0.0001
Central PP, mm Hg 40.3 ± 12.1 44.5 ± 14.3 0.0059
PWV, m/sa 8.18 ± 1.90 7.94 ± 1.94 0.30
LV end-diastolic dimensions
Internal diameter, cm 5.27 ± 0.40 4.85 ± 0.35 < 0.0001
Septal wall thickness, cm
1.05 ± 0.13 0.92 ± 0.12 < 0.0001
Posterior wall thickness, cm
0.99 ± 0.11 0.88 ± 0.094 < 0.0001
Relative wall thickness 0.39 ± 0.053 0.37 ± 0.043 0.0041
LV mass index, g/m2 101.9 ± 20.8 86.2 ± 15.4 < 0.0001
Echocardiographic volumes
LA volume index, ml/m2
28.0 ± 8.46 26.1 ± 6.70 0.021
LV EDV index, ml/m2 55.9 ± 9.42 46.6. ± 8.12 < 0.0001
LV ESV index, ml/m2 23.0 ± 4.57 18.3 ± 3.83 < 0.0001
LV Stroke volume, ml 66.4 ± 13.6 50.0 ± 11.7 < 0.0001
LV Ejection fraction, % 58.9 ± 4.99 60.7 ± 5.11 0.0010
LV diastolic function
E peak, cm/s 63.1 ± 13.9 69.3 ± 14.9 < 0.0001
A peak, cm/s 55.3 ± 14.1 63.0 ± 15.4 < 0.0001
E/A ratio 1.22 ± 0.44 1.18 ± 0.44 0.33
e’peak, cm/s 9.97 ± 3.29 10.0 ± 3.15 0.94
a’peak, cm/s 9.76 ± 2.09 9.31 ± 1.88 0.036
E/e’ratio 6.76 ± 1.87 7.42 ± 2.32 0.0038
LV strain
Global LS 18.5 ± 1.84 20.3 ± 1.87 < 0.0001
Ejection work density
EWD, Pa 635.8 ± 179.6 782.3 ± 224.7 < 0.0001
EWD / RWT, Pa 1665.2 ± 498.4 2109.1 ± 592.1 < 0.0001
Values are mean (±SD).a
Data on arterial stiffness was available in 157 men and 117 women. AP indicates augmentation pressure,EDVend-diastolic volume,ESV
subjects on antihypertensive treatment (Additional file1: Table S1). In addition, EWD standardized by RWT in-creased with all brachial and central BP components (P ≤0.011), but not with PWV (P = 0.13; Additional file 1: Table S2).
Associations between EWD and LV structure and function We determined the overall and sex-specific multivariable-adjusted estimates (95% CI) for EWD associated with
a 1-SD increase in echocardiographic indexes reflect-ing LA and LV geometry (Table 4) and LV diastolic function (Table 5).
EWD in relation to LA and LV geometry
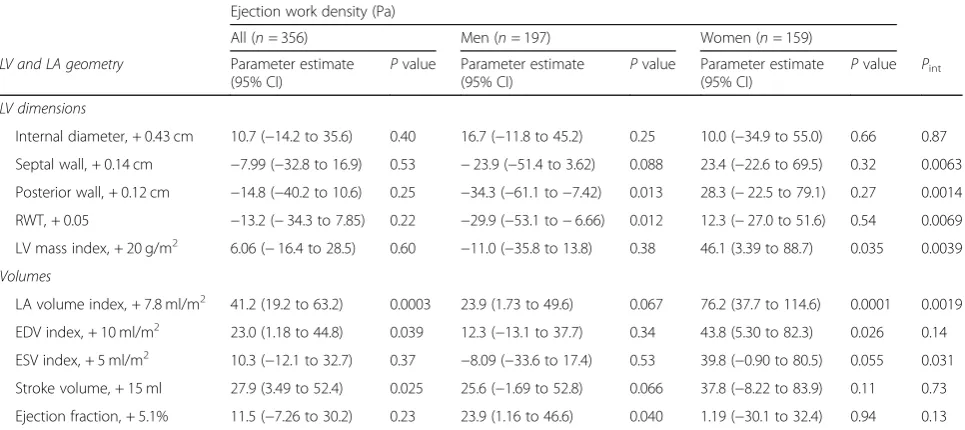
In all subjects, EWD significantly increased with LAVi (+ 41.2 Pa), end-diastolic volume index (EDVi; + 23.0 Pa) and LV stroke volume (+ 27.9 Pa) after full adjustment (P ≤0.039 for all; Table4). EWD decreased significantly
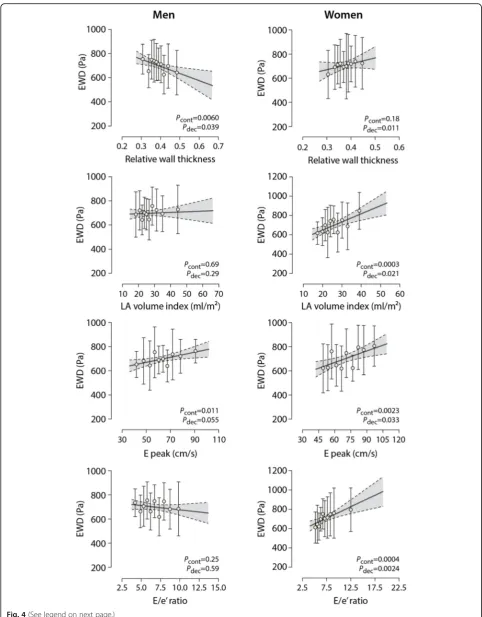
with increased LV posterior wall thickness (−34.3 Pa) and RWT (−29.9 Pa) only in men (P ≤0.013; Table 4; Fig. 4). In contrast, EWD increased significantly with higher LV mass (+ 46.1 Pa), LAVi (+ 76.2 Pa) and EDVi (+ 43.8 Pa) only in women (P≤0.035; Table4;Fig.4).
We confirmed these associations when excluding sub-jects receiving antihypertensive drug therapy (Additional file1: Table S3).
Similarly, when standardizing by RWT, EWD in-creased with higher LAVi, EDVi and end-systolic volume index (ESVi) and stroke volume (P ≤0.012; Additional file1: Table S4).
EWD in relation to LV function
Elevated EWD correlated independently to greater early (+ 55.3 Pa) and late (+ 47.2 Pa) diastolic transmitral peak velocities (P ≤0.0005; Table 5). After full adjustment,
EWD related directly with the E/e’ ratio (+ 32.1 Pa; P = 0.0062; Table 5). However, in sex-specific analyses, this relationship was only observed in women (Fig. 4). EWD correlated directly with peak global LS in both men and women (+ 65.4 Pa; P < 0.0001).
We confirmed these associations when excluding subjects on antihypertensive drug treatment (Additional file 1: Table S5). Standardized by RWT, EWD increased independently with transmitral velocities, E/A ratio and e’peak (P≤0.027 for all; Additional file1: Table S4). Discussion
Here, we investigated the anthropometric and clinical de-terminants of a novel index of LV myocardial performance as derived from non-invasive, simultaneous pressure-strain recordings. In addition, we explored its relation to arterial stiffness and LV function and structure. The key
findings of our study were as follows: (i) older age, female sex and hypertensive status are associated with higher EWD; (ii) in both men and women, EWD increased with steady and pulsatile BP components and arterial stiffness; and (iii) EWD decreased independently with LV wall thickness in men, yet increased with higher LAVi and LV filling pressure (E/e’ratio) in women only.
LV performance is determined by its intrinsic con-tractility (inotropy), by the tension on the LV myocar-dium at end-diastole (preload) and by the load against
which the LV needs to contract to eject blood (afterload) [1]. Within this context, the work density at which the LV generates a stroke volume against a given afterload might be represented by the area of the LV pressure-strain loop during ejection (i.e. EWD). Indeed, EWD integrates the instantaneous LV deformation against an instantaneous pressure and might thus reflect LV systolic performance [2,11].
Numerous population studies demonstrated the detri-mental impact of a chronically increased afterload on LV
Table 3Multivariable-adjusted associations of ejection work density with blood pressure components and arterial properties
Ejection work density (Pa)
All (n= 356) Men (n= 197) Women (n= 159)
Parameter estimate (95% CI)
Pvalue Parameter estimate (95% CI)
Pvalue Parameter estimate (95% CI)
Pvalue Pint
Conventional (brachial) BP
Systolic BP, + 16 mmHg 95.2 (76.8 to 113.6) < 0.0001 82.8 (58.6 to 107.0) < 0.0001 102.8 (74.7 to 130.9) < 0.0001 0.074
Diastolic BP, + 9.5 mmHg 37.2 (17.0 to 57.4) 0.0003 28.0 (3.93 to 52.1) 0.023 52.3 (18.3 to 86.3) 0.0028 0.096
Pulse pressure, + 13 mmHg 82.1 (63.9 to 100.3) < 0.0001 66.3 (43.2 to 89.4) < 0.0001 94.2 (65.2 to 123.3) < 0.0001 0.028
MAP, + 10 mmHg 69.6 (50.8 to 88.4) < 0.0001 57.4 (33.6 to 81.1) < 0.0001 81.9 (52.4 to 111.5) < 0.0001 0.043
SphygmoCor indexes
AP, + 9 mmHg 59.1 (31.5 to 86.6) < 0.0001 74.3 (33.2 to 115.2) 0.0005 50.0 (12.3 to 87.7) 0.0098 0.42
Central PP, + 13 mmHg 65.7 (44.9 to 86.4) < 0.0001 65.3 (37.4 to 93.2) < 0.0001 62.5 (31.5 to 93.6) 0.0001 0.33
PWV, 1.9 m/sa 44.8 (19.5 to 70.1) 0.0006 39.1 (7.87 to 70.3) 0.015 44.0 (1.82 to 86.2) 0.041 0.47
The parameter estimates (95% confidence interval) indicate the change in EWD per 1 standard deviation increase in arterial index. All parameter estimates accounted for the variance explained by age, sex, heart rate and body height and weight. AP, central PP and PWV were additionally adjusted for MAP. Pint
indicates thePvalues for an interaction between each arterial index and sex in predicting EWD.a
Data on arterial stiffness was available in 157 men and 117 women.APindicates augmentation pressure,BPblood pressure,MAPmean arterial pressure,PPpulse pressure,PWVpulse wave velocity
Table 4Multivariable-adjusted associations between ejection work density and echocardiographic indexes of left atrial and left ventricular geometry
Ejection work density (Pa)
All (n= 356) Men (n= 197) Women (n= 159)
LV and LA geometry Parameter estimate
(95% CI)
Pvalue Parameter estimate (95% CI)
Pvalue Parameter estimate (95% CI)
Pvalue Pint
LV dimensions
Internal diameter, + 0.43 cm 10.7 (−14.2 to 35.6) 0.40 16.7 (−11.8 to 45.2) 0.25 10.0 (−34.9 to 55.0) 0.66 0.87
Septal wall, + 0.14 cm −7.99 (−32.8 to 16.9) 0.53 −23.9 (−51.4 to 3.62) 0.088 23.4 (−22.6 to 69.5) 0.32 0.0063
Posterior wall, + 0.12 cm −14.8 (−40.2 to 10.6) 0.25 −34.3 (−61.1 to−7.42) 0.013 28.3 (−22.5 to 79.1) 0.27 0.0014
RWT, + 0.05 −13.2 (−34.3 to 7.85) 0.22 −29.9 (−53.1 to−6.66) 0.012 12.3 (−27.0 to 51.6) 0.54 0.0069
LV mass index, + 20 g/m2 6.06 (
−16.4 to 28.5) 0.60 −11.0 (−35.8 to 13.8) 0.38 46.1 (3.39 to 88.7) 0.035 0.0039
Volumes
LA volume index, + 7.8 ml/m2 41.2 (19.2 to 63.2) 0.0003 23.9 (1.73 to 49.6) 0.067 76.2 (37.7 to 114.6) 0.0001 0.0019
EDV index, + 10 ml/m2 23.0 (1.18 to 44.8) 0.039 12.3 (
−13.1 to 37.7) 0.34 43.8 (5.30 to 82.3) 0.026 0.14 ESV index, + 5 ml/m2 10.3 (
−12.1 to 32.7) 0.37 −8.09 (−33.6 to 17.4) 0.53 39.8 (−0.90 to 80.5) 0.055 0.031 Stroke volume, + 15 ml 27.9 (3.49 to 52.4) 0.025 25.6 (−1.69 to 52.8) 0.066 37.8 (−8.22 to 83.9) 0.11 0.73
Ejection fraction, + 5.1% 11.5 (−7.26 to 30.2) 0.23 23.9 (1.16 to 46.6) 0.040 1.19 (−30.1 to 32.4) 0.94 0.13
The parameter estimates (95% confidence interval) indicate the change in EWD per 1 standard deviation increase in the echocardiographic index. All parameter estimates accounted for the variance explained by age, sex, heart rate and body height and weight. Pintrepresents thePvalue for an interaction between each LV
structure and function [4–7]. Indeed, at increased after-load, the heart needs to generate greater force to pre-serve stroke volume, thereby increasing its energy expenditure and, eventually, promoting cardiac dysfunc-tion and remodeling. Along these lines, an experimental study showed that the peak rate of changes in LV pres-sure (dP/dt), an invasive index of contractility, was 51% greater in hypertensive than in normotensive rabbits [17]. We previously observed that the higher arterial load in subjects with hypertension matched with higher LV systolic stiffness and enhanced LV myocardial per-formance [2]. In result, EWD was 24% higher in hyper-tensive subjects as compared to normohyper-tensives [2]. In line with a small case-control study in 74 patients [18], we confirmed that hypertensive subjects had a higher pressure-strain area than normotensive participants if untreated or if their hypertension was uncontrolled, even after accounting for important confounders such as age, sex and body size. In contrast, EWD was not different between normotensives and effectively controlled hyper-tensives. Evidently, the observational and cross-sectional nature of our study did not allow to infer true causality between controlled hypertension and normalization of EWD. Moreover, EWD increased with PWV, reflecting aortic stiffness.
Previous population studies demonstrated that LV dia-stolic function, particularly in women, is sensitive to the detrimental effects of increased central pulse pressure and arterial stiffness [4,6,7]. This sex-dependent vulner-ability of LV diastolic function to cardiac afterload espe-cially in older women might be explained by the higher aortic pulsatile load and stiffness [5,7] and the enhanced LV systolic performance [9, 19] in women as compared to men. Indeed, women have on average smaller heart chamber volumes, even after standardization for body size [19], with higher LV ejection fraction and global LS [15], and a steeper slope of the stroke work-EDV rela-tionship [19]. Of note, the passive LV diastolic elastance,
a major determinant of LV filling pressure, also appears higher in women than in men [19]. In line, we observed that women had higher pulsatile load and LV LS and, therefore, overall higher EWD than men. Moreover, EWD increased significantly with echocardiographic sur-rogates of LV filling pressure (E/e’ ratio) [20] and pre-load indexes like LAVi and EDVi in women only [21]. As such, EWD might reflect the sex-dependent interplay between preload, afterload and LV systolic performance.
Besides undergoing changes in function, the LV pro-gressively remodels in response to chronically elevated LV afterload [4, 22]. Indeed, the LV walls thicken during chronic pressure overload in order to normalize LV wall stress [22]. In fact, the LV tends towards concentric re-modeling to cope with the progressive stiffening of the large arteries during life [4]. In our study, yet only ob-served in men, EWD decreased with LV concentric re-modeling (higher RWT).
Recent interest in constructing and evaluating pres-sure-strain loops supports the need for a non-invasive clinical tool that integrates LV deformation and loading. Indeed, inspired by Russel and colleagues [23], GE Healthcare recently added a feature to their echocardio-graphic post-processing software (EchoPAC) to con-struct pressure-strain loops from 2D LV strain and an estimated LV pressure curve. The LV pressure-strain loop area derived from such estimated loops correlated strongly with invasive measurements [12]. Yet, Hubert et al. observed substantial shortcomings in the estima-tion of the pressure curve, particularly at greater pres-sures and loop areas [12]. In contrast, in our study, we utilized the true area of subject-specific pressure wave-forms at the specific time of strain recording. As such, our approach does not only account for differences in the shape of pressure waves between individuals, but also for temporal variability in pressure magnitude within individuals. However, validation of our approach to invasive methods is required.
Table 5Multivariable-adjusted associations between ejection work density and echocardiographic indexes of left ventricular diastolic function
Ejection work density (Pa)
All (n= 356) Men (n= 197) Women (n= 159)
LV diastolic function index Parameter estimate
(95% CI)
Pvalue Parameter estimate (95% CI)
Pvalue Parameter estimate (95% CI)
Pvalue Pint
E peak, + 15 cm/s 55.3 (33.0 to 77.5) < 0.0001 38.8 (11.3 to 66.3) 0.0059 86.7 (51.2 to 122.3) < 0.0001 0.39
A peak, + 15 cm/s 47.2 (20.6 to 73.8) 0.0005 43.9 (9.50 to 78.2) 0.013 45.5 (39.0 to 87.2) 0.032 0.16
E/A ratio, + 0.45 29.1 (−2.30 to 60.4) 0.069 17.0 (−20.9 to 54.9) 0.38 58.3 (5.50 to 111.1) 0.031 0.39
e’peak, + 3.2 cm/s 32.2 (−0.031 to 64.3) 0.050 48.6 (10.3 to 87.0) 0.013 16.5 (−36.7 to 72.7) 0.56 0.014
a’peak, + 2.0 cm/s 19.7 (−4.97 to 44.4) 0.12 33.9 (5.42 to 52.3) 0.020 −8.96 (−51.9 to 34.0) 0.68 0.75
E/e’ratio, + 2.1 32.1 (9.20 to 55.1) 0.0062 2.45 (−31.1 to 36.1) 0.89 51.1 (19.6 to 82.6) 0.0017 0.0016
The parameter estimates (95% confidence interval) indicate the change in EWD per 1 standard deviation increase in the LV diastolic function index. All parameter estimates accounted for the variance explained by age, sex, heart rate and body height and weight. Pintrepresents thePvalue for an interaction between each LV
The present study must be interpreted in context of its limitations and strengths. First, echocardiography is prone to measurement errors. However, one experienced observer recorded all echocardiographic images using a standardized protocol. Moreover, images were post-proc-essed by two experienced observers with good reprodu-cibility. Second, we derived EWD by simultaneous finger tonometry and 2D speckle tracking to overcome the technical challenges linked to simultaneous carotid to-nometry and Tissue Doppler Imaging [2]. Of notice, EWD values derived from our 356 participants corre-sponded to those obtained by carotid tonometry and TDI in a random cohort of 148 participants [2]. Finally, EWD requires further validation in outcome and experi-mental studies.
Conclusion
Older age, female sex and hypertensive status are associ-ated with higher EWD. Integration of the LV pressure-strain loop during ejection might be a useful tool to non-invasively evaluate sex-specific and interdependent effects of preload and afterload on LV myocardial per-formance. Future studies should investigate the utility of pressure-strain loops in clinical decision-making, par-ticularly in subjects at risk for heart failure.
Additional file
Additional file 1:Area of the pressure-strain loop during ejection as non-invasive index of left ventricular performance: supplemental material. (DOCX 814 kb)
Abbreviations
AP:Augmentation pressure; EDVi: diastolic volume index; ESVi: End-systolic volume index; EWD: Ejection work density; FLEMENGHO: Flemish Study on Environment, Genes and Health Outcomes; LAVi: Left atrial volume index; LS: Longitudinal strain; LVMi: Left ventricular mass index; PP: Pulse pressure; PWV: Pulse wave velocity
Acknowledgments
Not applicable.
Authors’contributions
NC, TK: study design, acquisition, analysis and interpretation of data, creation of new software for calculation of EWD, drafting of manuscript; MT, PC, JD: data interpretation, substantial revision of manuscript; LT: Database management, statistical revision; WY, FW, JAS: substantial revision of the manuscript. All authors read and approved the final manuscript.
Authors’information
Not applicable.
Funding
The Research Unit Hypertension and Cardiovascular Epidemiology (Leuven, Belgium) received grants from the Flanders Research Foundation (FWO grants G.0880.13; 11Z0916N and G0C5319N).
Availability of data and materials
The datasets used and/or analyzed during the current study are available from the corresponding author (T.K.) upon reasonable request.
Ethics approval and consent to participate
This study was approved by the Ethics Committee of the University of Leuven. All participants provided written informed consent prior to the study.
Consent for publication
Not applicable.
Competing interests
The authors declare that they have no competing interests.
Author details 1
Research Unit Hypertension and Cardiovascular Epidemiology KU Leuven Department of Cardiovascular Sciences, University of Leuven, Leuven, Belgium.2Division of Cardiovascular Imaging and Dynamics, Department of Cardiovascular Sciences, University of Leuven, Leuven, Belgium.
Received: 17 April 2019 Accepted: 29 July 2019
References
1. Spinale FG. Assessment of cardiac function--basic principles and approaches. Compr Physiol. 2015;5(4):1911–46.
2. Kuznetsova T, D’hooge J, Kloch-Badelek M, Sakiewicz W, Thijs L, Staessen JA. Impact of hypertension on ventricular-arterial coupling and regional myocardial work at rest and during isometric exercise. J Am Soc Echocardiogr. 2012;25(8):882–90.
3. Borlaug BA. The pathophysiology of heart failure with preserved ejection fraction. Nat Rev Cardiol. 2014;11(9):507–15.
4. Cauwenberghs N, Knez J, D’hooge J, Thijs L, Yang W-Y, Wei F-F, et al. Longitudinal changes in LV structure and diastolic function in relation to arterial properties in general population. JACC Cardiovasc Imaging. 2017;10(11):1307–16.
5. Cauwenberghs N, Knez J, Tikhonoff V, D’hooge J, Kloch-Badelek M, Thijs L, et al. Doppler indexes of left ventricular systolic and diastolic function in relation to the arterial stiffness in a general population. J Hypertens. 2016;34(4):762–71.
6. Shim CY, Park S, Choi D, Yang WI, Cho IJ, Choi EY, et al. Sex differences in central hemodynamics and their relationship to left ventricular diastolic function. J Am Coll Cardiol. 2011;57(10):1226–33.
7. Coutinho T, Borlaug BA, Pellikka PA, Turner ST, Kullo IJ. Sex differences in arterial stiffness and ventricular-arterial interactions. J Am Coll Cardiol. 2013;61(1):96–103.
8. Kawaguchi M, Hay I, Fetics B, Kass DA. Combined ventricular systolic and arterial stiffening in patients with heart failure and preserved ejection fraction: implications for systolic and diastolic reserve limitations. Circulation. 2003;107(5):714–20.
9. Borlaug BA. Sex, load, and relaxation: are women more susceptible to load-dependent diastolic dysfunction? J Am Coll Cardiol. 2011;57(10):1234–6. 10. Geyer H, Caracciolo G, Abe H, Wilansky S, Carerj S, Gentile F, et al. Assessment
of myocardial mechanics using speckle tracking echocardiography: fundamentals and clinical applications. J Am Soc Echocardiogr. 2010;23(4):351–5.
(See figure on previous page.)
11. Urheim S, Rabben SI, Skulstad H, Lyseggen E, Ihlen H, Smiseth OA. Regional myocardial work by strain Doppler echocardiography and LV pressure: a new method for quantifying myocardial function. Am J Physiol Heart Circ Physiol. 2005;288(5):H2375–80.
12. Hubert A, Le Rolle V, Leclercq C, Galli E, Samset E, Casset C, et al. Estimation of myocardial work from pressure-strain loops analysis: an experimental evaluation. Eur Heart J Cardiovasc Imaging. 2018;19(12):1372–9. 13. Gottdiener JS, Bednarz J, Devereux RB, Gardin J, Klain A, Manning WJ, et al.
American Society of Echocardiography recommendations for use of echocardiography in clinical trials. J Am Soc Echocardiogr. 2004;17(10):1086–119. 14. Schutte AE, Huisman HW, van Rooyen JM, Malan NT, Schutte R. Validation
of the Finometer device for measurement of blood pressure in black women. J Hum Hypertens. 2004;18(2):79–84.
15. Kuznetsova T, Cauwenberghs N, Knez J, Yang W-Y, Herbots L, D’hooge J, et al. Additive prognostic value of left ventricular systolic dysfunction in a population-based cohort. Circ Cardiovasc Imaging. 2016;9(7). 16. Vlachopoulos C, Xaplanteris P, Aboyans V, Brodmann M, Cifkova R,
Cosentino F, et al. The role of vascular biomarkers for primary and secondary prevention. A position paper from the European Society of Cardiology Working Group on peripheral circulation: endorsed by the Association for Research into arterial structure and physiology. Atherosclerosis. 2015;241(2):507–32.
17. Aylward PE, McRitchie RJ, Chalmers JP, West MJ. Baroreflex control of myocardial contractility in conscious normotensive and renal hypertensive rabbits. Hypertension. 1983;5(6):916–26.
18. Chan J, Edwards NFA, Khandheria BK, Shiino K, Sabapathy S, Anderson B, et al. A new approach to assess myocardial work by non-invasive left ventricular pressure-strain relations in hypertension and dilated cardiomyopathy. Eur Heart J Cardiovasc Imaging. 2019;20(1):31–9. 19. Hayward CS, Kalnins WV, Kelly RP. Gender-related differences in left
ventricular chamber function. Cardiovasc Res. 2001;49(2):340–50.
20. Ommen SR, Nishimura RA, Appleton CP, Miller FA, Oh JK, Redfield MM, et al. Clinical utility of Doppler echocardiography and tissue Doppler imaging in the estimation of left ventricular filling pressures: a comparative simultaneous Doppler-catheterization study. Circulation. 2000;102(15):1788–94.
21. Slama M. J.L. T. Assessment of cardiac preload and volume responsiveness using echocardiography. In: Vincent JL, editor. Intensive Care Medicine. 1st ed: Springer; 2003. p. 491–8.
22. Zhang Z, Tendulkar A, Sun K, Saloner DA, Wallace AW, Ge L, et al. Comparison of the young-Laplace law and finite element based calculation of ventricular wall stress: implications for postinfarct and surgical ventricular remodeling. Ann Thorac Surg. 2011;91(1):150–6.
23. Russell K, Eriksen M, Aaberge L, Wilhelmsen N, Skulstad H, Remme EW, et al. A novel clinical method for quantification of regional left ventricular pressure-strain loop area: a non-invasive index of myocardial work. Eur Heart J. 2012;33(6):724–33.
Publisher’s Note