RESEARCH
Current and future distribution of
Aedes
aegypti
and
Aedes albopictus
(Diptera: Culicidae)
in WHO Eastern Mediterranean Region
Els Ducheyne
1*, Nhu Nguyen Tran Minh
2, Nabil Haddad
3, Ward Bryssinckx
1, Evans Buliva
2, Frédéric Simard
4,
Mamunur Rahman Malik
2, Johannes Charlier
1, Valérie De Waele
1, Osama Mahmoud
5, Muhammad Mukhtar
6,
Ali Bouattour
7, Abdulhafid Hussain
8, Guy Hendrickx
1and David Roiz
2,4Abstract
Background: Aedes-borne diseases as dengue, zika, chikungunya and yellow fever are an emerging problem world-wide, being transmitted by Aedes aegypti and Aedes albopictus. Lack of up to date information about the distribution of Aedes species hampers surveillance and control. Global databases have been compiled but these did not capture data in the WHO Eastern Mediterranean Region (EMR), and any models built using these datasets fail to identify highly suitable areas where one or both species may occur. The first objective of this study was therefore to update the exist-ing Ae. aegypti (Linnaeus, 1762) and Ae. albopictus (Skuse, 1895) compendia and the second objective was to generate species distribution models targeted to the EMR. A final objective was to engage the WHO points of contacts within the region to provide feedback and hence validate all model outputs.
Methods: The Ae. aegypti and Ae. albopictus compendia provided by Kraemer et al. (Sci Data 2:150035, 2015; Dryad Digit Repos, 2015) were used as starting points. These datasets were extended with more recent species and disease data. In the next step, these sets were filtered using the Köppen–Geiger classification and the Mahalanobis distance. The occurrence data were supplemented with pseudo-absence data as input to Random Forests. The resulting suit-ability and maximum risk of establishment maps were combined into hard-classified maps per country for expert validation.
Results: The EMR datasets consisted of 1995 presence locations for Ae. aegypti and 2868 presence locations for Ae. albopictus. The resulting suitability maps indicated that there exist areas with high suitability and/or maximum risk of establishment for these disease vectors in contrast with previous model output. Precipitation and host availability, expressed as population density and night-time lights, were the most important variables for Ae. aegypti. Host avail-ability was the most important predictor in case of Ae. albopictus. Internal validation was assessed geographically. External validation showed high agreement between the predicted maps and the experts’ extensive knowledge of the terrain.
Conclusion: Maps of distribution and maximum risk of establishment were created for Ae. aegypti and Ae. albopic-tus for the WHO EMR. These region-specific maps highlighted data gaps and these gaps will be filled using targeted monitoring and surveillance. This will increase the awareness and preparedness of the different countries for Aedes borne diseases.
Keywords: Aedes, Aedes aegypti, Aedes albopictus, Distribution, Chikungunya, Dengue, Spatial model, Surveillance, Yellow fever, Zika
© The Author(s) 2018. This article is distributed under the terms of the Creative Commons Attribution 4.0 International License (http://creativecommons.org/licenses/by/4.0/), which permits unrestricted use, distribution, and reproduction in any medium, provided you give appropriate credit to the original author(s) and the source, provide a link to the Creative Commons license, and indicate if changes were made. The Creative Commons Public Domain Dedication waiver (http://creativecommons.org/ publicdomain/zero/1.0/) applies to the data made available in this article, unless otherwise stated.
Open Access
*Correspondence: educheyne@avia-gis.com 1 Avia-GIS, Zoersel, Belgium
Background
Aedes-borne diseases (dengue, chikungunya, yellow fever and zika) are an emerging problem worldwide, escalat-ing overall risk and burden of disease worldwide [3]. Lack of up to date and more precise Aedes distributional data and potential distributional modelling hampers effec-tive vector surveillance and control. This is particularly true in the WHO Eastern Mediterranean Region (EMR), a region which includes Afghanistan, Bahrain, Dji-bouti, Egypt, Iraq, Iran, Jordan, Kuwait, Lebanon, Libya, Morocco, Oman, Pakistan, Palestine, Qatar, Saudi Arabia, Somalia, Sudan, Syria, Tunisia, United Arab Emirates and Yemen (Fig. 1). Detailed information about disease bur-den and the current and potential spatial distribution of Aedes vectors in the EMR is scarce. Humphrey et al. [4] listed the available information about dengue incidence and country scale vector distribution in the region.
Therefore, there is a clear need to focus on this area, especially in the light of the recent zika virus (ZIKV) pan-demic. Even though none of the EMR countries had any reported ZIKV transmission, the risk of autochthonous zika transmission in the EMR, especially on the Red Sea rim and Pakistan, following introduction from endemic countries, cannot be overlooked.
Given the wide spread distribution and the abundance of Aedes aegypti and the reported cases of dengue, chi-kungunya and yellow fever, Tran Minh et al. [5] assumed that the potential risk of disease outbreaks is high in at least eight of the EMR countries: Djibouti, Egypt, Oman, Pakistan, Saudi Arabia, Somalia, Sudan and Yemen. Furthermore, in recent years the invasive vector Aedes
albopictus has spread in some countries, such as Leba-non [6] and Morocco [7], but the available occurrence database is not updated. The first objective of this study is therefore to build an up to date comprehensive dataset of observed presences of both Aedes aegypti (Linnaeus, 1762) and Aedes albopictus (Skuse, 1895) for the EMR.
Existing spatial distribution models for the two Aedes species can currently only be extracted from global mod-elling outputs [8–10]. In these models, observed pres-ence data are strongly biased in favour of the Americas, the Indian subcontinent, South-East Asia and Europe, and the predicted probability for the EMR may therefore not reflect the actual situation. This bias is supported by the case of the TigerMaps models [11]. These mod-els were based only on Mediterranean data, indicating a higher risk of occurrence of Ae. albopictus in Northern Africa as compared to any of the previously-mentioned global models. The second objective in this study is there-fore to produce a new set of habitat suitability maps for Ae. aegypti and Ae. albopictus focused on the EMR. These maps will depict areas of potential introduction and maximum risk of establishment. Kraemer et al. [1,
2] compiled a global database of observed occurrences of Ae. aegypti and Ae. albopictus. These models improve our knowledge of the species’ distribution globally and provide insight into environmental dependencies. On the other hand, model output can be biased when tar-get area environmental conditions are not properly cap-tured in the training set. Given that in Kraemer’s data less than 1% of the observed points fall geographically within the EMR, a similarity mask was created to include
occurrence data only from areas similar in environmental conditions to the EMR.
Methods
Study area
The EMR has 22 member states/territories: Afghanistan, Bahrain, Djibouti, Egypt, Iraq, Iran, Jordan, Kuwait, Leb-anon, Libya, Morocco, Oman, Pakistan, Palestine, Qatar, Saudi Arabia, Somalia, Sudan, Syria, Tunisia, United Arab Emirates and Yemen (Fig. 1). Many countries in the EMR are particularly vulnerable to communicable disease epi-demics, because they are experiencing numerous envi-ronmental and social stresses, including armed conflicts, water scarcity, food insecurity, rapid population growth
and urbanization. Therefore, these countries often have weak governing institutions and health systems [12], although there does exist a large variability in the EMR.
Training data
First, the Köppen–Geiger classes [13] per EMR coun-try were determined. A binary classification resulted in a mask where value 1 represents all areas globally with one of the classes found in the EMR countries and value 0 where the condition was not met. Secondly, the Mahalanobis distance was calculated using the set of environmental predictors listed in Table 1. The Mahalanobis distance is a unit-less and scale invari-ant similarity measure. Its value will increase when the
Table 1 Overview of the environmental and eco-climatic predictor variables used in spatial distribution modelling of Ae. aegypti and Ae. albopictus in the EMR
ahttp://www.worldclim.org/bioclim bhttp://www.edenextdata.com
c http://ngdc.noaa.gov/eog/dmsp/downloadV4composites.html dhttp://www.fao.org/geonetwork
ehttp://sedac.ciesin.columbia.edu/data/set/grump-v1-population-density/data-download
Data layer Description Resolution (km) Units Origin
Altitude Elevation above sea level 5 × 5 m WorldClima
BIO1 Annual mean temperature 5 × 5 °C WorldClim
BIO2 Mean diurnal range (mean of monthly (max temp − min
temp)) 5 × 5 °C WorldClim
BIO3 Isothermality (BIO2/BIO7) (× 100) 5 × 5 % WorldClim
BIO4 Temperature seasonality (standard deviation × 100) 5 × 5 % WorldClim
BIO5 Max temperature of warmest month 5 × 5 °C WorldClim
BIO6 Min temperature of coldest month 5 × 5 °C WorldClim
BIO7 Temperature annual range (BIO5–BIO6) 5 × 5 km °C WorldClim
BIO8 Mean temperature of wettest quarter 5 × 5 °C WorldClim
BIO9 Mean temperature of driest quarter 5 × 5 °C WorldClim
BIO10 Mean temperature of warmest quarter 5 × 5 °C WorldClim
BIO11 Mean temperature of coldest quarter 5 × 5 °C WorldClim
BIO12 Annual precipitation 5 × 5 mm WorldClim
BIO13 Precipitation of wettest month 5 × 5 mm WorldClim
BIO14 Precipitation of driest month 5 × 5 mm WorldClim
BIO15 Precipitation seasonality (coefficient of variation) 5 × 5 % WorldClim
BIO16 Precipitation of wettest quarter 5 × 5 mm WorldClim
BIO17 Precipitation of driest quarter 5 × 5 mm WorldClim
BIO18 Precipitation of warmest quarter 5 × 5 mm WorldClim
BIO19 Precipitation of coldest quarter 5 × 5 mm WorldClim
Fourier transforms of Tmax, Tmean and Tmin Amplitudes 1, 2, and 3 50 × 50 °C EDENextb
Phases 1, 2, and 3 50 × 50 Day of year EDENext
Fourier transforms of precipitation Amplitudes 1, 2 and 3 50 × 50 mm EDENext
Phases 1, 2, and 3 50 × 50 Day of year EDENext
Night-time light Night-time light 5 × 5 Unit-less DMSP—NASAc
Average NDVI Global annual sum NDVI 5 × 5 Unit-less LADAd
environmental conditions become more and more differ-ent than those observed in the target area.
The cut off for similarity pixels was set to the 99% per-centile of the Mahalanobis distance within the Köppen– Geiger EMR mask. This procedure retained 1351 out of 17,280 entries for Ae. albopictus and 1938 out of 13,991 for Ae. aegypti (Additional file 2: Fig. S1).
To extend the dataset with data collected specifically in the EMR, additional Ae. albopictus presence/absence data from Lebanon were provided by one of the co-authors (N.H.): 186 locations were sampled during sum-mer 2015 for Ae. albopictus presence in Lebanon, and the mosquito was found at 73 of them (unpublished data).
In addition, a literature review and personal commu-nications with entomologists and environmental health officers in the EMR provided further presence locations for both Ae. aegypti and Ae. albopictus and for Aedes -borne disease outbreaks (we excluded seroprevalence studies) in the region of interest. This data set is provided as Additional file 1.
The current compiled data sources contain only observed occurrence data of Ae. aegypti and Ae. albopic-tus, except for Lebanon where absence data for Ae. albop-ictus was collected. Many modelling techniques require both occurrence and absence data as input data, except for presence-only modelling techniques such as MaxEnt [14]. While these occurrence-only models have proven their value for species distribution modelling in general [15] and Aedes modelling more specifically [16, 17], we feel that including simulated absence data, also called pseudo-absence data, would strengthen the model out-put. This is not only because extra information is added to the training set but also because the range of model-ling techniques that can be used is much wider.
A surface range envelope (SRE) presence-only model was used to define the area suitable for both species together. Pseudo-absences were then generated randomly outside this area within the Köppen–Geiger/Mahalano-bis EMR mask as a point shapefile without a minimum distance criterion [18]. SRE models were based on the presence training data included in the Mahalanobis dis-tance mask using the BIOMOD package in R [19]. The suitable area was restricted by removing 1.25, 2.5 and 5% of the outer values in each of the environmental predic-tor variable envelopes. This yielded three different train-ing datasets per species. The number of pseudo-absences that was generated was set equal to the number of pres-ence data to obtain a balanced training dataset and avoid bias towards predicting presence or absence. No pseudo-absences were generated for Lebanon since absence loca-tions were already available. The final absence dataset consisted of the generated pseudo-absences and the bal-anced subset of absence locations in Lebanon.
Environmental predictor data
From literature, temperature is a crucial factor limit-ing the distribution of Ae. aegypti and Ae. albopictus. Other listed variables include altitude, rainfall as well as land-use and anthropogenic factors. The predictor vari-able dataset was collated from a variety of sources and included both ground-measured and remotely-sensed data (Table 1).
All variables, except the Fourier transforms, were available at a spatial resolution of 5 × 5 km. The Fourier MODIS images were processed according to Scharle-mann et al. [20] over the period of 2001–2012 and were available from the EDENext data archive (http://www. edenextdata.com/). These Fourier variables were down-scaled using spatial inverse distance weighted interpola-tion. The interpolation results were assigned to 5 × 5 km
pixels based on the average of the 12 nearest locations in the grid. A 5 × 5 km resolution land mask was then
applied to obtain a fine-resolution border between land and water bodies (Additional file 3: Fig. S2).
Species distribution modelling
The suitability models were generated using Random For-ests (RF) [21]. RF is a powerful data mining tool that can model complex interactions between different predictor variables and determine variable importance with great classification accuracy [22]. RF is a mixture of tree pre-dictors that are randomly constructed by bootstrapping from the complete dataset with replacement but having the same distribution as the full dataset. Random forests of 1000 trees were trained using the VECMAP software (http://www.vecmap.com). Six predictor variables were randomly selected at each node to split it into two new branches. Given that the input data sets were balanced, the cut-off value to differentiate between suitable and unsuitable habitats is 0.5.
Variable importance was assessed using the Gini impu-rity criterion. The smaller the Gini impuimpu-rity index, the more accurate the classification of the pixel. The Gini impurity index may therefore be very low when nodes are split by variables that are highly correlated with the species’ probability of occurrence. During the training process, random subsets of predictor variables were con-sidered for each split and each time the variable with the lowest Gini impurity index was chosen. To assess vari-able importance, the mean decrease in the Gini impurity index in each variable as compared the other variables in the model was calculated.
overall agreement by the training dataset to classify an area as suitable or unsuitable for the species. Subsets of the training data can, however, reveal extreme cases, i.e., areas where only a part of the training data would clas-sify the area as suitable. These areas are characterized by environmental and anthropogenic conditions that are not ideal for the species but may be deemed sufficient for them to survive. To consider these extreme areas, 100 subsets of the random forest model, each containing 10 trees, were assessed and the maximum value of each pixel was retained.
Internal and external validation
The standard deviation per pixel of these 100 subsets of the random forest model, each containing 10 trees, was assessed to evaluate model uncertainty, permitting a more geographically based assessment of model uncer-tainty instead of using overall performance indices. A high pixel value represents large variability in the mod-elled probabilities of occurrence and therefore greater uncertainty. Pixels with small values indicate that many model repetitions estimated a similar probability of occurrence and therefore represent locations for which the model outcome is more robust.
To externally validate the model outputs, we contacted the WHO EMR point of contacts for every country in the region. To facilitate the interpretation, the four maps per country (current and maximum risk of establish-ment for Ae. aegypti and Ae. albopictus respectively) were combined into a single map. This map was obtained by hard classifying the suitable and maximum risk of
establishment maps with a threshold of 0.5. This means that if the probability is higher than 0.5 a value of 1 (cur-rent) and 2 (maximum risk of establishment) respectively was attributed. In the next step, the maps were combined and the maximum value of each map was retained in the final output.
The experts were asked to assess the model output by indicating areas that are of interest either because they confirm what was found during surveillance activities that were not yet reported or conversely because they show a mismatch between the predicted suitability and the observed suitability. The areas of agreement and disagreement where annotated on the maps and digi-tized. This was used as input for a confusion matrix with a random sample of 2000 pixels were used to quantify the experts’ opinions, and the following accuracy indi-ces were calculated: Percent Correctly Classified (PCC), Cohen’s index of agreement κ and the sensitivity and
specificity per class.
Results
Training data
Following the literature review and the expertise of ento-mologists in the region, the presence of Aedes aegypti was confirmed in several countries of the EMR: Djibouti, Egypt, Oman, Pakistan, Saudi Arabia, Somalia, Sudan, and Yemen (Fig. 2). The presence of Ae. albopictus was confirmed in Iran, Jordan, Lebanon, Morocco, Paki-stan and Syria (Fig. 3). The two species were detected in nearby regions that are not part of the EMR, such as Ae. aegypti in Israel and Turkey and Ae. albopictus in
Algeria, Israel and Turkey. Dengue was reported in Dji-bouti, Egypt, Pakistan, Saudi Arabia, Somalia, Sudan and Yemen. Imported dengue cases were reported in Oman and Iran. Chikungunya was reported in Djibouti, Paki-stan, Saudi Arabia, Somalia and Yemen, and yellow fever in Sudan. So far, no zika infection was reported in the EMR [3].
Based on this information, the resulting dataset included 1995 locations for Ae. aegypti and 2868 presence
locations for Ae. albopictus within the boundaries of the Mahalanobis distance mask.
Species distribution modelling
The distribution model and maximum risk of establish-ments are shown in Figs. 4, 5, 6, 7, 8 and 9.
The predicted probabilities of establishment and spread of Ae. aegypti in the EMR are displayed in Figs. 4 and 5, respectively. The first map shows areas of high probability Fig. 3 Locations where Ae. albopictus was found within the EMR Mahalanobis distance
of occurrence, these being the southern areas of Soma-lia and Sudan, South Sudan (not part of EMR), the Nile delta in Egypt, the Red Sea border of Saudi Arabia and Yemen, and Pakistan. Areas suitable for maximum risk of establishment are highlighted in Fig. 5. These areas are Morocco, the Mediterranean Sea border of Tunisia, Libya and Egypt, Palestine, Lebanon, Syria and countries around the Red Sea rim and the Persian Gulf. This high-lights that all EMR countries are suitable for Ae. aegypti establishment. The uncertainty map in Fig. 6a shows areas with a high standard deviation of model predic-tions. Among these are areas in Morocco and Oman and a band between Iraq and Iran that was not identified as being suitable in the distribution model. The signal to noise map (Fig. 6b) indicates that the noise is highest in the south of Sudan, which could be attributed to forested areas.
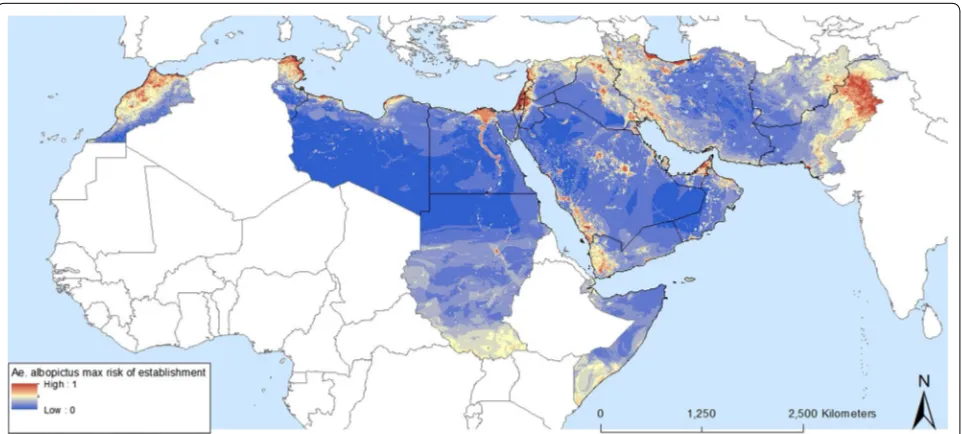
The predicted probabilities of Ae. albopictus occur-rence in the EMR are shown in Figs. 7 and 8, which map areas of suitability and maximum risk of establishment, respectively. The maps highlight the fact that all EMR countries have areas suitable for the Ae. albopictus. They also confirm field observations in Morocco, Palestine, Jordan, Lebanon, Syria and Pakistan. Both maps show patchy zones of higher probability, corresponding to urbanized areas. Suitable regions with a high probability of establishment were also found in countries that, so far have not reported any occurrence such as Tunisia, Libya, Egypt, Iraq, United Arab Emirates, Saudi Arabia (south-western region), and Yemen. Figure 8 indicates where the maximum risk of establishment of Ae. albopictus could
be found. This includes the Nile delta in Egypt, the south-ern zones of South Sudan (outside EMR) and Somalia, and eastern Afghanistan. A map of uncertainty associ-ated with the predictions for Ae. albopictus is presented in Fig. 9a. In the case of Ae. albopictus the noise is high-est at the Mediterranean coast.
The random forest models show that the distributions of both Aedes species are highly influenced by demo-graphic and climatic factors. Their relative importance is illustrated in Figs. 10 and 11 for Ae. aegypti and Ae. albopictus, respectively.
The five most important variables for Ae. aegypti were all related to precipitation and host availability, expressed as population density and night-time lights. The temper-ature variables scored less and ranked between rank five and rank ten. In case of Aedes albopictus, urbanisation was the most important factor, determined by population density and night-time lights. This is followed by temper-ature and precipitation.
Internal and external validation
We received feedback from Tunisia, Oman, Pakistan and Somalia. Feedback from Somalia could not be quantified, as the points of contacts generally confirmed the find-ings but did not indicate any regions or disagreement. The accuracy indices of Tunisia, Oman and Pakistan are listed in Table 2. The accuracy expressed as Percent Correctly Classified is very high in all cases. Similarly, Cohen’s index of agreement κ can be classified as near
measures indicate that there exists a good discrimination between the classes 0 (not suitable) on the one hand and the classes 1 and 2 (current suitability and maximum risk of establishment) on the other hand. Between the two classes there is confusion, mostly pixels that are consid-ered maximum risk of establishment whereas they are currently suitable.
Discussion
The distributions of Ae. aegypti and Ae. albopictus are, as expected, highly influenced by precipitation, demo-graphic factors and temperature [24, 25]. Night-time light and human population density are among the most
important predictor variables for both Aedes species. Night-time light indicate urbanisation and both species are container-breeders within an urban environment [26]. Additionally, as both species are anthropophilic, with Ae. albopictus being the most opportunistic [27], human population indicates host availability.
in water supply. Therefore, precipitation may be more important than in other areas. These results highlight the fact that different key limit factors must be more relevant in different geographical areas, as suggested by Cunze et al. [28]. Altitude is included in the model in contrast to the study by Rochlin et al. [29] where this was irrelevant.
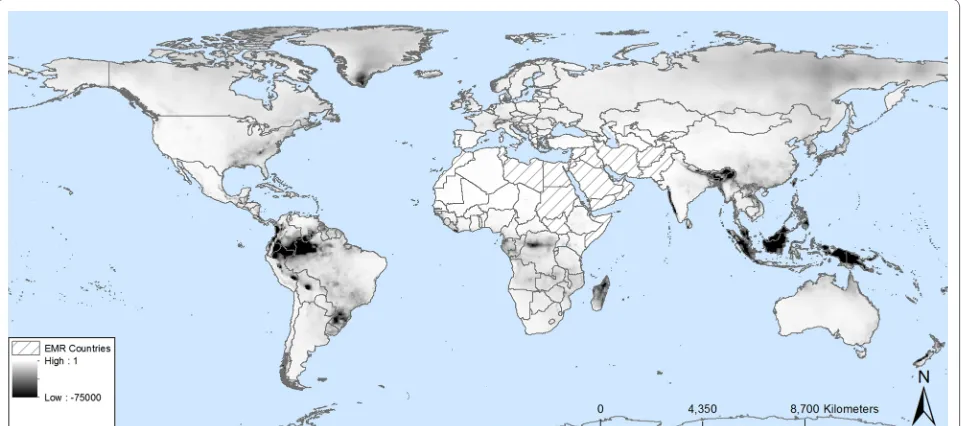
When the EMR specific model output is contrasted to the model output generated by Kraemer et al. [1]
(Figs. 12, 13) it is clear that the models differ especially in urban areas within the EMR. Whilst this might be considered a small spatial difference, it has serious impli-cations in terms of vector-borne disease management. Indeed, these areas are where the highest population density can be found so if vectors and/or pathogens are introduced within these high probability areas this might lead to outbreaks, as confirmed by the reported cases of Fig. 7 Predicted probability of Ae. albopictus occurrence obtained from a random forest model
dengue and chikungunya over the last years (Additional file 1). Other modelling approaches such as the MaxEnt output from Medley [16] even completely failed to high-light suitability within the EMR.
The results of the distribution and maximum risk of establishment models show that there are numerous areas with suitable habitats for Ae. aegypti and Ae. albopictus throughout the EMR, although few field data are available for the region. Monitoring these areas will help detect-ing introduction of the species in areas that are generally regarded as less suitable for the species. This also includes reintroduction, as Ae. aegypti was widely distributed in the Mediterranean during the last century [30].
We cannot exclude that these other areas within the EMR have already been invaded, as there is little infor-mation available on Ae. aegypti and Ae. albopictus in the EMR. Therefore, increasing Aedes and Aedes-borne disease entomological and epidemiological surveillance
in the area is a priority. While there is an urgent need to undertake periodic surveillance campaigns in areas that are currently considered suitable for maximum risk of establishment, attention should also be paid to sur-veillance at larger population centres, at Points of Entry (PoE) for Aedes, such as harbours, roads and ground-crossings, and for Aedes-borne diseases and viruses, at airports and ports and larger urban areas.
As a first step towards capacity building for entomo-logical surveillance in the area, training courses and guidelines for improving Aedes and Aedes-borne disease surveillance and control have been developed by the WHO Regional Office for the Eastern Mediterranean. However, it is also important to raise awareness of the key elements that affect habitat suitability for mosqui-toes, especially in urban areas, such as unprotected stor-age of drinking water.
Conclusion
This paper presented tailored distribution and maximum risk of establishment maps for the two major vectors of disease: Aedes aegypti and Ae. albopictus for the WHO EMR. Previous maps were highly biased towards data
from the Americas and Asia and failed to identify risk areas in the target region. The obtained maps were pro-vided to the points of contacts within the countries and their expertise was used to validate the outcome. Urban environment and host availability are among the most Fig. 10 Dot chart of variable importance for predicting the occurrence of Ae. aegypti. Only the 15 most important variables are given
Fig. 11 Dot chart of variable importance for predicting the occurrence of Ae. albopictus. Only the 15 most important variables are given
Table 2 Results of the country-based expert validation
Country Accuracy (CI) Kappa Sensitivity Specificity
0 1 2 0 1 2
Tunisia 0.989 (0.985, 0.994) 0.976 0.98 1 0.99 0.992 0.998 0.991
Oman 0.987 (0.982, 0.992) 0.968 1 0.561 1 1 1 0.936
important predictor variables for both Aedes species. The relative importance of precipitation is especially pro-nounced for Ae. aegypti which reflects the aridity of the region with shortages in water supply.
The maps generated specifically for the EMR high-lighted data gaps and these gaps will be filled using tar-geted monitoring and surveillance. This will increase the awareness and preparedness of the different countries for Aedes borne diseases.
Additional files
Additional file 1. Presence of Aedes aegypti and Aedes albopictus and
case data of Dengue, chikungunya and yellow fever in the EMR.
Additional file 2: Fig. S1. Presence data (Ae. aegypti and Ae. albopictus)
taken from locations in areas with a Mahalanobis distance greater than 280 that were excluded from the model training data.
Additional file 3: Fig. S2. TFA processed precipitation data before (top) and after (bottom) spatial interpolation.
Fig. 12 Map difference between Kraemer et al. [1, 2] and EMR specific Ae. aegypti probability
Authors’ contributions
DR and GH conceptualize and supervise. NNTM, ED, WB, VDW, EB, ED, MM, GH, DR performed the data curation, analysis and investigation. NH performed active data collection in Lebanon. NH, OM, MM, AB, AH provided expert validation on the output. NNTM, EB, MM, GH, FS, DR obtained resources and funding. WB, GH, MM, FS administrated the project. WB, VDW, JC, DR, ED write the original draft. All authors read and approved the final manuscript.
Author details
1 Avia-GIS, Zoersel, Belgium. 2 Regional Office for the Eastern Mediterranean, World Health Organisation, Cairo, Egypt. 3 Laboratory of Immunology and Vec-tor-Borne Diseases, Faculty of Public Health, Lebanese University, Fanar, Lebanon. 4 MIVEGEC Lab, IRD/CNRS/UM, Montpellier, France. 5 Directorate General for Dis-ease Surveillance and Control, Ministry of Health, Muscat, Sultanate of Oman. 6 Directorate of Malaria Control, Islamabad, Pakistan. 7 Institut Pasteur Tunis, Tunis, Tunisia. 8 Vector Control Focal Point, Ministry of Health, Puntland, Somalia.
Acknowledgements
We thank the numerous entomologists and health officers of the EMR who shared data with the WHO Regional Office for the Eastern Mediterranean. Ms. Barwa and Dr. Zayed are gratefully acknowledged for their technical assistance. We gratefully acknowledge the valuable input of the anonymous reviewers on the first version of this paper.
Competing interests
The authors declare that they have no competing interests.
Availability of data and materials
The dataset generated during the current study are included in the Additional file 1. Results from field work in Lebanon are available after a formal request to Nabil Haddad.
Ethics approval and consent to participate
Not applicable.
Funding
This work was supported by the WHO Regional Office for the Eastern Mediter-ranean. The work was supported partially by the project InvaCosts (ANR-14-CE02-0021-01). Field work in Lebanon was supported by the WHO National Bureau (LEB1409860).
Publisher’s Note
Springer Nature remains neutral with regard to jurisdictional claims in pub-lished maps and institutional affiliations.
Received: 6 November 2017 Accepted: 2 February 2018
References
1. Kraemer MUG, Sinka ME, Duda KA, Mylne A, Shearer FM, Brady OJ, Messina JP, Barker CM, Moore CG, Carvalho RG, et al. The global compendium of Aedes aegypti and Ae. albopictus occurrence. Sci Data. 2015;2:150035.
2. Kraemer MUG, Sinka ME, Duda KA, Mylne A, Shearer FM, Brady OJ, Messina JP, Barker CM, Moore CG, Carvalho RG, Coelho GE, Van Bortel W, Hendrickx G, Schaffner F, Wint GRW, Elyazar IRF, Teng H, Hay SI. Data from: The global compendium of Aedes aegypti and Ae. albopictus occurrence. Dryad Digit Repos. 2015. https://doi.org/10.5061/dryad.47v3c.2. 3. Wilder-Smith A, Gubler DJ, Weaver SC, Monath TP, Heymann DL, Scott
TW. Epidemic arboviral diseases: priorities for research and public health. Lancet Infect Dis. 2017;17:e101–6.
4. Humphrey JM, Cleton NB, Reusken CBEM, Glesby MJ, Koopmans MPG, Abu-Raddad LJ. Dengue in the Middle East and North Africa: a systematic review. PLOS Negl Trop Dis. 2016;10:e0005194.
5. Tran Minh N, Huda Q, Asghar H, Samhouri D, Abubakar A, Barwa C, Shaikh I, Buliva E, Mala P, Malik M. Zika virus: no cases in the Eastern Mediterra-nean Region but concerns remain. East Mediterr Health J. 2016;22:350–5.
6. Haddad N, Mousson L, Vazeille M, Chamat S, Tayeh J, Osta MA, Failloux A-B. Aedes albopictus in Lebanon, a potential risk of arboviruses outbreak. BMC Infect Dis. 2012;12:300. https://doi.org/10.1186/1471-2334-12-300. 7. Bennouna A, Balenghien T, El Rhaffouli H, Schaffner F, Garros C, GardÈS
L, Lhor Y, Hammoumi S, Chlyeh G, Fassi Fihri O. First record of Stegomyia albopicta (=Aedes albopictus) in Morocco: a major threat to public health in North Africa? Med Vet Entomol. 2016;31:102–6.
8. Benedict MQ, Levine RS, Hawley WA, Lounibos LP. Spread of the tiger: global risk of invasion by the mosquito Aedes albopictus. Vector Borne Zoonotic Dis. 2007;7:76–85.
9. European Centre for Disease Control. Environmental risk mapping: Aedes albopictus in Europe. Stockholm: European Centre for Disease Control; 2013. 10. Khormi HM, Kumar L. Climate change and the potential global
distribu-tion of Aedes aegypti: spatial modelling using geographical information system and CLIMEX. Geospat Health. 2014;8:405.
11. European Centre for Disease Control. Development of Aedes albopictus
risk maps. Stockholm: European Centre for Disease Control; 2009. 12. Habib RR, Zein KE, Ghanawi J. Climate change and health research in the
Eastern Mediterranean Region. EcoHealth. 2010;7:156–75.
13. Rubel F, Brugger K, Haslinger K, Auer I. The climate of the European Alps: shift of very high resolution Köppen–Geiger climate zones 1800–2100. Meteorol Z. 2017;26:115–25.
14. Elith J, Graham CH, Anderson RP, Dudík M, Ferrier S, Guisan A, Hijmans RJ, Huettmann F, Leathwick JR, Lehmann A, et al. Novel methods improve prediction of species’ distributions from occurrence data. Ecography. 2006;29:129–51.
15. Sallam MF, Xue R-D, Pereira RM, Koehler PG. Ecological niche modeling of mosquito vectors of West Nile virus in St John’s County, Florida, USA. Parasites Vectors. 2016;9:371.
16. Medley KA. Niche shifts during the global invasion of the Asian tiger mosquito, Aedes albopictus Skuse (Culicidae), revealed by reciprocal distribution models. Glob Ecol Biogeogr. 2009;19:122–33.
17. Senay SD, Worner SP, Ikeda T. Novel three-step pseudo-absence selec-tion technique for improved species distribuselec-tion modelling. PLoS ONE. 2013;8:e71218.
18. Barbet-Massin M, Jiguet F, Albert CH, Thuiller W. Selecting pseudo-absences for species distribution models: how, where and how many? Methods Ecol Evol. 2012;3:327–38.
19. Thuiller W, Lafourcade B, Engler R, Araújo MB. BIOMOD—a plat-form for ensemble forecasting of species distributions. Ecography. 2009;32:369–73.
20. Scharlemann JPW, Benz D, Hay SI, Purse BV, Tatem AJ, Wint GRW, Rogers DJ. Global data for ecology and epidemiology: a novel algorithm for temporal fourier processing MODIS data. PLoS ONE. 2008;3:e1408. 21. Breiman L. Random forests. Mach Learn. 2001;45:261–77.
22. Cutler DR, Edwards TC, Beard KH, Cutler A, Hess KT, Gibson J, Lawler JJ. Random forests for classification in ecology. Ecology. 2007;88:2783–92. 23. Landis RJ, Koch GG. The measurement of observer agreement for
cat-egorical data. Biometrics. 1977;33:159–74.
24. Brady OJ, Johansson MA, Guerra CA, Bhatt S, Golding N, Pigott DM, Delatte H, Grech MG, Leisnham PT, Maciel-de-Freitas R, et al. Modelling adult Aedes aegypti and Aedes albopictus survival at different tempera-tures in laboratory and field settings. Parasites Vectors. 2013;6:351. 25. Brown JE, Evans BR, Zheng W, Obas V, Barrera-Martinez L, Egizi A, Zhao H,
Caccone A, Powell JR. Human impacts have shaped historical and recent evolution in Aedes aegypti, the dengue and yellow fever mosquito. Evolu-tion. 2013;68:514–25.
26. Mellander C, Lobo J, Stolarick K, Matheson Z. Night-time light data: a good proxy measure for economic activity? PLoS ONE. 2015;10:e0139779. 27. Delatte H, Desvars A, Bouétard A, Bord S, Gimonneau G, Vourc’h G,
Fontenille D. Blood-feeding behavior of Aedes albopictus, a vector of chikungunya on La Réunion. Vector Borne Zoonotic Dis. 2010;10:249–58. 28. Cunze S, Kochmann J, Koch LK, Klimpel S. Aedes albopictus and its
envi-ronmental limits in Europe. PLoS ONE. 2016;11:e0162116.
29. Rochlin I, Ninivaggi DV, Hutchinson ML, Farajollahi A. Climate change and range expansion of the Asian tiger mosquito (Aedes albopictus) in Northeastern USA: implications for public health practitioners. PLoS ONE. 2013;8:e60874.


![Fig. 12 Map difference between Kraemer et al. [1, 2] and EMR specific Ae. aegypti probability](https://thumb-us.123doks.com/thumbv2/123dok_us/765186.2072579/12.595.58.544.350.566/fig-map-difference-kraemer-emr-specific-aegypti-probability.webp)
