Research
Article
A
VALIDATED
RP
HPLC
METHOD
FOR
THE
DETERMINATION
OF
IMPURITIES
IN
TAMSULOSIN
HCL
THOMAS
SUDHA*,
JITENDRA
DHOMANE
1*1Department of Pharmaceutical Analysis, The Erode College of Pharmacy & Research, Erode638112. Email: [email protected]
Received: 23 Sep 2011, Revised and Accepted: 21 Oct 2011
ABSTRACT
A simple and rapid reversed phase high performance liquid chromatographic method for the separation and determination of process related impurities of Tamsulosin HCL (TAM) was developed. The separation was achieved on a reverse phase C18 column using the gradient LC method,
solution A and solution B as mobile phase. The solution A contains aqueous ortho phosphate buffer pH 6.5 and solution B contains a mixture of water: acetronitrile (90:10%v/v). The method was linear over a range of 0.2 to 1.9µg/ml for process related impurities and 0.2 to 12.8µg/ml for Tamsulosin HCL. The recoveries were found to be in the range of 92.14 to 104.44% for impurities as well as Tamsulosin HCL. The precision and robustness of the method were evaluated. It was subjected to the stress condition of oxidative, acidic, basic, hydrolytic, thermal and photolytic degradation. The degradation products were well resolved from the main peak and its impurities, proving the stability indicating power of the method. It was used not only for quality assurance, but also for monitoring the synthetic reaction involved in the process development work in the laboratory. The method was found to be specific, precise and reliable for the determination of un reacted levels of raw materials, intermediates in the reaction mixtures and the finished products of Tamsulosin HCL.
Keywords: RP‐HPLC. Tamsulosin HCl, Impurities, Degradation products, Validation.
INTRODUCTION
Tamsulosin (HCL) is described chemically as (R) ‐5‐ (2‐(2‐ ethoxy phenoxy) ethyl aminopropyl)‐2 methoxy benzene sulphonamide. It is a selective a1 receptor antagonist. Tamsulosin HCl 1, 2 is a selective
α1 receptor antagonist that has preferential selectivity for the α1A
receptor in the prostate versus the α1B receptor in blood vessels 3. It
is synthesized by hydrolysis of (R)‐2 –N (trifluroacetyl amino)‐1‐(4 methoxy‐3 sulphanoyl) phenyl propane (TAS) and 2‐(o‐ethoxy phenoxy) ethyl bromide in a laboratory. During its synthesis not only the un reacted (TAS), but also its related analogues: (1). 5‐(2R)‐ 2 aminopropyl‐2‐ methoxy benezene sulphonamide.(2). 2‐methoxy‐ 5‐(2R)‐(2‐(2methoxy phenoxy) ethyl amino propyl) benezene sulphonamide. (3). 1‐(2‐ bromo ethoxy)‐2 ethoxy benzene. (4).(2R)‐ N‐(2‐(2ethoxy phenoxy) ethyl) ‐1‐(4 methoxy phenyl) propan‐2‐ amine hydrochloride are usually carried over in small quantities into the bulk(TAM). According to the USFDA such impurities at the levels > 0.1% must be identical and quantified using validated analytical procedures. Therefore, the separtion and determination of synthetic impuriries of (TAM) is of graet importance not only for quality assurance but also for monitoring of reactions during process development and control. LC‐MS/MS methods for the determination of TAM in human blood phama have been reported
4. LC‐ESI‐MS/MS method for the quantification of TAM solution in
human plasma5. Spectrophotometric simultaneous estimation
Tamsulosin HCL and Dutasteride in combined dosage form by first order derivative , area under curve method and UV spectroscopy method was reported 6,7. Spectrophotometric simultaneous
estimation of Tamsulosin and tolferodine in combined dosage form by first order derivative and AUC method was reported 8.
Determination of the enantiomers of TAM HCl and its synthetic intermediate by chiral liquid chroamtography was reported 9.
Stability indicating HPLC method for the determination of chiral purity of R‐(5‐2( amino propyl)‐2 methoxy benzene sulphoamide and voltametric determination of Tamsulosin were reported 10,11.
RP‐HPLC and TLC methods for simultaneous estimation of TAM HCL and finasteride in bulk and in bulk and in tablet dosage form were reported 12. However, to the best of our knowledge, no single
, analytical method for the separation and determiantion of synthetic impurities of TAM is available in literature. In this paper , we describe a simple and rapid HPLC method for separation and determination synthetic impurities of TAM in bulk drugs using a reverse phase C18 and the solution A contains aqueous ortho
phosphate buffer PH (3.0) and solution B contains a mixture of
water : acetronitrile (90:10%v/v) as eluent at 50ºC.
MATERIAL AND METHODS
Materials and reagents
All reagents were of analytical grade unless stated otherwise. HPLC grade acetonitrile, orthophosphoric acid, Triethylamine obtained from Qualigens, Mumbai, India were used.
High purity water was purchased by using Millipore water purification system (Millipore, Milford, MA, USA) TAM and its impurities were gifted by Wockhardt Research centre, Aurangabad, India.
Instruments
The water HPLC system (water Milford USA) used consists of a pump, auto sampler and PDA detector. The output signal was monitored and processed using Empower‐2 software.
Chromatographic conditions
The mobile phase containing Solution A&B was (orthophosphate buffer pH 6.5 acetonitrile: water 75: 25%v/v). Before delivering into
the system it was filtered through 0.45µm PTFE filter and degassed using a vacuum. The analysis was carried out under gradient condition using a flow rate of 1.5ml/min at 50ºC temperature. Chromatogram was recorded at 286nm using 2695 separation module diode array detector.
Analytical procedure
Standards of TAM, AMS, MBS, BEB and EMH (10mg) accurately weighed and transferred into 100ml volumetric flask and dissolved in acetronitrile: water (75:25%v/v). After dissolving the volume was made up to the mark with acetonitrile: water (75:25%v/v). Synthetic mixture containing TAM, AMS, MBS, BEB and EMH was prepared and a 20 µl volume of each volume was injected and chromatographed under the above condition. Samples of bulk drug, standards of TAM and its related impurities were prepared at a concentration of 2mg/ml. The amounts of impurities were calculated from their respective peak areas. The peak areas were normalized against TAM and response factors thus obtained were used in calculating the content of impurities.
RESULTS AND DISCUSSION
Method Development
The proposed method was validated as per ICH guidelines13,14.
30 Figure.1 shows the molecular structure of Tam and structurally
related synthetic impurities viz, AMS, MBS, BEB and EMH studied in the present investigation. All these materials were subjected to separation by RP‐HPLC. Due care was given to the pH of the mobile phase standardizing the HPLC condition. pH values between 6.5 and 6.75 were found to be the optimized value for good separation. Acetonitrile was used as organic modifier to improve the separation. The effect of concentration of acetonitrile and temperature of the column on resolution was
also studied. The chromatographic separation was found to be depended on the concentration of acetonitrile and separation was found to be optimum at 90 %v/v. The optimum resolution between the compounds of interest was obtained at 50ºC using kromasil C18 column with mobile phase A&B (potassium
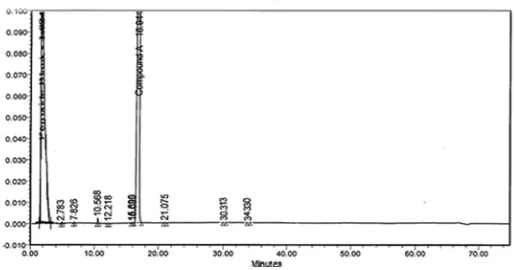
dihydrogen orthophosphate buffer pH 6.5& acetonitrile: water 90:10%v/v) as used. A typical chromatogram of a synthetic mixture containing TAM, AMS, MBS, BEB and EMH was shown in Figure2.
Figure-1 Tamsulosin and its impurities
Tamsulosin
S
O O N
H2
O C
H3
NH
O
O C
H3
CH3
5-[(2R) -2- amino propyl] -2- methoxy benzene sulphonamide
C
H
3NH
2O
CH
3
S
O
O
NH
22-methoxy-5-(2R)-{[2-(2-methoxy phenoxy) ethyl] amino propyl} benzene
sulphonamide
O
CH3
O NH
O
CH3
S O
O NH2
1-(2-bromo ethoxy) -2- ethoxy benzene
O
O C
H3
Br
(2R)-N-[2-(2-ethoxy phenoxy) ethyl] -1-(4-methoxy phenyl) propan-2-
amine hydrochloride
NH
O O C
H3
CH3
O C
H3
HCL
31
Fig. 2: LC Chromatogram of Tamsulosin HCL and its imputities
The peak areas were identified by injecting and comparing the retention times with those of authentic standards. Reproducible peak shapes were obtained under the optimum conditions. The peak tailing factors were calculated for TAM and its impurities. From these values, it could be clearly seen that the shape of these peaks are undistorted. Therefore the kromasil C18 column was preferred
over the other column like waters xterra C18, because it has provided
better resolution of the peaks with reproducibility. The retention time (tR), relative retention time (RRT), relative response factor (RRF) and wavelengths of maximum absorbance (λmax) were determined and recorded in Table‐1.
Table I: Retension and response data for TAM and its impurities
Compound Abbreviation tR RRT RRF
Tamsolusin
5‐(2R)‐2 aminopropyl‐2‐ methoxy benezene sulphonamide 2‐methoxy‐5‐(2R)‐(2‐(2methoxy phenoxy) ethyl amino propyl) benezene sulphonamide
1‐(2‐ bromo ethoxy)‐2 ethoxy benzene
(2R)‐N‐(2‐(2ethoxy phenoxy) ethyl) ‐1‐(4 methoxy phenyl) propan‐2‐ amine hydrochloride
TAM AMS MBS BEB EMH
16.323 2.808 7.751 10.657 20.54
1.00 0.17 0.47 0.65 1.26
1.00 1.35 1.70 0.74 2.83
tR= Retension time, RRT= Relative retension time, RRT= Relative response factor
The UV detector was set at 286nm for both detection and quantification. This was selected based on the observations that the response of the chromatographic peaks of TAM and its impurities were better when compared to the determinations made at other wavelengths.
Specificity
Specificity is the ability of the method to measure the analyte response in the presence of its potential impurities. The specificity of the developed LC method for TAM was carried out in the presence of its impurities namely AMS, MBS, BEB and EMH. Stress studies were performed for TAM to provide an indication of the stability indication property and specificity of the proposed method. International stress condition of heat (105ºC for 24hr), acid (1.0
NHCL), base (5M NaOH), thermal, oxidation (3.0% H2O2) and
photolytic degradation were taken into account to evaluate the ability of the proposed method to separate TAM from its degradation product. Peak purity test was carried out for the TAM peak by using a PDA detector in stress samples. TAM was found to degrade significantly in acid hydrolysis, base hydrolysis and mild degradation was observed in thermal stress condition leading to the formation of impurity AMS Figure‐3
32
Fig. 3: Typical Chromatogram of Tamsulosin spiked with its impurities and its forced degradation samples
This was confirmed by co injecting impurity AMS to these degraded samples. TAM was found to stable under photolytic degradation and oxidation conditions. Photo diode array detector was employed to
check and assure the homogeneity and purity of TAM peak, in all the stressed samples. The results are present in Table 2.
Table 2: Summary of forced degration studies
Stress condition % Impurities formed
Oxidative degradation Acid degradation Base degradation Thermal degradation Photolytic degradation A 0.313 3.12 6.23 0.15 0.03 B ND ND ND ND ND C ND ND ND ND ND D 0.02 0.04 0.06 0.25 0.20 Total impurities 5.18 0.867 0.267 0.169 0.201 (ND –Not Detected)
Accuracy and precision
Standard mixtures containing known amounts of TAM, AMS, MBS, BEB, and EMH were prepared and analyzed by HPLC. The accuracy of the method was checked for three different concentration levels
by standard addition technique. Small quantities of impurities (70%, 100% & 130%) were added to the sample and chromatographed. It was found that three additions were accurately reflected in their peak areas. All estimation were repeated (n=3) and standard deviation were calculated. The results were shown in Table‐3.
Table 3: Accuracy Data for synthetic mixtures containing AMS, MBS, BEB and EMH (n=3)
Compound Taken(µg/ml) Found(µg/ml) Recovery%
AMS MBS BEB EMH 51.74 73.91 90.08 52.84 75.49 97.20 52.34 74.77 97.20 52.90 75.57 98.24 53.30 72.19 100.33 50.72 76.60 102.42 48.22 74.76 75.42 50.98 76.61 100.45 103.02 104.44 104.42 96.08 101.47 104.36 92.14 99.99 98.17 96.37 101.37 102.25 The precision of the methods was determined (% RSD) on five replicates injection of a standard solution of TAM and reported. Linearity
Calibration graph (concentration versus peak area) were constructed at different concentration for TAM (0.2‐ 12.8µg/ml), AMS (0.2‐ 1.9 µg/ml), MBS (0.2‐1.9 µg/ml), BEB (0.5‐ 1.9µg/ml) and
EMH (0.2‐ 1.9 µg/ml). Three independent determinations were carried out of each concentration and good linearity was found between the mass integrated responses for each of the examined. Table 4 gives linear equation, mass range and correlation coefficient for all compounds.
Table 4: Linear regression data for TAM and its impurities
Compound Mass range Linear regression Correlation coefficient LOD LOQ
33
Limit of Detection and limit of Quantification
The LOD & LOQ values were calculated for TAM and its impurities based on the noise level respectively, and values are given in Table 4.
Robustness
To determine the robustness, the developed experimental conditions were deliberately altered and the resolution between TAM and its impurities and tailing factor for Tam and its impurities were recorded. The flow rate of mobile phase is 1.5ml/min, to study the effect of flow rate on the resolution; flow was changed +10% to ‐10%. The effect of column temperature on resolution was studied at +5˚C to ‐ 5˚C. The effect of the percent organic solvent ratio on resolution was studied by varying from +2%to‐2%. The effect of the pH of the mobile phase A from +0.2 to ‐0.2. In all the deliberate varied chromatographic conditions (flow rate, column temperature, pH of the mobile phase solution, and composition of organic solvent) the resolution between all pairs of compounds was greater than 2.0 and tailing factor for TAM and its impurities was less than 1.2. The assay variability in the estimation of TAM and its impurities was with in ±10%.
Stability
To determine the stability of TAM, the drug was stored in mobile phase A&B (phosphate buffer pH 6.75& ACN: water 90:1s0 v/v) for 24hrs and chromatographed on the following day. The solution was found to be stable for 24 hrs and observed that three was no degradation / increase in percentage of impurities and also no significant changes were observed. Replicate injections of (n=5) of Tam solution were performed and relative standard of peak area was 0.96‐1.37%.
CONCLUSION
A new, accurate and selective gradient RP‐HPLC method was proposed for the determination of Tamsulosin HCl related substances in Tamsulosin drug substance and validated as per the ICH guidelines. The method was found to be simple, selective, precise, accurate and robust. Therefore, this method can be used as routine testing as well as stability analysis of Tamsulosin HCl drug substance. All statistical results (Percentage, Mean, RSD, Percentage difference and recovery %) were within the acceptance criteria.
ACKNOWLEDGMENT
The authors wish to thank the management of Wockhardt Research centre, Aurangabad for their support and encouragement.
REFERENCES
1. Kawabe K, Ueno A, Takimoto Y, Aso Y, Kato H. Use of an a‐1‐ blocker,YM617, in the treatment of benign prostatic hypertrophy. J. Urol, 1990; 144: 908‐912.
2. Shen H.Illustrated pharmacology memory cards. Pharmnemonics, Minireview. (This set of PharMnemonics cards makes medical pharmacology fun to learn and easy to memorize). Minireview LLC, P.O. Box 260, Twinsburg OH, 44087. 2008; 13.
3. Gizor T, Fogassay E, Balint J, Egri G, Torley J, Demeter A, Grenier L. New practical synthesis of Tamsulosin. Chirality 2000; 20:790‐795,
4. Ksycińska H, Rudzki PJ, Sarosiek A. LC‐MS Determination of Tamsulosin in human plasma and its application to pharmacokinetic study. Acta Pol. Pharm 2006; 63:417‐419 5. Ramakrishna NVS, Vishwottam K N S, Manoj, Koteshwara M,
Wishu S, Varma DP. Rapid simple and highly Sensitive LC‐ ESI‐MS/MS method for the quantification of tamsulosin in human plasma. Biomed. Chromat. 2005; 19:709‐719, 6. Choudhari Vishnu P, Gite Sacchidanand R, Raut Rahul P,
Hable Asawaree A, Parekarsanket R, Kuchekar Bhanudas S. Spectrophotometric simultaneous determination of Dutasteride and Tamsulosin in combined tablet dosage form by first order derivative spectroscopy and area under curve (AUC). Int. J. Pharm. Sci. Rev. Res 2010; 2: 63‐67. 7. Pande VV, Jadhav JN, Chandorkar JG. Simultaneous
estimation of Tamsulosin and Dutasteride in combined dosage form by UV spectroscopy method. J Pharm. Res. 2009;2: 507‐509.
8. Nanda RK, Gaikwad J, Prakash A. Estimation of Tamsulosin HCl and Tolterodine in its pharmaceutical dosage form by spectrophotometric method. Int. J. Pharm. Tech. Res 2009; 3: 420‐423,
9. Meiling Qi, Peng Wang, Rui‐Hua Cong. Determination of the enantiomers of Tamsulosin hydrochloride and its synthetic intermediates by chiral liquid chromatography. Chromatographia 2004; 59: 251‐254.
10. Kasawar GB, Farooqui MN. Stability indicating HPLC method for the determination of chiral purity of R‐(‐)‐5‐(2‐ aminopropyl)‐2‐methoxybenzene sulfonamide. Indian J. Pharm. Sci 2009; 71:533‐537,
11. Sibel AO. Voltametric investigation of Tamsulosin. Talanta 2003; 61:147‐156.
12. Patel Dipti B, Patel V. RP‐HPLC and TLC methods for simultaneous estimation of tamsulosin hydrochloride and finasteride in combined dosage forms. Acta Pharm 2010; 60:197‐205
13. International Conference on Harmonization. ICH.Validation of analytical procedures: Definition and terminology Q2A. Geneva, 1994; 5626: 1‐4.
14. International Conference on Harmonization. ICH. Draft Revised Guidance on impurities in new drug substances federal register. Geneva 2000; 65: 45085‐45090.