World Journal of Advanced Research and Reviews
e-ISSN: 2581-9615, Cross Ref DOI: 10.30574/wjarrJournal homepage:https://www.wjarr.com
Corresponding author E-mail address:
Copyright © 2020 Author(s) retain the copyright of this article. This article is published under the terms of the Creative Commons Attribution Liscense 4.0.
(RESEARCH ARTICLE)
Skinfold thickness, body mass index, waist to hip ratio, and waist to height ratio as a
predictors measurements of common diseases such as diabetes mellitus,
hypertension, and vitamin D deficiency
Elhisadi Tawfeg Awad *, Alsheikh Malak Abd-alhamid and Elgaithy Eman Ibrahem
College of Medical Technology, Department of Public Health-branch of Clinical Nutrition, Derna, Libya.
Publication history: Received on 02 January 2020; revised on 21 January 2020; accepted on 23 January 2020
Article DOI: https://doi.org/10.30574/wjarr.2020.5.1.0001
Abstract
Skinfold thickness is widely used, as a measures fat in the subcutaneous region of the body, which accounts for about 40–60% of total body fat
.
The aim of this study was to quantify the association between anthropometric measurements, skinfold thickness (SFT), body mass index (BMI), waist to hip ratio (WHR), and waist to height ratio (WHtR), with non-communicable diseases such as type 2 diabetes mellitus (T2DM), hypertension (HT), and vitamin D deficiency (VDD), additionally to find which one of these variables are most strongly correlated of these measurements in clinical practice. A hundred women included in this study, of whom as control cases was identified in 65%, who were screen negative for disease, were 35% was detected with non-communicable diseases. Data was entered and analyzed using Statistical Package for Social Sciences (SPSS) version 18. Aged range between 18 to 50 years with mean 34.8 years (±12.1).The mean weight of participants was72.20 kg (±17.9 SD), ranged from 32.90 to 117.30 kg, while the height ranged from 149.00 to 181.00 cm with mean was 162.58 cm (±6.28 SD). The mean BMI was 27.27 kg/m2(±6.67 SD), ranged from 14 to 46 kg/m2.The mean values of SFT included, subscapular, triceps and abdominal thickness were 24.62mm (±10.55), 27.09 mm (±9.25), and 26.22 mm (±9.64) respectively. In this study, a strong association between SFT, and BMI with diabetes was identified, while WHR and WHtR were more predictors of VDD, and HT respectively. SFT, BMI, WHR, and WHtR could be used in clinical practice and public health for suggesting lifestyle modifications.Keywords: Skinfold thickness; BMI; Waist to hip ratio; Waist to height ratio.
1. Introduction
Obesity is a chronic disease which has spread all over the world and threatens public global health [1]. The prevalence of obesity shows a positive secular trend in all age groups in developed or industrialized and developing countries in all continents [2].Obesity was almost two times more common among Libyan women than men, i.e. 21.4% vs. 40.1 % (5,6). Whereas overweight was more among Libyan women (69%) than men (57.5 %) [3].Over-nutrition is increasing not only in urbanized regions but also in developing countries with westernized lifestyles, leading to the accumulation of adverse health effects such as diabetes, dyslipidaemia, coronary heart disease, atherosclerosis, hypertension, high blood cholesterol concentration, stroke, certain cancers and arthritis [4]. Anthropometric measures are widely available for human body composition assessment, anthropometry concerns the measurement of different parts of human body such as bone, muscle, and adipose (fat) tissue. BMI, waist circumference (WC), waist to hip ratio (WHR), waist to height ratio (WHtR), and various skinfold thicknesses have been studied in relation to the health and nutritional status of individuals [5].
74 high compatibility with other methods of direct measurement of body fat mass [6]. Analyzing skinfolds and circumferences measurements was used to determine the relationship between obesity and risk of disease [7]. Skinfold measurement, also known as pinch test, is measured by a caliper at several precise points on the body, and allows to determine subcutaneous fat layer thickness and body fat percentage [8]. An anthropometric measurement used to evaluate nutritional status by estimating the amount of subcutaneous fat. Calibrated calipers are used to measure the thickness of a fold of skin at defined body sites that include upper arm or triceps (TSF), subscapular region (SSF), and upper abdomen. Anthropometric data, (SFT, BMI, WHR and WHtR) provide a general nutritional status of the individual. These data are easy to obtain and can be collected from large populations without much financial burden by trained health care personnel. These data can also complement other established measurements for predicting diseases.
2.Material and methods
A skinfold calliper is used to determine the thickness of a skinfold. Using the measured skinfolds, a prediction of total body fat mass can be done. The measurements are based on the hypothesis that the body fat is equally distributed over the body and that the thickness of the skinfolds is a measure for subcutaneous fat. A case- study was done among 100 individuals Libyan women; of whom as control cases was identified in 65%, were 35% was detected with non-communicable diseases such as HT, T2DM, and VDD. Participants aged range between 18 to 50 years with mean 34.8 years (±12.1). Subjects were interviewed face-to-face by researchers using pretested questionnaires. Anthropometric measures included height, weight; waist and hip circumference were measured according to standard protocols and were recorded. BMI, WHR and WHtR, were calculated according to special formula (WHR: waist circumference "cm"/hip circumference "cm"), WHtR: waist circumference "cm"/ height "cm"). Height was measured in a stand position, without shoes, bulky clothing, and hair ornaments, and unbraid hair that interferes with the measurement. Accurately record the height to the nearest 0.1 centimeter. Body weight was done by digital scale, participants stand with both feet in the center of the scale. Record the weight to the nearest 0.1 g. Height and weight measurements were utilized to determine BMI by using weight (kg) divided by height squared (m2) expressed as kg/m2. The specific tester (called caliper) pinches the skin at the location site and pulls the fold of skin away from the underlying muscle so only the skin and fat tissue is being held. A skinfold caliper is used to assess the skinfold thickness. To estimate the total amount of body fat, three skinfold sites was measured. Triceps skinfold (back side middle upper arm), Subscapular skinfold (under the lowest point of the shoulder blade), and abdominal skinfold thickness. Reference tables can be used to estimate the fat mass and the fat free mass in the body. For this measurement the patient must be able to sit or stand in an upright position. Skinfold measurement are cheap, not very painful. They are easy to perform but need practice, and is dependent upon the skill of the observer. Three reading is taken (to the nearest 0.5 mm) and average is compared to reference standards to assess fat reserves. In women, values less than 16.5 mm suggest undernutrition while values greater than 25.0 mm indicate excessive body fat and overnutrition
.
2.1.Statistical analysis
Data was entered and analyzed using Statistical Package for Social Sciences (SPSS) version 18 (SPSS Inc, Chicago, IL, USA) for Windows. Mean, median and standard deviation (±SD) of the anthropometric data obtained from 18-50 years-old women were calculated. The descriptive statistics was used to assess the association between categorical variables. The same data of all participants were also entered in Microsoft Excel 2003. The results were considered statistically significant when p value was < 0.05. The anthropometric indices of WHR, WHtR, and WC were calculated and compared with standard reference and BMI- based on percentage of reference median using the 2007 WHO reference
.
3.Results and discussion
75
Table 1 Anthropometric characteristics of the subjects according to disease groups
Diseases BMI(kg/m2) Kg/m2
SFT (mm) WHR(cm)
(cm)
WHtR(cm) (cm)
Tri Sub Abd
Control 25.5 24.7 22.1 22.3 0.86 0.46
HT 28.8 27.2 24.8 27.2 1.06 0.56
T2DM 32.5 38.3 33.4 31.1 0.97 0.55
VDD 27.8 27.5 25.0 24.5 1.16 0.55
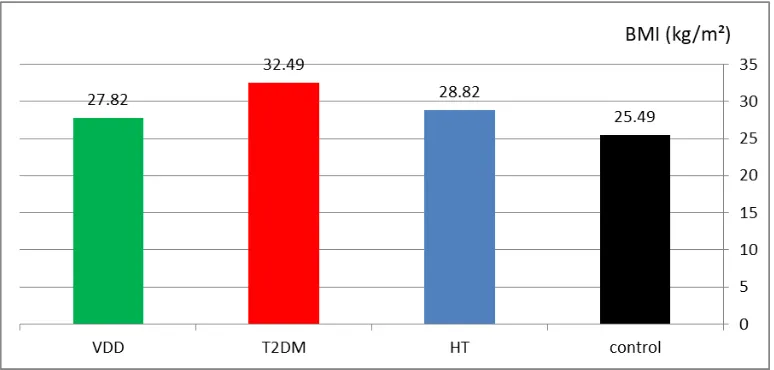
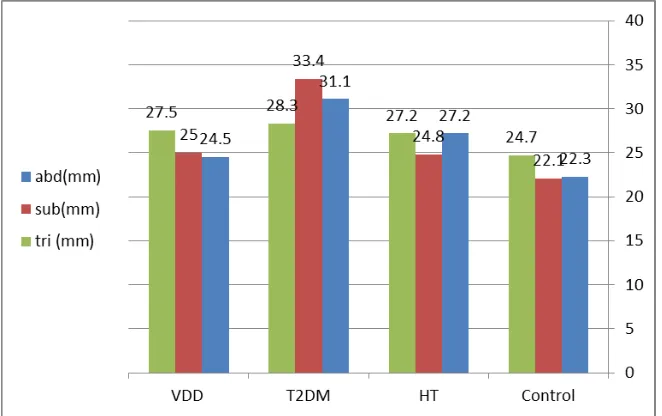
From the data collected it was found that SFT was found significantly value (p<0.05) with T2DM in all three sites of measurements. Our findings of the study showed the values measurements of SFT and BMI were highest in the group of T2DM (P<0.00), followed by those with HT, and lowest in those with control case as show in figure 1. Increased of SFT was consistent with increased BMI, this increased was observed among T2DM group. Excess adiposity assessed by skinfolds successfully associates in women with increased insulin resistance and HT. The results obtained in the present research revealed that there is a positive significant value between BMI and HT (p<0.004), but there is no significant value between BMI and VDD, (P>0.05).
Figure 1 Comparison of BMI between cases (n=100) according to diseases types.
76
Figure 2 Comparison of SFT between cases (n=100) according to diseases types.
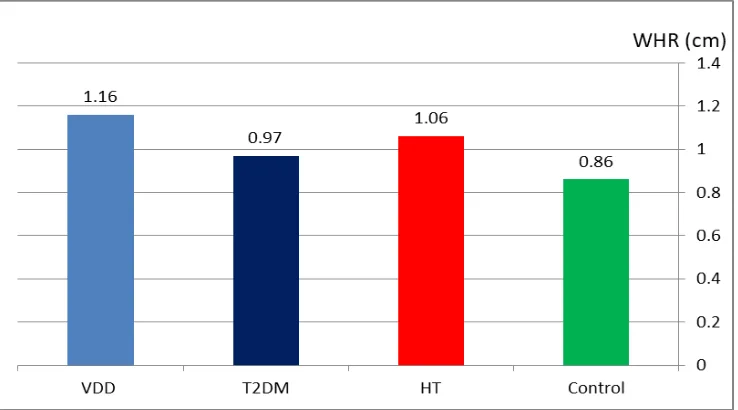
The WHtR was the predictor with the best discriminatory power, in terms of hypertensive risk screening for female population age 18-50 years in target population as show in figure 3. This results is agreement with previous study indicate that the WHtR is a good discriminator of cardiovascular disease risk factors [10]. In the present study, WHR as a bitter significant and a strong relationship of VDD (p<0.03) compared to BMI, and SFT (P>0.05) as show in figure 4. The study revealed that control case had a lower BMI, SFT, WHR, and WHtR. In this study, SFT showed a significant positive association with body mass index (BMI) in relation to T2DM. The results clearly demonstrates that BMI and skinfold thickness is the strongest anthropometric index that associates with T2DM. And these parameters should be used in routine practice for the follow up of patients with T2DM. There was a weak negative relationship between the SFT and VDD group.
77
Figure 4 Comparison of WHR between cases (n=100) according to diseases types.
Further research is required to understand other factors which may affect the issue of HT, T2DM, and VDD, and to design interventions based on these predictors in order to prevent diseases occurrence.
4.Conclusion
The body mass index (BMI) is the most traditional method for defining overweight and obesity, but various measures of obesity, e.g., WHR, WHtR and SFT, have been employed to explore this relation [11]. We observed that among diabetics women the mean of SFT (34.26 mm), and BMI (32.5 kg/m2) were significantly high compared to non-diabetics (p<0.05). This research revealed that SFT and BMI a very good positive association with T2DM, while WHtR was found a good predictor of HT. WHR as a bitter significant and a strong relationship of VDD but negative relation with T2DM and HT. Anthropometric measurements may be used in screening programs and further studies are necessary to validate and expand these results.
Compliance with ethical standards
Acknowledgments
The authors would like to appreciate all subjects who participated in the present study.
Disclosure of conflict of interest
The authors have no conflicts of interest to declare.
References
[1] Ogden CL, Carroll MD, Curtin LR, McDowell MA, Tabak CJ and Flegal KM. (2006). Prevalence of overweight and obesity in the United States, 1999-2004. JAMA, 295(13), 1549-55.
[2] Uauy R, Albala C and Kain J. (2001). Obesity trends in Latin America transiting from under-to overweight. J Nutr, 131, 893S-9S.
[3] Nura N, Altajori Yousef M and Elshrek. (2017). Review Article: Risk Factors for Non-communicable Diseases in Libya. The Egyptian Journal of Hospital Medicine, 66, 202-214.
[4] Van de SS, Pereira FR and Cintra DE. (2011). Partial reversibility of hypothalamic dysfunction and changes in brain activity after body mass reduction in obese subjects. Diabetes, 60, 1699-704.
78 [6] Maria Dolores Marrodan. ( 2015). Subscapular and triceps skinfolds reference values of Hispanic American children and adolescents and their comparison with the reference of Centers for Disease Control and Prevention (CDC). NutrHosp, 32(6), 2862-2873.
[7] Ramirez-Zea M, Torun B, Martorell R, et al. (2006). Anthropometric predictors of body fat as measured by hydrostatic weighing in Guatemalan adults. Am J ClinNutr, 83,795-802.
[8] Sarria A, Garcia-Llop LA, Moreno LA, et al. (1998). Skinfold thickness measurements are better predictors of body fat percentage than body mass index in male Spanish children and adolescents. Eur J Clin Nutr, 52, 573-6. [9] A Awasthi, CR Rao, DSHegde and K Rao N. (2017). Association between type 2 diabetes mellitus and
anthropometric measurements – a case control study in South India. J PREV MED HYG, 58, E56-E6.
[10] Lee CM, Huxley RR, Wildman RP and Woodward M. (2008). Indices of abdominal obesity are better discriminators of cardiovascular risk factors than BMI: a meta-analysis. J Clin Epidemiol, 61, 646–653.
[11] Yusuf S, Hawken S, Ounpuu S, Dans T, Avezum A, Lanas F, McQueen M, Budaj A, Pais P, Varigos J and Lisheng L. (2004). Effect of potentially modifiable risk factors associated with myocardial infarction in 52 countries (the INTERHEART study): case-control study. Lancet, 364,937–952.
How to cite this article