375
Int. J. Data Envelopment Analysis (ISSN 2345-458X)
Vol.2, No.2, Year 2014 Article ID IJDEA-00223, 6 pages
Research Article
An Algorithm for Resource Allocation through the
Classification of DMUs
M. Ahadzadeh Namina*, N. Ebrahimkhani Ghazib
(a) Department of Mathematics, Shahr-e –Qods Branch, Islamic Azad University, Tehran, Iran.
(b) Department of Mathematics, Science and Research Branch, Islamic Azad University, Tehran,
Iran.
Received 10 January 2014, Revised 20 May 2014, Accepted 02 June 2014
Abstract
Data envelopment analysis (DEA) is a non-parametric method for assessing relative efficiency of
decision-making units (DMUs). Every single decision-maker with the use of inputs produces outputs.
These decision-making units will be defined by the production possibility set. Resource allocation to
DMUs is one of the concerns of managers since managers can employ the results of this process to
allocate resources in organizations appropriately and sufficiently and as a result achieve the lowest cost
and highest level of profit. In this paper we will suggest an algorithm to select such efficient decision
making units.
Keywords: DEA, classification, resource allocation, context-dependent.
1. Introduction
A mathematical programming method called Data envelopment analysis (DEA) measuring the relative efficiency of decision making units (DMUs) with multiple outputs and multiple inputs was
introduced by Charnes, Cooper and Rhodes (CCR) [2]. In fact, a set of DMUs can be separated into different levels of efficient frontiers [4] which could be drawn on by managers to make efficient
* Corresponding author: [email protected]
decisions regarding resource allocation. In fact an important part of all businesses is resource allocation
[7] which is typically set annually. The question is how to allocate resources? There are so many ways
to answer this question. Basically clustering can solve the problem of grouping similar observations of
a data set into the same cluster and dissimilar units into different clusters. The problem of [6] clustering
high dimensional data is investigated by many research studies in many different fields. For identifying
different classes of high dimensional data Amin G.R et al., 2011[1] suggested a data envelopment
analysis (DEA) clustering approach. First, we use these clusters to allocate the infinite budget. With
comprising the cost and revenue efficiency [5] for each cluster, allocation resource [3] has come under
closer scrutiny. We have organized the rest of the paper as follows: the second section presents the new
algorithm. Then the cost and revenue model is incorporated into the algorithm. We demonstrate our
approach by applying it to a data set consisting of 15 DMUs with two inputs and one output.
2. An Algorithm for Resource Allocation
In this section we provide an algorithm to find a bunch of DMUs which have the lowest cost and most
profit when source B allocated to DMUs.
Suppose that there are n decision making units,DMU ,j that use inputs X to produce outputs Y, that:
j 1 j 2 j mj
j 1 j 2 j sj
X
(x , x ,..., x )
Y
(y , y ,..., y )
Step1: Find the efficiency value of DMUs with using the following model (CCR).
s
r rk r 1
s m
r rj i ij
r 1 i 1
m
i ik i 1
r i
Max
u y
(1)
s.t.
u y
v x
0,
j
1, 2,..., n
v x
1
u
,
v
, r
1, 2,..., s; i
1, 2,..., m
That, k{1, 2,..., n}. Suppose that:
* * *
j j
E set of DMU s that have 1, (U , V )0
* * *
j j
E set of DMU s that have 1, (U , V )0
j
R set of DMU s that have zero weight at least one index
Step 2: The frontier of production possibility set is DMUs on efficient set E, that satisfied in:
s m
* *
1M 2 M mM 1M 2 M sM r rM i iM r 1 i 1
PF(M) f (x , x ,..., x , y , y ,..., y ) u y v x 0
Such
* *
(U , V ) are the weights when DMUM is evaluated. Frontiers of production possibility set are
called PF(1), PF(2),..., PF(M),..., PF(p) .
If DMUkEsatisfies in
s m
* * *
r rk i k ik
r 1 i 1
u y
v
x
0
constraints, where
* k
is the optimal solution
and
* * * * * * 1 2 s 1 2 m
(u , u ,..., u , v , v ,..., v )
are the optimal weights when DMUM is evaluated.
Then, put DMUk in C(M) classification. Suppose that C(1), C(2),..., C(M),..., C(P) are the existence
classifications.
Step 3: If DMUkR, then we can say that DMUk needs revaluating for finding its classification.
For achieving this aim, calculate the distances of DMUk from all PPS frontiers (that means:
PF(1), PF(2),..., PF(M),..., PF(p) ). Suppose that the distances of DMUk from frontiers,
PF(1), PF(2),..., PF(M),..., PF(p) , are d , d ,..., d1k 2k Mk,..., dpk, respectively.
Step 4: Putd (k )Z * Max{d , d ,..., d1k 2k Mk,..., d }pk , clearly Z{1,..., M,..., p}. Then we can put
k
DMU
in C(Z) classification.
Step 5: Use the cost-profit model with B source for each bunch of DMUs in classifications
C(1), C(2), ..., C(M),..., C(P) .
Step 6: Each DMUs classification which has the lowest cost efficiency and upper profit efficiency
introduces a bunch of DMUs that source B can beallocated for them.
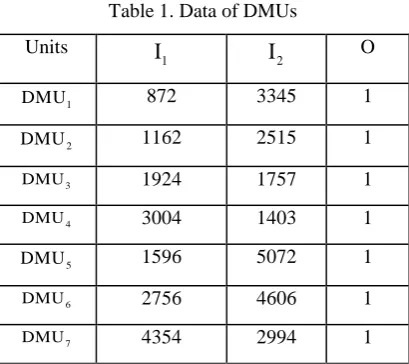
Table 1. Data of DMUs Units
1
I I2 O
1
DMU 872 3345 1
2
DMU 1162 2515 1
3
DMU 1924 1757 1
4
DMU 3004 1403 1
5
DMU 1596 5072 1
6
DMU 2756 4606 1
7
Table1.(continued)
8
DMU 4006 4550 1
9
DMU 1089 6359 1
10
DMU 5267 1892 1
11
DMU 7644 3183 1
12
DMU 1217 5774 1
13
DMU 1556 2123 1
14
DMU 2222 1659 1
15
DMU 2607 1546 1
3. Example
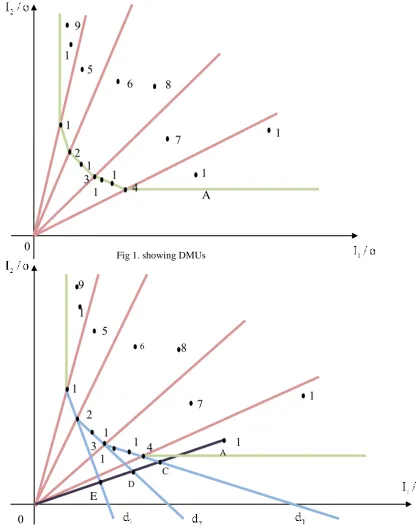
Suppose that we have 15 DMUs with two inputs and one output that shows in Fig 1 (see table1). By
using model (1) we have:
1 2 3 4 13 14 15
5 6 8 7
9 10 11 12
E DMU , DMU , DMU , DMU , DMU , DMU , DMU E DMU , DMU , DMU , DMU
R DMU , DMU , DMU , DMU
Clearly there are classifications for DMUs, that means:
Class 1: DMU , DMU1 2
Class 2: DMU , DMU , DMU2 3 13
Class 3: DMU , DMU , DMU , DMU3 4 14 15
The PPS frontiers which are made by the above DMUs show that clearlyDMU5is projected on the frontiers of class1, thus DMU5 is put in class 1. Then we have
Class 1: DMU , DMU , DMU1 2 5
Class 2: DMU , DMU , DMU , DMU , DMU2 3 13 6 8
Class 3: DMU , DMU , DMU , DMU3 14 15 7
To find classifications of DMU , DMU , DMU , DMU9 10 11 12 it is enough to calculate distances from these DMUs to the frontiers of PPS with input oriented form and follow the step3, because these DMUs
have at least one zero weight (See fig2).
IfDMU10 (X , XA1 A 2) and C(d .X , d .Xc A1 c A 2) , D(d .X , d .XD A1 D A 2), E(d .X , d .XE A1 E A 2)
Class 1: DMU , DMU , DMU , DMU , DMU1 2 5 9 12
Class 2: DMU , DMU , DMU , DMU , DMU2 3 13 6 8
Class 3: DMU , DMU , DMU , DMU , DMU , DMU3 14 15 7 10 11
Then,use model 2 for each classification groups until finding a group of DMUs classification that
have lowest cost and upper profit efficiency when allocated B source.
Fig 2. Image of DMU 10 in all frontiers of PPS
1
1
8
6
5
9
1
2
1
7
1
0
A
C
D
E
2
1
3
3
1
4
5
1
4
0
Fig 1. showing DMUs
1
1
8
6
5
9
1
2
1
7
1
0
A
2
1
3
3
4
1
5
1
4
4. Conclusion
Sometimes in some organizations, there are fixed and limited sources and the need of
allocating resources to some DMUs is important. In this paper we suggested an algorithm that
helps to find a bunch of decision making units and logically allocate resource B for them while
the lowest cost and upper profit efficiency in comparison with other classifications is evaluated.
Then we gave
an example to demonstrate the suggested algorithm. With the help of the
algorithm figures we reached our goal and our approach proved to be successful.
References
[1] Amin G.R, Emrouznejad A. Rezaei S., (2011). Some clarifications on the DEA clustering approach,
European Journal of Operational Research, 215, 498-501.
[2] Charnes A, Cooper WW, Rhodes E, (1978). Measuring the efficiency of decision making units.
European Journal of Operational Research; 2:429–44.
[3] Leonard, S.T., Droege, M., 2008. The uses and benefits of cluster analysis in pharmacy research.
Research in Social and Administrative Pharmacy 4, 1–11.
[4] Seiford LM, Zhu J., (2003). Context- dependent data envelopment Analysis: measuring
attractiveness and progress, QMEGA, 3(5), 397-408.
[5] Quanling Wei., Tsung-Sheng Chang., (2011). Optimal profit-maximizing system design data
envelopment analysis models. Computer & Industrial Engineering, 1275-1284.
[6] Tversky A., Simonson I., (1993). Context-dependent preferences. Management sciences. 39, 1179-
89.
[7] Yan, H., Wei, Q. L., & Hao, G. (2002). DEA models for resource reallocation and production