56
On the behavior of a large scale tumbling vortex flow
submitted to compression
J. Borée*, D. Marc* and R. Bazile
B. Lecordier**
* I.M.F.T. ; UMR CNRS/INPT-UPS 5502 Allée du Professeur Camille Soula
31400 TOULOUSE, FRANCE ** CORIA ; UMR 6614 CNRS-Université & INSA de Rouen,
76821 Mont Saint Aignan, France Abstract
An analysis of the disruption of a compressed tumbling vortex is proposed here. This situation is typical of in-cylinder flows developing in combustion chambers of premixed spark ignition engines. In an inviscid fluid, we discuss analytically the motion of a point vortex of constant intensity submitted to compression in a time dependant rectangular domain. A relevant non-dimensional number comparing the vortex time scale and the compression time scale is obtained. We show that the compression unsteadiness is expected to delay the viscous response of the near-wall flow.
The temporal evolution of a tumbling motion is then measured with high-speed particle image velocimetry in a model square piston compression machine. The experimental set-up and the measurement procedure are presented. The data provide a clear picture of the evolution and disruption of the compressed vortex. A physical analysis is proposed and we prove that elliptical instability and interaction with walls are the main mechanisms that lead to the generation of a three-dimensional unstructured velocity field.
1 INTRODUCTION
A production of small turbulent scales from a basic organized flow is a typical feature of compressed tumbling motion in combustion chambers of premixed spark ignition engines (Hill and Zhang 1994). The tumbling motion is a rotating flow which axis is perpendicular to the cylinder axis and is generated during the admission phase. A complex "vortex breakdown" occurs during the compression phase and results in the generation of a significant turbulence level. This feature is used to obtain a shorter combustion period, to widen air/fuel ratio limits in engines and is linked with present environmental preoccupations. The reasons for the disruption of the vortex are not yet fully understood. The geometry and boundary conditions are very complex in a real engine. Moreover, precise and resolved data are difficult to obtain. It is therefore always intricate to isolate a given physical mechanism.
A model (quasi-)bidimensional situation is studied at IMFT to focus on the vortex/compression interaction in a simpler domain and with better-resolved boundary conditions. The first goal of this paper is to discuss an analytical solution for the motion of a point vortex of constant intensity submitted to compression in an inviscid fluid in a time dependant rectangular domain. We will quantify the influence of the compression unsteadiness on the precession of the vortex and on the pressure gradient induced by the vortex along the walls.
We will then focus on the description and analysis of the time resolved in-cycle velocity fields measured by Particle Image Velocimetry (PIV) in a square piston compression machine specially adapted to the study. These data provide a good qualitative understanding of the evolution of the compressed tumble and a scenario will be proposed to analyze the clear disruption and the transition to a three-dimensional unstructured velocity field observed during the compression.
2 ANALYTICAL SOLUTION FOR COMPRESSED POINT VORTEX
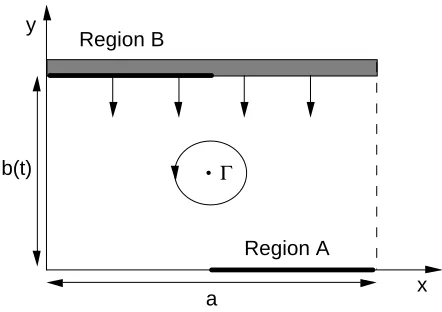
The situation considered in this part is sketched in figure 1. The point vortex of intensity Γ moves in an inviscid fluid. The domain is rectangular and its aspect ratio b(t ) / a varies during the compression. In the low Mach number approximation, the flow divergence is uniform in the domain with, as the total mass of gas is constant :
b
b
dt
d
=
−
=
∇
ρ
ρ
1
.V
wheredt
db
b
=
(1)Following (Batchelor 1967), the velocity field V of the compressed flow is the sum of two contributions V=V0+V1 . V0 is the solenoidal and irrotational flow induced by the point vortex in the bounded domain at time t and V1 is the velocity field induced by the dilatation rate at time t satisfying:
∇
.V
1=
b
b
and ∇ ×V1=0 .The stream function ψ0 of the velocity field V0 is an infinite sum of elementary stream functions corresponding to the point vortex itself and four classes of images. It can be conveniently expressed in term of elliptical functions (Choi and Humphrey 1984). The computation of V1 is straightforward. In non-dimensional form, we use respectively b , Γ b and b2 Γ as length, velocity and time scales. The length scale b is chosen here as a measure of the distance between the vortex and the nearest wall which changes during the compression. Γ b is an order of magnitude of the velocity induced by the vortex on the upper
and lower near walls while b2 Γ represents a typical turnover time scale.
The two non-dimensional velocity components U
( )
*, V* write for x, y( )
≠(
xv, yv)
:(
) (
)
(
) (
* * * * *)
* 0 * * * * * * * * * 0 * * * *)
(
,
,
,
,
,
,
)
(
,
,
,
,
,
,
y
b
b
a
t
b
y
x
y
x
V
t
y
x
V
a
t
b
y
x
y
x
U
t
y
x
U
v v v v
Γ
+
=
=
(2)xv, yv
(
)
is the instantaneous location of the point vortex. The displacement of the point vortex is induced by all its images and by the dilatation component with :( ) (
)
( ) (
* * *)
* 0 * * * * * 0 * *)
(
,
,
)
(
,
,
v v v v v v v v vy
b
b
a
t
b
y
x
V
t
V
a
t
b
y
x
U
t
U
Γ
+
=
=
(3)The solution is particularly simple when the point vortex is initially at the center of the domain. The dilatation component just maintain it at the center of the time varying domain at all times with
U*v0 =Vv0* =0 and x
(
v, yv)
=(
0. 5a, 0. 5 b(t))
.The non-dimensional number
N
c=
b
b
Γ
is the ratio of the vortex time scale tv =b2 Γ and of thecompression time scale
t
c=
b
b
. To give an example of compression/precession interaction, the displacement of the point vortex computed for two different compression speeds is displayed in figure 2. In the computations presented, the movement of the "piston" is sinusoidal withb(t ) / a= ε +
[
(
1)
+ ε −(
1)
cos(ωt )]
2ε from b(0) / a=1 to b(tf) / a=1ε =0. 2 . ε is the compression ratio.Ncmax is the maximum value of Nc obtained for θ = ωt≈65°. The vortex is initially non-centered with
xv*, yv*
(
)
=(
0. 6, 0. 6)
. Its trajectory is computed numerically by a fourth order Runge-Kutta integration. The compression is exactly taken into account by working with the rescaled coordinatesx,η, t
(
)
=(
x , y b(0) b(t ) ,t)
. The NAG library is used to compute the elliptic functions.If tv <<tc (figure 2a), the vortex dynamic clearly dominates and a quasi-steady precession is observed. On
the contrary, if tv≈tc, the compression is fast enough to prevent a significant precession as the piston
In viscous flows for no-slip walls, we know that near wall flow separation occurs in region of adverse pressure gradient (Tritton 1988). These potential flow calculations can be used as a first step to understand the effect of compression on the pressure gradient at the wall (Doligalski , Smith, and Walker 1994). In steady situation, on the bottom wall and for a positive circulation, region A of figure 1 is a region of adverse pressure gradient and this pressure gradient increases as
b
decreases (Borée, Corjon, and Marc 1997).During the compression, the pressure gradient induced along the piston wall or along the opposite stationary wall writes:
−1 ρ∂
p
∂x =
∂U0 ∂t + U0
∂U0
∂x (4)
The second term of the right hand side of (4) is a quasi-steady contribution (velocity field V0) for a box of aspect ratio b(t ) / a . The first term is an unsteady contribution due to the temporal increase of the velocity induced by the vortex and its image system at the wall. This unsteady term is thus expected to add a favorable pressure gradient that may eventually dominates.
As an example, we show in figure 3 the evolution of the pressure gradient along the bottom wall for various compression speeds (Γ>0). G is the pressure gradient normalized by its maximum value for a quasi-steady evolution corresponding to
0
max
=
c
N
also plotted in fig. 3. The point vortex is centered and no precession occurs. At the highest degree of unsteadiness, figure 3 shows clearly that both the magnitude of the adverse pressure gradient and the extend of the region of adverse pressure gradient is significantly reduced when compression speed increases.A rapid compression is thus expected to delay and to modify the near wall flow separation. In such cases, an abrupt viscous response of the near wall flow is expected when the piston slows down at the end of the compression phase with
b
and thus Nc tending toward zero. For a non centered initial point vortex, the location of the pressure gradient maximum at the wall is time dependant and the boundary layer response will depends on the initial point vortex position in a complex way.A first evaluation (Marc 1998) shows that the usual value of
max
c
N
encountered in engines and in the model compression machine presented below is lower than 0.1. The dynamic of the vortex is therefore expected to dominate.3 EXPERIMENTAL ARRANGEMENT
a- Compression Chamber
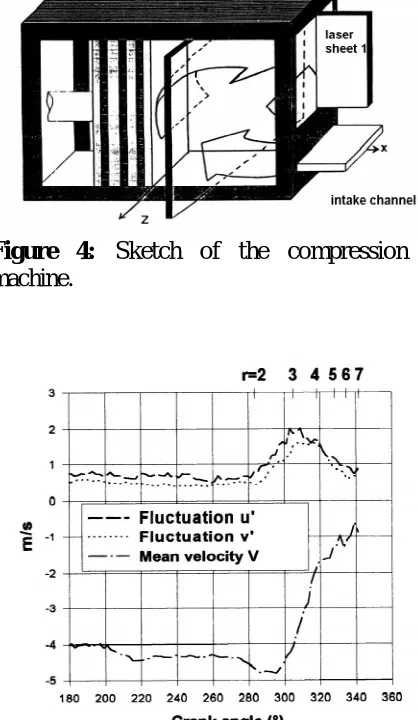
The compression engine available at IMFT has a square cylinder (100 x 100 mm2) equipped with a flat head (see (Marc 1998) for a complete technical description). The distance between the piston and cylinder head at Bottom Dead Center (BDC) is H=100 mm. The present data have been obtained with a volumetric ratio of ε=10 corresponding to a stroke of the piston of 90 mm. The optical access and PIV laser sheets orientations are sketched in figure 4. Laser sheet 1 (LS1) is perpendicular to the axis of the tumble and lights the upper 60% of the compression chamber. Laser sheet 2 (LS2) is parallel to the axis of the tumble. The piston is driven at 200 rpm by an alternative machine tool and the maximum piston velocity reaches one meter per second. A magnetic ruler fixed on the machine tool accurately measures the location of the piston within the chamber. It is therefore possible to perform statistical PIV and LDV (Laser Doppler Velocimetry) measurements at a given position of the piston in the ‘intake-compression’ phases.
The intake system is a portion of a flat channel (length : Le = 150 mm); the ratio width/height is equal to 9.6 (he x le = 10 x 96 mm) which is sufficient to ensure the bidimensionality of the flow over a large part – 80% – of the intake channel. A "guillotine device" the motion of which is directly controlled by the machine tool closes the intake port. A particular development was necessary to obtain an airtight device. During the intake phase, the bidimensional intake jet flow, tangential to the cylinder floor, is deflected by the moving piston and generates the tumbling vortex.
High-speed particle image velocimetry (PIV) is used to measure gas velocity during one individual cycle of compression. PIV is an optical diagnostic based on the recording with a two dimensional sensor of the light scattered by fine particles passing through a thin light sheet illuminating a seeded flow. The local particle velocity are obtained in most cases by cross-correlating small corresponding windows taken from two frozen images of particle field recorded in a short time delay (Willert and Gharib 1991).
In this experiment, the intake air is seeded with fine oil droplets that do not modify the fluid properties while being able to track accurately the fluid motion. The illumination source is a copper vapor laser (ACL 45W Oxford Laser). This laser is pulsed with an adjustable repetition rate up to 10 kHz. Mean pulse energies are 6.5 mJ at wavelengths of 510.6 nm and 578.2 nm and their duration lies between 10 ns and 60 ns. A 35 mm drum camera (CORDIN 350) viewing perpendicular to the laser sheet records light scattered by seeding particles with an acquisition rate up to 8000 frames/s. The film type is ILFORD HP5+, developed to its nominal speed of 400 ASA with KODAK TMAX developer. To extract quantitative information from images of particle on the negative, a high-resolution film scanner (KODAK RFS 2035) is used. To apply a cross-correlation approach, concerns peculiars to film support and the digitalization stage have to be taken into account. A special film holder was designed to fit in the scanner in order to translate the film accurately and to press it between two strip of glass. Each image of particle on the film was digitized in 8 bits with a 2000 dpi spatial resolution. Each image consists in 1400x1050 pixels with a resolution of approximately 20 pixels/mm.
The fixed length of the drum (80 cm) and the high speed rate of the laser pulses (8000 Hz) limit the total duration of film exposure to about 6 ms (50 images). The characteristic time of the intake/compression stroke being 300 ms, a specific synchronization device has been developed to drive both laser and camera. The seeded flow is exposed by sets of 3 shots. The time interval between two groups of shots is an integer number of drum rotation plus time needed not to overlap the shots. The complete cycle "history'' is then deduced from twelve sets of 3 images.
The velocity fields are obtained by cross-correlating two successive images of a same set. The size of interrogation windows is 32 pixels. In addition to the conventional "sub-pixel" approach to measure particle displacement with accuracy, an original management of the interrogating cells (shifting and orientation) developed by Lecordier (Lecordier 1997; Lecordier, Mouqallid, and Trinité 1994) is used to be able to track large particle displacements and to reduce effects of velocity gradient and out-off pattern motion on velocity measurements.
4 TEMPORAL EVOLUTION OF THE FLOW FIELD
a- Tumbling Flow at the end of the intake phase (BDC)
Figures 6a and 7a show instantaneous velocity fields measured at the end of the intake stroke. A clear large-scale vortex is generated. The Reynolds number based on the maximum velocity and vortex radius is approximately Re=16000 . The core of the vortex is non-centered and its location is cycle dependent. The
"compression number"
max
c
N
can be estimated with0
.
04
max
=
c
N
. A quasi-steady effect of compression is therefore expected. A mean phase averaged vortex has been deduced from 100 independent realizations. It has a quasi Gaussian mean vorticity profile near the core and is of Lamb-Oseen type. The phase-averaged location of the center of the tumbling motion at BDC differs slightly from the geometric center of the chamber with x(
c, yc)
≈(
4.8, 4. 8)
. The rms. distance from the phase-averaged center is dc≈3mm .The front view of figure 7a shows that the instantaneous structure is quasi-bidimensional. The evident perturbations are due to the turbulence carried by the tumble. The phase averaged front mean velocity field not shown here is indeed bidimensional. The secondary flows induced along the fixed lateral end walls by the rotation of the main flow (Ekman flows) have been evaluated (Marc 1998) and are expected to be weak. b Evolution of the flow field during the compression
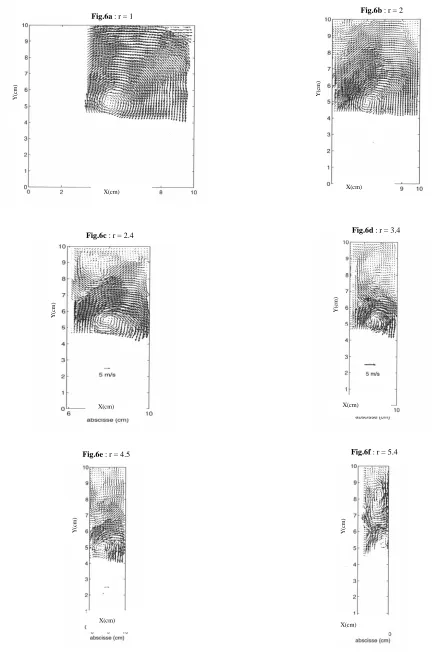
evolution of ensemble mean and rms. velocities measured by Laser Doppler Velocimetry at the geometric center of the clearance volume during the compression stroke are displayed in figure 5. These statistical data are based on more than 100 cycles corresponding to a minimum of 500 data per CA°. Fluctuations generated by the intake jet first undergo a slight decrease. At the same time, the reduction of the cylinder volume by the moving piston gives rise to higher tumble velocity. Looking at this graph only, the breakdown process of the tumble would be said to occur after ε=2 corresponding to 285 °CA (Crank Angle). This explains the rapid decrease of the tangential velocity to reach a zero value and the correlated significant increase of the turbulence intensity up to 2 m/s. LDV measurements performed systematically in the chamber (Marc, Borée, Bazile, and Charnay 1997) however show that the ensemble turbulence is significantly inhomogeneous.
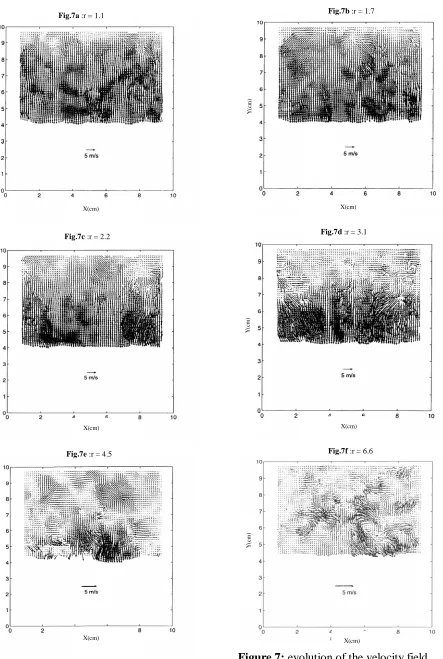
In cycle PIV is an interesting tool to follow the evolution of the tumbling motion of figure 6a during the compression (fig. 6). The piston is nearly halfway in figure 6b with r(t)=xp(0) xp(t)=2 ( xp(t) is the instantaneous location of the piston). One sees that the core of the vortex has significantly moved. The streamlines surrounding the vortex core are clearly elliptical with an aspect ratio of order two. Moreover, a separation region is detected along the wall of the piston in the region of adverse pressure gradient induced by the vortex. At r(t)=3. 4 , (fig. 6d), the separated region has contaminated the upper region and the perturbed main vortex is confined in the central region of the chamber. The separation process has induced a secondary flow. PIV fields are difficult to obtain in the symmetry plane LS1 for r(t)>5 because reflections of the laser light on the piston wall prevent good contrast to be achieved.
The front view PIV velocity fields of figure 7 correspond to another cycle. Starting from a quasi-2D structure (fig. 7a, 7b), the upper region of fig. 7d (r(t)=3.1) shows a cut through the separated region. Again, one sees that the flow in this region is mainly three-dimensional in contrast with what is assumed in 2D computations. A bidimensional computation of this compression phase (Le Roy 1998) would indeed predict a secondary structure of much greater strength and organization. The interface between the main structure and the recirculation region is distorted and is believed to be a significant source of perturbation of centrifugal type (Bradshaw 1969). Moreover, the main structure doesn't appear to be bidimensional as velocity vectors on the right and left sides are tilted toward the center of the box. The clear distortion of the streamlines is thus expected to be a consequence of a 3D distortion of the core of the vortex. The wavelength of the distortion deduced from this figure should scale with the width of the box.
The main organized structure is no longer detected at r(t)=6.6 in figure 7f. The flow measured in plane LS2 is the signature of an unstructured three-dimensional flow. (Marc 1998) has studied the statistics of this turbulent field by computing phase-averaged statistics of PIV fields. The spatial inhomogeneity of the fluctuating velocity is reduced at this compression ratio. The turbulence intensity at the end of the compression phase (TDC) is high and of the order of the mean piston speed Vp with u'≈Vp≈0.6 m / s .
The history of the tumbling motion during the compression stroke contributes a significant portion of this high level. PIV zooms were used to compute the two-point correlation in the front plane and to evaluate the associated integral length scales. One finds L≈5 mm at r(t)=7 .
c Physical analysis of the disruption of the vortex
In-cycle measurements displayed previously are used to analyze possible physical mechanisms responsible for the disruption of the tumbling vortex. Recall that, with
0
.
04
max
=
c
N
, the compression is seen as a quasi-steady phenomenon by the vortex flow. Geometrical effects and confinement of the structure are therefore expected to play an important role.One can note that the transition from a quasi-2D flow to an unstructured flow is observed for 2.<r(t)<6. in the present experiment. Moreover, figure 6b and 6c show that the streamlines of the confined basic flow become elliptical as the piston progresses. The time scale τe of the exponential growth rate of the energy
of the perturbation in the linear regime is evaluated in appendix A by using the results of (Lundgren and Mansour 1996). The value of
τ
e estimated for the present situation is τe≈7 ms .τ
e is one order ofmagnitude smaller than the duration of the compression stroke τc≈146 ms . Elliptical instability has
therefore enough time to develop and is expected to result in a strong and rapid distortion of the core of the vortex.
This instability mechanism is however not alone in the present flow as near wall flow separation has been shown to be induced by the main vortex. The interaction with the separation region is a source of centrifugal instability (see figure 7d). Moreover, numerical simulations (Borée et al. 1997; Le Roy 1998) have shown that any sinusoidal large scale distortion of the tumbling motion leads after near wall separation to significantly curved secondary vortices interacting with the main structure. The interaction with walls therefore play an important role in the further non linear evolution of the initial structure and in the generation of smaller turbulent scales from the confined, naturally unstable, elliptical vortex of figure 6b.
5 CONCLUSION
An analysis of the evolution of a large-scale quasi-bidimensional tumbling vortex flow submitted to compression has been proposed in this paper.
In an inviscid fluid, an analytical solution has been obtained to discuss the motion of a point vortex of constant intensity compressed in a time dependant rectangular domain. A relevant non-dimensional number
max
c
N
comparing the vortex time scale and the compression time scale is obtained and the displacement of the point vortex is displayed for representativemax
c
N
. If1
max
<<
c
N
the vortex dynamic clearly dominates and a quasi-steady precession is observed. On the contrary, if1
max
≈
c
N
, the compression is fast enough to prevent a significant precession as the piston moves. Moreover, for values ofmax
c
N
, of order one, we have shown that compression unsteadiness has a noticeable influence on the value of the pressure gradient along the wall of the cylinder and is expected to delay the viscous response of the near wall flow.Time resolved in-cycle velocity fields were measured by Particle Image Velocimetry in a square piston compression machine specially adapted to the study. A large amount of work was needed to develop this model compression machine and to adapt high speed PIV to this situation. At the end of the intake stroke, a clear large-scale tumbling motion is measured and the instantaneous structure is quasi-bidimensional. At the middle of the compression stroke, we show a distortion of the core of the vortex, which display approximately elliptical streamlines. Moreover, a separation region is detected along the wall of the piston in the region of adverse pressure gradient induced by the vortex. The transition from a quasi-2D flow to an unstructured flow is observed for 2.<r(t)<6. .
A scenario is proposed to analyze this evolution. At mid-compression r(t)=2. , we prove that the growth time scale of elliptical instability is one order of magnitude smaller than the duration of the compression stroke. Moreover, PIV velocity fields show that interaction with walls are important in the further non linear evolution of the initial structure and in the generation of smaller turbulent scales from the confined, naturally unstable tumbling motion. To complete this approach, a complete statistical analysis can be found in (Marc 1998) and comparisons with numerical predictions using one point closures can be found in (Le Roy and Le Penven 1997).
Acknowledgements
References
Batchelor, G.K. 1967 An introduction to fluid dynamics. Cambridge University Press.
Borée, J., Corjon, A. & Marc, D. 1997 Analytical and direct numerical study of the evolution and breakdown of a compressed tumbling vortex. In 11th Symp. on Turbulent Shear flows, Grenoble, France, Sept. 8-11.
Bradshaw, P. 1969 “The analogy between streamline curvature and buoyancy in turbulent shear flow.” J. Fluid Mech. 36: 177-191.
Choi, Y. & Humphrey, J.A.C. 1984 Analytical prediction of two-dimensional potential flow due to fixed vortices in a rectangular domain. J. Computational physics 56, 15-27.
Doligalski , T.L., Smith, C.R. & Walker, J.D.A. 1994 Vortex interactions with walls. Annu. Rev. Fluid Mech. 26, 573-616.
Hill, P.G. & Zhang, D. 1994 The effects of swirl and tumble on combustion in spark-ignition engines. Prog.
Energy Combust. Sci. 20, 373-429.
Le Roy, O. 1998 Modélisation d'un écoulement tourbillonnaire turbulent soumis à une compression, Ecole Centrale de Lyon.
Le Roy, O. & Le Penven, L. 1997 Compression of a turbulent vortex flow. In 11th Symp. on Turbulent Shear
flows, Grenoble, France, Sept. 8-11.
Lecordier, B. 1997 Etude de l'interaction de la propagation d'une flamme prémélangée avec le champ
aérodynamique par association de la tomographie laser et de la vélocimétrie par image de particules., Faculté des
Sciences de l'Université de Rouen.
Lecordier, B., Mouqallid, M. & Trinité, M. 1994 Simultaneous 2D measurements of flame front propagation by high speed tomography and velocity field by cross-correlation. In Seventh International Symposium on applications
of Laser techniques to Fluid Mechanics, Lisbon, Portugal.
Lundgren, T.S. 1998 Private communication. .
Lundgren, T.S. & Mansour, N.N. 1996 Transition to turbulence in an elliptic vortex. J. Fluid Mech. vol. 307, 43-62.
Marc, D. 1998 Etude expérimentale de la compression d'un écoulement de rouleau – Situation modèle de
l'aérodynamique interne des moteurs à pistons., I.N.P. Toulouse N° 1423.
Marc, D., Borée, J., Bazile, R. & Charnay, G. 1997 PIV and LDV measurements of tumbling vortex flow in a model square section motored engine. In SAE 972834.
Sipp, D. & Jacquin, L. 1998 Elliptic instability in two-dimensional flattened Taylor-Green vortices. Phys. Fluids 10 (4), 839-849.
Tritton, D.J. 1988 Physical Fluid Dynamics. Oxford Science Publications.
Willert, C.E. & Gharib, M. 1991 Digital particle image velocimetry. Experiments in fluids 10, 182-193.
Appendix A :
The time scale τe related to the exponential growth rate of the energy of the perturbation in the linear
regime is :
τe=1βA (A-1)
β is the non-dimensional energy growth rate. The maximum value of
β
(
β ≈0. 24)
computed at a Reynolds number Re= Γ ν ≈12700 by (Lundgren and Mansour 1996) corresponds to low wave numbers.As stated in their paper, this value should be only little dependant of the Reynolds number and will therefore be used for our evaluation.
A is the maximum vorticity of the Taylor vortex. Reference works show that similar values of the growth
rate are observed in a large class of problems involving different initial vorticity profiles. A reasonable estimation for our problem should therefore be obtained if the circulation in the present flow is related to
A (Lundgren 1998). The value of A is easily related to the circulation of the initial Taylor vortex Γ with :
A= π
2Γ
4L1L2 (A-2)
x y
b(t)
a
• Γ
Region A Region B
Figure 1: Compression of a point vortex in
a rectangular domain
2a
2b
Figure 2: Point vortex displacement for
two different values of Ncmax (2a : 0.1 ;
2b : 0.5.) .
-2 -1 0 1
G
1.0 0.8
0.6 0.4
0.2 0.0
x*
Nc
max
=0.5
Nc
max
=1.0 Nc
max
=0.1 Nc
max
=0.0
Figure 3: Evolution of the normalised
pressure gradient (see text) along the
bottom wall for various compression speed
Figure 4: Sketch of the compression
machine.
Figure 5: Time evolution of ensemble
Figure 6: evolution of the velocity field
during a compression phase (laser sheet 1).
Fig.6a : r = 1 Fig.6b : r = 2
Fig.6c : r = 2.4 Fig.6d : r = 3.4
Fig.6e : r = 4.5 Fig.6f : r = 5.4
X(cm)
X(cm)
X(cm)
X(cm) X(cm)
X(cm)
Y(
cm
)
Y(
cm
)
Y(
cm
)
Y(
cm
)
Y(
cm
)
Y(
cm
Figure 7: evolution of the velocity field
during a compression (laser sheet 2)
Fig.7c :r = 2.2 Fig.7d :r = 3.1
Fig.7e :r = 4.5 Fig.7f :r = 6.6
X(cm) X(cm)
X(cm) X(cm)
X(cm) X(cm)
Y(
cm
)
Y(
cm
)
Y(
cm
)
Y(
cm
)
Y(
cm
)
Y(
cm