AUT J. Elec. Eng., 50(2) (2018) 141-148 DOI: 10.22060/eej.2018.14001.5200
Incorporating Wind Power Generation And Demand Response into Security-Constrained
Unit Commitment
M. H. Hemmatpour1*, E. Zarei2, M. Mohammadian2
1 Department of Electrical Engineering, Faculty of Engineering, Jahrom University, Jahrom, Iran
2 Department of Electrical Engineering, Faculty of Engineering, Shahid Bahonar University of Kerman, Kerman, Iran
ABSTRACT: Wind generation with an uncertain nature poses many challenges in grid integration and secure operation of power system. One of these operation problems is the unit commitment. Demand Response (DR) can be defined as the changes in electric usage by end-use customers from their normal consumption patterns in response to the changes in the price of electricity over time. Further, DR can be also defined as the incentive payments designed to induce lower electricity use at the times of high wholesale market prices or when system reliability is jeopardized. This paper presents a novel approach for incorporating stochastic wind power generation and DR with Security-Constrained Unit Commitment (SCUC) for improving the security and economic operation in power systems. DR is one of the methods of managing the economic filed in unit commitment. Demand includes the fixed and responsive loads, and the volatile nature of wind power is modeled. Responsive loads can be curtailed or shifted to another off peak hours. The combination of wind power generation and DR to SCUC problem makes a large scale optimization problem which needs a heavy mathematical computation and time consuming process. So, benders decomposition technique is applied to reduce the volume of the computation and problem complexity. To reach a fast approach, a proposed statistical and probabilistic method for omitting infeasible terms is used. Numerical simulation and final results on a modified IEEE 6- and 118-bus systems show the performance and effectiveness of the proposed approach.
Review History:
Received: 23 January 2018 Revised: 12 May 2018 Accepted: 7 September 2018 Available Online: 25 September 2018
Keywords:
Demand Response
Security-Constraint Unit Commitment Restructured Power Market Wind Farms
Stochastic Power Generation.
1- Introduction
1- 1- Restructured power market
Ensuring a secure and economical operation has two objectives in the restructured power market. In a secure power market, for reducing the cost of electricity utilization, appropriate strategies must be design. Market entities would be divided into independent system operator (ISO) and market participant [1]. The ISO would coordinate long-term planning by administrating transmission tariffs and maintaining system security [1]. In general, the role of ISO is to commit or to dispatch some or all of the power generated by the unit and curtailing loads for system security. Also, ISO, by sending appropriate economic signals to all market participants, should motivate them to investigate in the market [2, 3]. Market prepares a structure between buyers and sellers by a centralized approach to trade energy. The energy market prices should be reliable for market participants, financial markets and customers [4-5].
1- 2- Demand response
For supplying hourly forecast load, GENCOs submits their bids to ISO. According to the last scheduled generation unit, the market price would be cleared [6]. The demand side has now participated in this market that leads to the congested transmission lines, high operational cost, high fuel consumption and volatile market prices [7]. With no participation of the demand side in the market clearing process, unit bids might be much higher than the real production cost. This makes a market with volatile price and no competition [8]. For satisfying loads in absence of
reserve at peak hours, generators with high marginal cost should be used. In such a structure, demand side participation is a good economic method for prevailing constraint and freeing transmission capacity [9]. Increasing demand side participation could reduce volatile market prices, operating cost and also could benefit whole customer and electricity market participant [10], [11]. In this paper, we consider DR as a part of demand side management. In fact, DR is the load shifting or curtailment in reaction of high price or encouragement of market that includes emergency DR and economical DR. Voluntarily curtailment of loads in response to the market price is called economical DR [12]. Customers in restructured power system should set their consumption profile in response to the nodal price which differs with location and time [13]. However, instead of load curtailment, customers could also shift their load to off peak hours with cheaper price. All customers would benefit from cheaper market price that is the result of load curtailing in peak hours or shifting loads to off peak hour that makes a flat load profile [14].
1- 3- SCUC
constraint becomes more difficult, if most of the committed unit is located at on region. So, ISO incorporates alternative network constraint in unit commitment to minimize the operation cost and violation [1], [15].
1- 4- Wind power generation
Nowadays, wind power has an increasing share in power generation. Being clean and cheap is one of the reasons that countries trended toward. Variable, volatile and intermittent nature of wind makes its penetration a great challenge in power system scheduling [16]. The system should be scheduled in such a structure that the unit can easily be accommodated with the volatile nature of wind. These are the reasons why we should model the frequency and volatility of wind power. Weather data, statistical method and power-speed curve obtained from wind turbine are used for modeling wind generation that is a complex issue [17-18].
An evaluation process based on a stochastic UC model with unified power flow controller (UPFC) and uncertain wind power has been proposed in [19]. In this reference, a comprehensive evaluation process based on a two-stage stochastic UC model with UPFC and wind power integration is proposed. ISO day-ahead scheduling UC under uncertain conditions with DR is considered in [20]. Two kinds of DR, incentive-based DR and price-based DR are both incorporated according to their response characteristics. A bi-level two-stage stochastic security-constrained unit commitment model is proposed for this programmer to minimize the ISO cost considering the uncertain wind power output and the uncertain price elasticity [20]. Probabilistic UC problem presented in [21] gives the ISO a better source to make the right judgement to optimize the ancillary services usage in the system. The problem solved in this reference also gives the complete objective of a power system which is planning to incorporate Demand Response, Energy Storage and wind energy into their grid. Authors in [22] presented a congestion risk-aware UC formulation in a two-settlement market environment. In this reference, the uncertainty impact of multi-correlated wind power and contingencies on the risk of transmission congestion for each line is incorporated using basic statistical data on nodal wind power forecast and probability of credible line outages across the system. In [23], a newly distributed robust optimization framework for UC under uncertain wind power was provided. The proposed framework minimizes the worst-case expected total cost over an ambiguity set of possible probability distributions. In this paper, the responsive loads as one part of DR can be curtailed and their characteristics are submitted to the ISO. Also, an hourly SCUC by considering the feasibility and contingencies for the market clearing process is applied.
1- 5- Article organization
Other parts of this paper are organized as follows: Section 2 presents the market clearing model and scenario generation. Section 3 includes problem formulation. Section 4 provides case studies and observations. The conclusion is investigated in section 5.
2- Market clearing model and scenario generation
Combination of wind power generation and DR in a restructured power market is presented in this section.
2- 1- Market clearing process
In restructured power markets, planning resources should be done for each hour of the day-ahead market. GENCOs can
affect on pricing and the amount of available electricity. A competitive power market could make a choice for customers and prevent monopoly [1]. For insuring reliability of power systems in real-time, generation and consumption should be balanced. When the market schedule is cleared, generation, transmission and load value changes and real-time market for power balancing should be established. Social welfare as an objective function of the hourly SCUC problem should be maximized, that is equal to: consumption payments of each load at each hour mines production cost of the system. We suppose GENCOs and loads submit their bids to the ISO for market clearing price. However, day-ahead market clearing price is cleared first, for ancillary services, bids are submitted [3, 5].
2- 2- Submitted load bids
DR is composed of the fixed and responsive loads. Fixed loads prices are cleared in the market process. By increasing demand, price of responsive loads will drop. Subjected constraints for responsive loads are shown as follows. Minimum down /up time presents the number of uninterrupted hours that loads should be off or restored. Load pickup/drop rate defines ramping that loads can be curtailed or restored. Minimum load curtailment shows the lower limit of load curtailment at each bus. Maximum daily curtailment defines the upper band of load curtailment in a day [9].
2- 3- Scenario generation
For considering volatile nature of wind power, normal distribution N (μ, σ2) with the average of μ and standard
deviation of σ2 is used. We can also use other statistical
distribution method for normalizing wind power generation. For the subjecting scenario to the normal distribution, Monte Carlo simulation is applied to generate scenarios. Based on the forecast wind power, a large number of random scenarios will be generated. We also use Latin hypercube sampling (LHS) for decreasing the variety of generated scenarios. LHS tries to find precise random distribution by reducing the number of generated scenarios simulated by Monte Carlo [24]. This technique is also profitable for decreasing computational time of scenario simulation. Based on the probability function, this decrement process measures the distance between scenarios and omits those with low probability [25, 26].
2- 4- Solution of SCUC including wind power and DR
3- SCUC Formulation With Wind Power Generation And DR
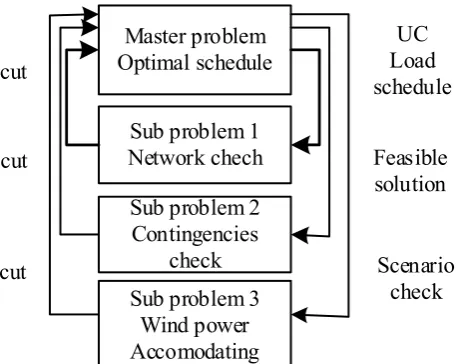
Formulation of SCUC with benders decomposition technique in master problem and sub problems, with related constraints are shown in the following.
3- 1- Master problem
Objective function (1), in master problem is composed of generation cost and consumption payment. These terms show the benefit that costumers earn from load curtailment mines generation cost.
(1)
( )
( )
1 1 1 1
* NT NB NT NG
bt bt ci it it it it
t b t i
Max CB D F P I SU SD
= = = =
− + +
∑∑
∑∑
3- 2- System constraints
Power balance (2): generated power must be equal to the demand consumption plus network losses. The system is spinning and operating reserve (3), (4): these constraints are applied to guarantee power absence at peak hours or system outage. Ram up/down limit (5), (6): units should change their production level according to this ramp rate. Minimum on/off time (7), (8): these constraints impose to restrict unit on/off time. It means that when a unit changes its status, it must stay in a new mode for a specified time. Power generation limit (9): this constraint limits the maximum and minimum power generation of each unit [1], [22].
(2)
, ,
1 * 1 1 ( 1,2,..., )
NG NW NB
f
L t it it W it bt
i=P I i= P b=D P t NT
= + = +
∑
∑
∑
(3) , , 1* ( 1,2,..., ) NG
S it it S t i
R I R t NT
= ≥ =
∑
(4) , , 1* ( 1,2,..., ) NG
o it it o t i
R I R t NT
=
≥ =
∑
(5) ( )1 1
(
1 ( )1)
(
1 ( )1)
,( 1,2,..., ; 1,2,..., )
it i t it i t i it i t i min
P P I I UR I I P
i NG t NT
− − −
− ≤ − − + −
= =
(6) ( )1 1 ( )1
(
1)
( )1(
1)
,( 1,2,..., ; 1,2,..., )
it it i it i min i t i t i t
P P I I DR I I P
i NG t NT
− − ≤ − − − + − −
= =
(7)
( )1 ( )1 0
( 1,2,..., ; 1,2,..., )
on on
i it
i t i t
X T I I
i NG t NT
− −
− − ≥
= =
(8)
( )1 ( )1 0
( 1,2,..., ; 1,2,..., )
off off i it
i t i t
X T I I
i NG t NT
− − − − ≥ = = (9) , * , *
( 1,2,..., ; 1,2,..., )
i min it it i max it
P I P P I
i NG t NT
≤ ≤
= =
3- 3- Scenario constraint
Scenario power balance (10): in each scenario summation of generation power, demand consumption and system losses must be equal to zero. Scenario spinning and operating reserve (11), (12), permissible adjustment of real power generation (13) and constraint (14) that restrict power generation in scenarios [26].
(10)
, ,
1 1 1
* ( 1,2,..., )
NG NW NB
s s
it it W it bt L t
i i b
P I P D P t NT
= = = + = + =
∑
∑
∑
(11) , , 1* R ( 1,2, ., )
NG
s s
S it it S t i
R I t NT
= ≥ = …
∑
(12) , , 1* R ( 1,2, ., ) NG
s s
o it it o t i
R I t NT
=
≥ = …
∑
(13)
( 1,2,..., ; 1
,2,..., )
s
it it i
P P− ≤ ∆ i= NG t= NT
(14) , * P , *
( 1,2,..., ; 1,2,..., )
s
i min it it i max it
P I P I
i NG t NT
≤ ≤
= =
3- 4- Load constraint
For load participation, these constraints should be imposed to the problem. Bus load (15), total load at each bus is composed of fixed and responsive loads that must be equal to the summation of total load. Minimum load curtailment (16), curtailed loads less than this amount, could not participate in the program. In this case, instead of the scheduled responsive load, the amount of responsive load mines, curtailed load, would participate in the program. Nonnegative responsive load (17), this constraint should be imposed to ensure that curtailed load is larger than minimum load curtailment. Submitted responsive load (18), if loads do not curtail, the submitted responsive load should be scheduled. Ramp up/ down limit of loads (19), (20), loads should change their consumption level according to this ramp rate. Minimum on/off time of loads (21), (22), we have also this constraint to restrict loads curtailing or restoring. And the last loads constraint is daily load curtailment (23), total load curtailment in each day should be lower than the pre-specified amount [28].
(15) Df D (r 1,2,..., ; 1,2,..., ) bt bt bt
D = + b= NB t= NT
(16) , 0 ( 1,2,..., ; 1,2,..., )
r max min r bt bt bt bt
D DX D v b NB t NT
− − ≥ = =
(17) 0 ( 1,2,..., ; 1,2,..., )
r
D vbt bt ≥ b= NB t= NT
(18)
[
]
, 1 0 ( 1,2,..., ; 1,2,..., )
r r max bt bt bt
D D v b NB t NT
− − ≥ = =
Sub problem 1
Network chech
Sub problem 2
Contingencies
check
Sub problem 3
Wind power
Accomodating
Master problem
Optimal schedule
Load
UC
schedule
Feasible
solution
Scenario
check
cut
cut
cut
(19) ( )1 ( 1,2,..., ; 1,2,..., )
r r
bt b t b
D −D − ≤UR b= NB t = NT
(20) ( )1 ( 1,2,..., ; 1,2,..., )
r r
bt b b t
D − −D ≤DR b= NB t= NT
(21)
( )1 ( )1 0
( 1,2,..., ; 1,2,..., )
on
b bt b t b t
X UT v v
b NB t NT
− −
− − ≥
= =
(22)
( )1 ( )1 0
( 1,2,..., ; 1,2,..., ) off
b bt
b t b t
X DT v v
b NB t NT
− −
− − ≥
= =
(23)
(
,)
1
( 1,2,..., )
NT
r max r max
bt bt b
t
D D EX b NB
=
− ≤ =
∑
3- 5- Sub Problem And Benders Decomposition 3- 5- 1- Feasibility And Contingencies Check
Solving this SCUC problem is a time consuming process and by incorporating stochastic wind power, and DR becomes so complicated. Therefore, benders decomposition technique is applied for decomposing the problem into master problem and sub problems. Unit commitment for determining the unit schedule and power generation are solved in master problem. This solution for feasibility and contingencies is checked and also scenario accommodating is given to the sub problems. If any violations occurred, hourly cuts (24) and (25) for system security will be added to master problem in next iteration. In sub problem, power mismatch tried to be minimized in all buses [1, 27 - 28].
(24)
(
)
(
)
1 1
0
( 1,2,..., )
ˆ ˆ ˆ
ˆt NG it it it it it NB bt bt bt
i b
w P I P I D D
t NT
π µ
= =
+ − + − ≤
=
∑
∑
(25)
(
)
(
)
1 1
)
ˆ ˆ
ˆ ( ) 0
( 1,2,...,
NG NB
t it it it it bt bt bt
i b
w P P D D
t NT
π π µ
= =
+ − − + − ≤
=
∑
∑
Here, wˆtshows power mismatch in base case for current bus. it
π ,µbt,πitand πitare dual variables of hourly dispatch, load balance equations and hourly generation constraint.
3- 5- 2- Feasibility Check Sub Problem In Scenario
Non-negative slack variables for minimizing wind power violation in each scenario are added to the related constraints. Here, vs is the summation of this added slack variable in
scenarios that must be minimized. Positive value obtained by this term shows that unit commitment and power dispatch in master problem cannot be accommodated with the forecast wind power in scenarios. Therefore, benders cut (26) is added to master problem in the next iteration for mitigating this violation [29].
(26)
( )
(
)
1 1
| 0
ˆ NG NT s ˆ ˆ
s s
it it it i t it
v
v P v P P P
P
= =
∂
= + − ≤
∂
∑∑
4- Case Studies And Numerical Simulation
Modified IEEE 6-bus and 118-bus systems are used for analyzing the proposed algorithm. The system data are available on http://motor.ece.iit.edu.data and www.ieee.hr. For solving this problem, this given information is used: In each bus ten percent of the total load supposed to be responsive, consumption bid 20$/MWH, minimum hourly
load curtailment at each bus 5MW and maximum load curtailment 150 mw of a day [28]. Wind price is zero and reserve requirement stay the same during wind penetration. Also, these three scenarios are considered: SCUC in the base case, SCUC with DR and SCUC with DR and stochastic wind power generation.
4- 1- IEEE 6-bus system
The structure of this system is shown in Fig. 2. This system includes 3 generation units, 7 transmission lines and two transformers.
4- 1- 1- SCUC in the base case
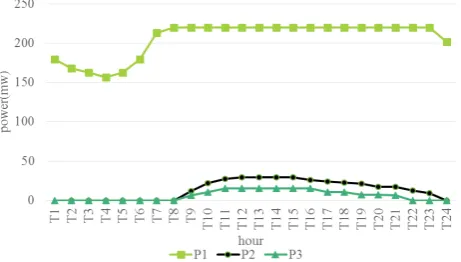
By running the SCUC in the base case, the total operation cost is obtained 137491.924$ with the computational time of 3 minute. The three generation units participate in load satisfying programs. Unit number 1 participates in the all-time of the day, unit number 2 participates is 10 hours, and unit number 3 participates in 17 hours. Power generation by each unit is shown in Fig. 3. According to this figure, at the beginning of the day that demand is low, the only active unit is unit one. By increasing demand, unit 1 increases its generation level to the maximum limit and other unit also would be commitment. Total operational hours for three units are 51 hours in this case.
4- 1- 2- SCUC with DR
In this case, 10% of the total load in each bus is responsive and the rest is fixed. Responsive loads are those that can be curtailed or shifted to other operational hours in the response of the system price or security. Computed operation cost with DR is 124421.209$ and the run program time is 5 minutes. By comparing the result with the base case, there
Fig. 2. Structure of 6-bus system in base case.
is 1307.715$ reduction. The three units participated in the power production are depicted in Fig. 4. Similar to the base case, unit 1 is on for 24 hours, but the committed state of unit 2 decreases to 8 and unit 3 to 16 hours. Also, production level of these two units decreases to lower range, this reduction is because of demand decrement at peak hours that need lower power generation and fewer status changes. Total operational hours are decreased in comparison of base case to 48 hours. This reduction is the result of using DR.
Fig. 4. Power generation with DR for 6-bus.
After solving SCUC problem, status of load and their curtailment is cleared. Table 1 shows the remaining responsive load, after participating in the load curtailment program. Here, the variation of responsive load amplitudes is between 0 to 10% of total load at each bus, 0 show the fully curtailment of this responsive load at the right time.
Table 1. Responsive load participation in program.
Effect of DR on the network load profile before (D1) and after combination (D2) of DR with SCUC is given in Table 2. Also, for better comparison, Fig. 5 shows the effect of load curtailment on curving demand at peak hour. At hours 1-9, there is no load curtailment, so D1 is equal to D2.
Table 2. DR effect on demand reduction.
Fig. 5. Demand curtailment by DR incorporation.
4- 1- 3- SCUC with DR and stochastic wind power generation
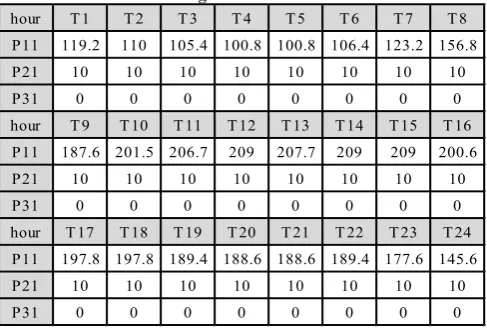
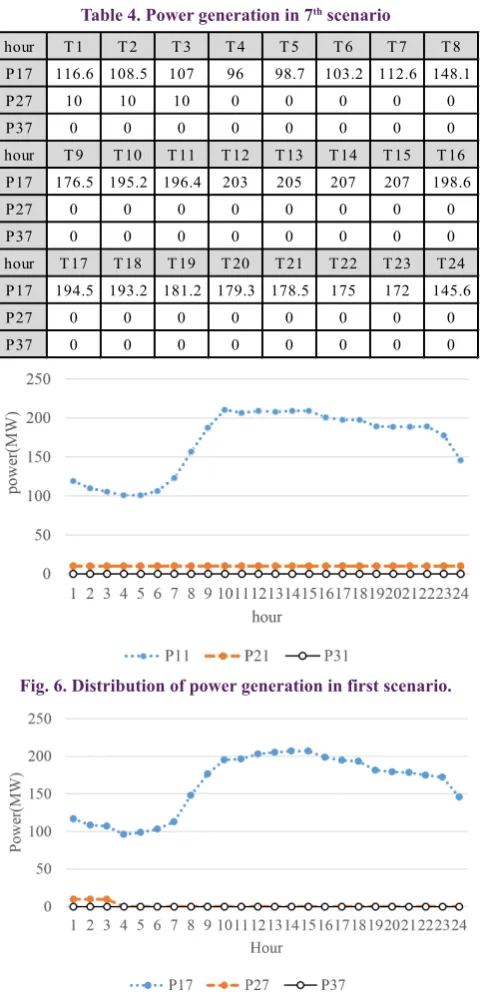
Wind power as one of the distributed generation resources is incorporated in SCUC problem for reducing operational cost and improving system operation. Ten generated scenarios are considered for modeling the probabilistic nature of wind power generation. These scenarios are produced according to the obtained data from wind farms and weather forecasting. Operational cost is obtained 104226.506$ in this scenario that has a 33265.48$ reduction in comparison with the base scenario and 20194.703$ reduction in comparison to the second scenario. The computational time of this scenario is 9 minutes. By considering wind power, commitment state changes and unit numbered 3 would turn off in whole scenario. Like two other scenarios, unit one became on, but its production level decreased to lower level. Commitment states for unit 2 is as follows: whole time for first 6 scenarios, 3 hours in 7th scenario, 2 hours in 8th scenario and 1 hour for scenarios 9th and 10th. The unit production decreases to lower level and units with high marginal cost will be off by increasing wind power ratio. Here, two scenarios were chosen for more analysis. The amount of power generation in first and 7th scenarios are respectively shown in Table 3 and Table 4.
Table 3. Power generation in first scenario
As it is observed from the above tables, unit power production decreases by increasing wind power penetration. But unit 1 produces power at its highest range. This power absence would be compensated by wind power generation. Fig. 6 and Fig. 7 show the distributed power generation in each scenario for different hours, respectively. P11 and P17 are power generation in first and 7th scenarios by the unit one,
respectively.
hour T1 T2 T3 T4 T5 T6 T7 T8
D1(MW) 175.19 165.15 158.67 154.73 155.06 160.48 173.39 177.6 D2(MW) 175.19 165.15 158.67 154.73 155.06 160.48 173.39 177.6 DR(MW) 17.92 16.8 16.24 15.68 15.68 16.24 17.92 21.28
hour T9 T10 T11 T12 T13 T14 T15 T16
D1(MW) 186.81 206.96 228.61 236.1 242.18 243.6 248.86 255.79 D2(MW) 186.81 204.86 203.662 210.9 217.232 218.4 223.66 231.346 DR(MW) 23.86 23.997 24.948 25.2 24.948 25.2 25.2 24.443
hour T17 T18 T19 T20 T21 T22 T23 T24
D1(MW) 256 246.74 245.97 237.35 237.31 232.67 195.91 195.6 D2(MW) 231.808 222.548 222.534 214.166 214.126 209.236 172.93 175.44 DR(MW) 24.192 24.192 23.436 23.184 23.184 23.436 23 20.16
hour T1 T2 T3 T4 T5 T6 T7 T8 B3 3.584 3.36 3.248 3.136 3.136 3.248 3.548 4.258 B4 7.168 6.72 6.496 6.272 6.272 6.49 7.168 8.512 B5 7.168 6.72 6.496 6.272 6.272 6.49 7.168 8.512 hour T9 T10 T11 T12 T13 T14 T15 T16
B3 4.872 0.116 0 0 0 0 0 0 B4 9.744 0.139 0 0 0 0 0 0 B5 4.744 0.345 0 0 0 0 0 0 hour T17 T18 T19 T20 T21 T22 T23 T24
B3 0 0 0 0 0 0 4.872 4.032
B4 0 0 0 0 0 0 1.21 8.064
B5 0 0 0 0 0 0 4.678 8.064
hour T1 T2 T3 T4 T5 T6 T7 T8 P11 119.2 110 105.4 100.8 100.8 106.4 123.2 156.8 P21 10 10 10 10 10 10 10 10
P31 0 0 0 0 0 0 0 0
hour T9 T10 T11 T12 T13 T14 T15 T16 P11 187.6 201.5 206.7 209 207.7 209 209 200.6 P21 10 10 10 10 10 10 10 10
P31 0 0 0 0 0 0 0 0
hour T17 T18 T19 T20 T21 T22 T23 T24 P11 197.8 197.8 189.4 188.6 188.6 189.4 177.6 145.6 P21 10 10 10 10 10 10 10 10
Fig. 6. Distribution of power generation in first scenario.
Fig. 7. Distribution of power generation in 7th scenario.
Incorporating wind power into SCUC problem also has its effect on DR and load curtailment. For better comparison, the participation of DR in presence of wind power is shown in Table 5 and Fig. 8. Here, D1 is the demand before a combination of DR and wind power. D2 is the demand after combination of DR. Also, DR1 and DR7 shows demand after combination of DR and wind power generation in first and 7th scenarios, respectively. The numbers show the amount of the remaining demand in different cases of program.
4- 2- IEEE 118-bus system
For a better illustration, this test is also done on IEEE 118-bus system. System characteristics are as follows: 54 generation unit, 9 tap-changers, 186 lines and maximum demand of 6000 MW a day. Total operating cost after solving SCUC problem in the absence of DR and wind power obtained 1,067,031.191$.
After incorporating DR by impact factor of 10%, operation cost is reduced to 1,049,223.153$. Finally, solution of SCUC includes DR, and stochastic wind power generation decreases to 995,164.448$ in last case. The proposed algorithm is applied to a 2.6 GHz computer using GAMS 23.3 [38].
5- Observation
A total comparison for all case studies is shown in Table 6, which represents the effectiveness of this approach in cost reduction. Some other benefits of the proposed method are: demand decrement at peak hours, reduction in operation cost, social welfare improvement and reduction in LMP.
Table 6. Total comparison
6- Conclusions
A novel approach for incorporating SCUC algorithm with DR and stochastic wind power generation is developed in this paper. Load curtailment at peak hours can reduce the operation cost and improve social welfare. Iterative process between master problem and sub problems can result in a robust SCUC for accommodating wind power and DR. Here, a spacious formulation for modeling SCUC with DR and
hour T1 T2 T3 T4 T5 T6 T7 T8
D1(MW) 175.19 165.15 158.67 154.73 155.06 160.48 173.39 177.6
D2(MW) 175.19 165.15 158.67 154.73 155.06 160.48 173.39 177.6
DR1(MW) 175.19 165.15 158.67 154.73 155.06 160.48 173.39 177.6
DR7(MW) 175.19 165.15 158.67 154.73 155.06 160.48 173.39 177.6
hour T9 T10 T11 T12 T13 T14 T15 T16
D1(MW) 186.81 206.96 228.61 236.1 242.18 243.6 248.86 255.79
D2(MW) 186.81 204.86 203.662 210.9 217.232 218.4 223.66 231.346
DR1(MW) 186.81 194.01 200.894 202.36 205.959 206.4 207.66 210.507
DR7(MW) 186.31 204.565 198.382 204.9 205.323 206.4 207.66 201.507
hour T17 T18 T19 T20 T21 T22 T23 T24
D1(MW) 256 246.74 245.97 237.35 237.31 232.67 195.91 195.6
D2(MW) 231.808 222.548 222.534 214.166 214.126 209.236 172.93 175.44
DR1(MW) 208.826 211.429 210.574 207.926 208.886 206.274 187.27 195.6
DR7(MW) 206.826 211.429 210.574 207.926 207.511 205.182 184.606 195.6
hour T1 T2 T3 T4 T5 T6 T7 T8 P17 116.6 108.5 107 96 98.7 103.2 112.6 148.1
P27 10 10 10 0 0 0 0 0
P37 0 0 0 0 0 0 0 0
hour T9 T10 T11 T12 T13 T14 T15 T16 P17 176.5 195.2 196.4 203 205 207 207 198.6
P27 0 0 0 0 0 0 0 0
P37 0 0 0 0 0 0 0 0
hour T17 T18 T19 T20 T21 T22 T23 T24 P17 194.5 193.2 181.2 179.3 178.5 175 172 145.6
P27 0 0 0 0 0 0 0 0
P37 0 0 0 0 0 0 0 0
Table 4. Power generation in 7th scenario
Table 5. DR effect on demand reduction.
wind power is proposed. Generation units, loads and scenario constraint are considered in this algorithm. Numerical simulations on 6-bus and 118-bus system shows the benefits of SCUC combination with DR and wind power.
Indices:
b index for buses. i index for unit. t index for time.
Sets:
S superscript for scenario. f superscript for fixed loads. R superscript for responsive loads.
Parameters:
NB number of buses. NG number of unit.
NW number of wind power unit. NT number of period (hour).
i
DR Ramp-down rate limit of unit i. i
UR Ramp-up rate limit of unit i. S,t
R System spinning reserve at time t. ,
Rs
S t System spinning reserve at time t in scenario s. O,t
R System operating reserve at time t. ,
Rs
o t System operating reserve at time t in scenario s. S,it
R Spinning reserve of unit i at time t.
,
Rs
S it Spinning reserve of unit i at time t in scenario s.
O,it
R Operating reserve of unit i at time t.
o,
Rs
it Operating reserve of unit i at time t in scenario s.
it
SU Startup cost of unit i at time t. it
SD Shutdown cost of unit i at time t. off
i
T Minimum off time of unit i. on
i
T Minimum on time of unit i. off
it
X Off time of unit i at time t. on
it
X On time of unit i at time t.
max b
EX Maximum load curtailment at bus b.
f bt
D Fixed load at bus b at time t.
r bt
D Responsive load at bus b at time t. r,max
bt
D Submitted responsive load at bus b at time t.
min bt
DX Minimum load curtailment at bus b at time t. b
DR Down-rate limit of load at bus b. b
UR Up-rate limit of load at bus b. b
UT Minimum on time of load at bus b at time t. b
DT Minimum off time of load at bus b at time t.
on bt
X On time of load at bus b at time t.
off bt
X Off time of load at bus b at time t.
i,max
P Lower real power generation of unit i.
i,min
P Upper real power generation limit of unit i.
Variables:
ci
F Production cost function for unit i. it
I Commitment state of unit i at time t.
f W,it
P Forecasted wind power of unit i at time t. s
W,it
P Simulated wind power for unit i at time t in scenario s. s
it
P Power production of unit i at time t in scenario s. L,t
P System losses at time t.
it
P Power production of unit i at time t.
Δi Permissible real power adjustment of unit i.
bt
CB Consumption benefit at bus b at time t. bt
D Total load at bus b at time t.
bt
GC Generation cost of unit i at time t. bt
v Curtailment state of load at bus b at time t. t
w Power mismatch at time t. ,
bt bt
µ π Dual variable.
Symbols:
^ Given variable.
References
[1] M. Shahidehpour, H. Yamin, Z. Li, Market overview in electric power systems, Market Operations in Electric Power Systems: Forecasting, Scheduling, and Risk Management, (2002) 1-20.
[2] L. Goel, Q. Wu, P. Wang, Reliability enhancement and nodal price volatility reduction of restructured power systems with stochastic demand side load shift, in: Power Engineering Society General Meeting, 2007. IEEE, IEEE, 2007, pp. 1-8.
[3] H.Y. Yamin, S.M. Shahidehpour, Risk and profit in self-scheduling for GenCos, IEEE Transactions on Power Systems, 19(4) (2004) 2104-2106.
[4] J. Wang, S. Kennedy, J. Kirtley, A new wholesale bidding mechanism for enhanced demand response in smart grids, in: Innovative Smart Grid Technologies (ISGT), 2010, IEEE, 2010, pp. 1-8.
[5] S.J. Rassenti, V.L. Smith, B.J. Wilson, Controlling market power and price spikes in electricity networks: Demand-side bidding, Proceedings of the National Academy of Sciences, 100(5) (2003) 2998-3003.
[6] T. Li, M. Shahidehpour, Strategic bidding of transmission-constrained GENCOs with incomplete information, IEEE Transactions on power Systems, 20(1) (2005) 437-447. [7] C. Su, D. Kirschen, Direct participation of demand-side
in a pool-based electricity market, POWER SYSTEM TECHNOLOGY-BEIJING-, 31(20) (2007) 7.
[8] R.H. Patrick, F.A. Wolak, Real-time pricing and demand side participation in restructured electricity markets, Electricity Pricing in Transition, (2002) 345-356.
[9] R.L. Earle, Demand elasticity in the California power exchange day-ahead market, The Electricity Journal, 13(8) (2000) 59-65.
[10] C.-L. Su, D. Kirschen, Quantifying the effect of demand response on electricity markets, IEEE Transactions on Power Systems, 24(3) (2009) 1199-1207.
[11] A. David, Y. Li, Effect of inter-temporal factors on the real time pricing of electricity, IEEE transactions on power systems, 8(1) (1993) 44-52.
[12] E.M. Larsen, P. Pinson, F. Leimgruber, F. Judex, Demand response evaluation and forecasting — Methods and results from the EcoGrid EU experiment, Sustainable Energy, Grids and Networks, 10 (2017) 75-83.
[13] L. Goel, Q. Wu, P. Wang, Nodal price volatility reduction and reliability enhancement of restructured power systems considering demand–price elasticity, Electric Power Systems Research, 78(10) (2008) 1655-1663.
[14] A. David, Y.-C. Lee, Dynamic tariffs: theory of utility-consumer interaction, IEEE Transactions on Power Systems, 4(3) (1989) 904-911.
[15] R. Fernández-Blanco, Y. Dvorkin, M.A. Ortega-Vazquez, Probabilistic security-constrained unit commitment with generation and transmission contingencies, IEEE Transactions on Power Systems, 32(1) (2017) 228-239. [16] M.H. Hemmatpour, M. Mohammadian, A.-A.
Pleasecitethisarticleusing:
M. H. Hemmatpour, E. Zarei, M. Mohammadian, Incorporating Wind Power Generation And Demand Response into Security-Constrained Unit Commitment, AUT J. Elec. Eng., 50(3) (2018) 141-148.
DOI: 10.22060/eej.2018.14001.5200
with considering wind turbine generation and frequency deviation, IET Generation, Transmission & Distribution, 10(7) (2016) 1691-1702.
[17] G. Kariniotakis, I.H. Waldl, I. Marti, G. Giebel, T.S. Nielsen, J. Tambke, J. Usaola, F. Dierich, A. Bocquet, S. Virlot, Next generation forecasting tools for the optimal management of wind generation, in: Probabilistic Methods Applied to Power Systems, 2006. PMAPS 2006. International Conference on, IEEE, 2006, pp. 1-6. [18] M. Gibescu, B. Ummels, W. Kling, Statistical wind
speed interpolation for simulating aggregated wind energy production under system studies, in: Probabilistic Methods Applied to Power Systems, 2006. PMAPS 2006. International Conference on, IEEE, 2006, pp. 1-7. [19] J. Li, F. Liu, Z. Li, S. Mei, G. He, Impacts and benefits
of UPFC to wind power integration in unit commitment, Renewable Energy, 116 (2018) 570-583.
[20] N. Gong, X. Luo, D. Chen, Bi-level two-stage stochastic SCUC for ISO day-ahead scheduling considering uncertain wind power and demand response, The Journal of Engineering, 2017(13) (2017) 2549-2554.
[21] B.D.H. Kiran, M.S. Kumari, Demand response and pumped hydro storage scheduling for balancing wind power uncertainties: A probabilistic unit commitment approach, International Journal of Electrical Power & Energy Systems, 81 (2016) 114-122.
[22] S. Abedi, M. He, D. Obadina, Congestion Risk-Aware Unit Commitment with Significant Wind Power
Generation, IEEE Transactions on Power Systems, (2018).
[23] P. Xiong, C. Singh, A Distributional Interpretation of Uncertainty Sets in Unit Commitment under Uncertain Wind Power, IEEE Transactions on Sustainable Energy, (2018).
[24] P. Glasserman, Monte Carlo methods in financial engineering, Springer Science & Business Media, 2013.
[25] J. Dupačová, N. Gröwe-Kuska, W. Römisch, Scenario
reduction in stochastic programming, Mathematical programming, 95(3) (2003) 493-511.
[26] N. Growe-Kuska, H. Heitsch, W. Romisch, Scenario reduction and scenario tree construction for power management problems, in: Power tech conference proceedings, 2003 IEEE Bologna, IEEE, 2003, pp. 7 pp. Vol. 3.
[27] E. Zarei, M.H. Hemmatpour, M. Mohammadian, The Effects of Demand Response on Security-Constrained Unit Commitment, Scientia Iranica, (2017) -.
[28] A. Khodaei, M. Shahidehpour, S. Bahramirad, SCUC with hourly demand response considering intertemporal load characteristics, IEEE Transactions on Smart Grid, 2(3) (2011) 564-571.