Differences between bone mineral density, lean and fat mass of HIV-positive
and HIV-negative black women
C Ellisa* , HS Krugera,b , P Ukegbua , IM Krugerc , M Viljoend and MC Krugere aCentre of Excellence for Nutrition, North-West University, Potchefstroom, South Africa
bMedical Research Council Hypertension and Cardiovascular Disease Research Unit, North-West University, Potchefstroom, South Africa cAfrica Unit for Transdisciplinary Health Research, North-West University, Potchefstroom, South Africa
dDepartment of Pharmacology and Clinical Pharmacy, University of the Western Cape, Bellville, South Africa eSchool of Health Sciences, Massey University, Palmerston North, New Zealand
*Corresponding author, email: [email protected]
Objectives:To investigate the differences between bone mineral density (BMD), lean and fat mass of human immunodeficiency virus (HIV-) positive and HIV-negative black women and to investigate factors associated with low BMD.
Methods: Case-control study of black women (n= 565) aged 29–65 years from Potchefstroom, North West province, South Africa, based on secondary analysis of data. Total BMD, left femur neck of the hip (LFN BMD), spine BMD, total fat, fat-free tissue mass and percentage body fat (%BF) were measured by dual-energy X-ray absorptiometry.
Results:HIV-negative women had significantly higher median BMD, %BF, appendicular skeletal mass (ASM), ASM index, body mass index (BMI) and waist circumference than HIV-positive women. When the groups were matched for age and BMI, only spine BMD was marginally lower in HIV-positive women. In the total group, age, smoking and HIV status were associated with lower BMD, while calcium intake was positively associated with BMD. Similar variables were associated with BMD in HIV-negative women, while age and educational status were associated with BMD in HIV-positive women.
Conclusion:Low BMD was more common among HIV-positive than HIV-negative women. Older HIV-positive women with low educational status are particularly at risk.
Keywords:black women, bone mineral density, fat mass, HIV, lean mass
Introduction
South Africa is experiencing rapid urbanisation.1Despite having
multiple beneficial effects, urbanisation is associated with health consequences due to the accompanying lifestyle changes, including changes in compromised bone health.1,2 Emerging
evidence indicates that black, urban postmenopausal women are at increased risk of the development of low bone mass, decreased bone formation and bone turnover, as well as increased bone degradation resulting from inadequate dietary intake, reduced physical activity and low vitamin D status.1,3
Conflicting results regarding the individual associations between lean mass, as well as fat mass, with bone mineral density (BMD) have been previously demonstrated.4A
cross-sec-tional study conducted by Sotunde and co-workers (2015) has shown that lean mass has a stronger association with BMD in comparison with fat mass in urban black South African women.5
It was previously believed that black women had a greater pro-tection against the development of osteoporosis in comparison with white women due to their enhanced BMD. Studies indicat-ing this difference were primarily conducted in America and Europe.6,7 However, over the last few decades osteoporosis
has been recognised as a disease with a high incidence in urba-nised areas in low- and middle-income countries, including South Africa.3 The effects of human immunodeficiency virus
(HIV) infection on bone metabolism has not been recognised as a cause of substantial increase in the prevalence of osteope-nia and osteoporosis amongst HIV-infected patients in compari-son with non-HIV-infected patients.8–11 Amorosa and Tebas
(2006) concluded that this might be due to the small sample
sizes of earlier studies, thus limiting the strength of their conclusions.12
HIV infection is considered to be a chronic but treatable disease.13 The life expectancy of people living with this virus
has increased due to the introduction of antiretroviral therapy (ART).14 Even though the incidence of acquired immune
deficiency syndrome (AIDS) associated co-morbidities has decreased, other conditions such as osteoporosis and fragility fractures have increased.15–18 A variety of factors could be
responsible for the bone loss and fracture risk, including HIV-associated inflammation, lifestyle and behavioural factors, co-morbid conditions and ART itself, as well as an underlying genetic predisposition.19–23
Studies in Europe, the United States of America and South America regarding the initiation of ART have shown a 2–6% reduction in hip and spine BMD within the first 24–48 weeks after initiation of ART.24–27The rates of osteoporosis and
osteo-penia were found to increase by 15% and 67% respectively, with a 3.7 fold higher osteoporosis rate and 6.4 fold higher decrease in BMD in HIV-positive individuals.28An increased fracture risk
was found in HIV-positive individuals compared with HIV-nega-tive individuals.18The issue of bone health and HIV remains
neg-lected in terms of research and management in Africa, despite the fact that sub-Saharan Africa has a higher incidence of HIV infection than any other region.29Evidence suggests lack of
suf-ficient data on HIV/AIDS and metabolic bone diseases in a region housing two-thirds of persons living with the virus worldwide.30
Journal of Endocrinology, Metabolism and Diabetes of South Africa2019; 24(2):50–57 https://doi.org/10.1080/16089677.2019.1589047
Open Access article distributed under the terms of the Creative Commons License [CC BY-NC 4.0]
http://creativecommons.org/licenses/by-nc/4.0
JEMDSA
ISSN 1608-9677 EISSN 2220-1009 © 2019 The Author(s)
ARTICLE
The page number in the footer is not for bibliographic referencing www.tandfonline.com/oemd 23
Differences between bone mineral density, lean and fat mass of HIV-positive
and HIV-negative black women
C Ellisa* , HS Krugera,b , P Ukegbua , IM Krugerc , M Viljoend and MC Krugere aCentre of Excellence for Nutrition, North-West University, Potchefstroom, South Africa
bMedical Research Council Hypertension and Cardiovascular Disease Research Unit, North-West University, Potchefstroom, South Africa cAfrica Unit for Transdisciplinary Health Research, North-West University, Potchefstroom, South Africa
dDepartment of Pharmacology and Clinical Pharmacy, University of the Western Cape, Bellville, South Africa eSchool of Health Sciences, Massey University, Palmerston North, New Zealand
*Corresponding author, email: [email protected]
Objectives:To investigate the differences between bone mineral density (BMD), lean and fat mass of human immunodeficiency virus (HIV-) positive and HIV-negative black women and to investigate factors associated with low BMD.
Methods: Case-control study of black women (n= 565) aged 29–65 years from Potchefstroom, North West province, South Africa, based on secondary analysis of data. Total BMD, left femur neck of the hip (LFN BMD), spine BMD, total fat, fat-free tissue mass and percentage body fat (%BF) were measured by dual-energy X-ray absorptiometry.
Results:HIV-negative women had significantly higher median BMD, %BF, appendicular skeletal mass (ASM), ASM index, body mass index (BMI) and waist circumference than HIV-positive women. When the groups were matched for age and BMI, only spine BMD was marginally lower in HIV-positive women. In the total group, age, smoking and HIV status were associated with lower BMD, while calcium intake was positively associated with BMD. Similar variables were associated with BMD in HIV-negative women, while age and educational status were associated with BMD in HIV-positive women.
Conclusion:Low BMD was more common among HIV-positive than HIV-negative women. Older HIV-positive women with low educational status are particularly at risk.
Keywords:black women, bone mineral density, fat mass, HIV, lean mass
Introduction
South Africa is experiencing rapid urbanisation.1Despite having
multiple beneficial effects, urbanisation is associated with health consequences due to the accompanying lifestyle changes, including changes in compromised bone health.1,2 Emerging
evidence indicates that black, urban postmenopausal women are at increased risk of the development of low bone mass, decreased bone formation and bone turnover, as well as increased bone degradation resulting from inadequate dietary intake, reduced physical activity and low vitamin D status.1,3
Conflicting results regarding the individual associations between lean mass, as well as fat mass, with bone mineral density (BMD) have been previously demonstrated.4A
cross-sec-tional study conducted by Sotunde and co-workers (2015) has shown that lean mass has a stronger association with BMD in comparison with fat mass in urban black South African women.5
It was previously believed that black women had a greater pro-tection against the development of osteoporosis in comparison with white women due to their enhanced BMD. Studies indicat-ing this difference were primarily conducted in America and Europe.6,7 However, over the last few decades osteoporosis
has been recognised as a disease with a high incidence in urba-nised areas in low- and middle-income countries, including South Africa.3 The effects of human immunodeficiency virus
(HIV) infection on bone metabolism has not been recognised as a cause of substantial increase in the prevalence of osteope-nia and osteoporosis amongst HIV-infected patients in compari-son with non-HIV-infected patients.8–11 Amorosa and Tebas
(2006) concluded that this might be due to the small sample
sizes of earlier studies, thus limiting the strength of their conclusions.12
HIV infection is considered to be a chronic but treatable disease.13 The life expectancy of people living with this virus
has increased due to the introduction of antiretroviral therapy (ART).14 Even though the incidence of acquired immune
deficiency syndrome (AIDS) associated co-morbidities has decreased, other conditions such as osteoporosis and fragility fractures have increased.15–18 A variety of factors could be
responsible for the bone loss and fracture risk, including HIV-associated inflammation, lifestyle and behavioural factors, co-morbid conditions and ART itself, as well as an underlying genetic predisposition.19–23
Studies in Europe, the United States of America and South America regarding the initiation of ART have shown a 2–6% reduction in hip and spine BMD within the first 24–48 weeks after initiation of ART.24–27The rates of osteoporosis and
osteo-penia were found to increase by 15% and 67% respectively, with a 3.7 fold higher osteoporosis rate and 6.4 fold higher decrease in BMD in HIV-positive individuals.28An increased fracture risk
was found in HIV-positive individuals compared with HIV-nega-tive individuals.18The issue of bone health and HIV remains
neg-lected in terms of research and management in Africa, despite the fact that sub-Saharan Africa has a higher incidence of HIV infection than any other region.29Evidence suggests lack of
suf-ficient data on HIV/AIDS and metabolic bone diseases in a region housing two-thirds of persons living with the virus worldwide.30
http://creativecommons.org/licenses/by-nc/4.0
ARTICLE
Journal of Endocrinology, Metabolism and Diabetes of South Africais co-published by NISC (Pty) Ltd, Medpharm Publications, and Informa UK Limited
The aim of this study was therefore to investigate the differences between BMD, lean and fat mass of HIV-positive and HIV-nega-tive black women, and to investigate factors associated with low BMD among HIV-positive and HIV-negative women.
Methods
Setting and design
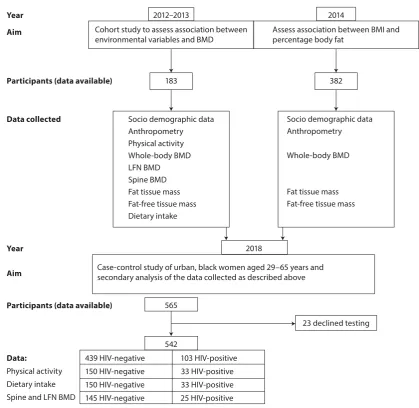
This study was based on secondary analysis of data collected from 2012 to 2014 in two different studies, conducted in Potch-efstroom, as indicated inFigure 1. The first study during 2012– 2013 (n= 183) was a cohort study to assess associations between environmental variables (such as diet and physical activity) and BMD, while the aim of the second study (n= 382) was to assess the association between body mass index (BMI) and percentage body fat categories.
Inclusion criteria for the first study were: female participants of black ethnicity, 35–65 years of age, apparently healthy and able to understand English, Afrikaans or Setswana. Participants who were stable and on chronic medication for diseases such as hypertension and HIV infection were included. Exclusion cri-teria were: men, pregnant or lactating women and women younger than 35 years or older than 65 years of age. Participants with any other diagnosed acute or non-communicable chronic diseases were also excluded from the study.
The following data were collected on 183 women: sociodemo-graphic data, anthropometry, physical activity, whole-body BMD, left femur neck of the hip (LFN) BMD and spine BMD, fat tissue mass and fat-free tissue mass of the whole body measured by dual-energy X-ray absorptiometry (DXA). In addition, dietary intakes of the same participants were measured by validated quantitative food frequency questionnaire (QFFQ)31and phys-ical activity was measured using a modified Baecke physphys-ical activity questionnaire validated for this population.32
During 2014, women (n= 382) were recruited for the second study, but in this study, only whole-body BMD, anthropometry and sociodemographic data were collected, while physical activity and dietary data were not collected due to lack of resources.
Inclusion criteria for the second study were: apparently healthy, black individuals between the ages of 32 and 93 years, who lived in the study areas for most days of the week. Participants who were stable and on chronic medication for diseases such as hypertension, type 2 diabetes mellitus and HIV infection were included.
Exclusion criteria: black adults younger than 32 and older than 95 years, who did not live in the study areas on most days of the week. Participants that did not give informed consent, or who were pregnant and acutely ill, were also excluded.
The page number in the footer is not for bibliographic referencing www.tandfonline.com/oemd 24
A total of 565 apparently healthy, urban women were available for this study, of whom 103 were HIV-positive. Because 23 women declined HIV testing, complete data for 542 participants were available for analysis. Within the total group, data for spine and LFN BMD were only available for 25 HIV-positive women and 145 HIV-negative women, while physical activity data were only available for 33 HIV-positive women and 150 HIV-negative women, respectively (Figure 1).
The current study was a case-control study of these urban, black women aged 29–65 years, from Potchefstroom in the North West province, South Africa and secondary analysis of the data collected as described above. Inclusion criteria were female gender, black ethnicity, 29–65 years old and not physically dis-abled. Women previously diagnosed with hypertension were included, because exclusion of these women would result in a smaller, non-representative sample, since almost one-third of the adult South African population has hypertension.33Exclusion criteria were pregnancy, lactation and participants with any other diagnosed acute or chronic disease, excluding hyperten-sion and known HIV infection. In addition, each participant was tested for HIV infection on the study day in order to confirm HIV status.
Ethics approval was obtained for secondary data analysis from the Health Research Ethics Committee (NWU-00061-17-S1), North-West University (NWU), Potchefstroom Campus. The orig-inal projects were conducted under ethical conditions according to the Declaration of Helsinki (WMA, 2013) and ethical approval was obtained for both studies from the Health Research Ethics Committee, NWU (NWU-00060-14-A1, NWU-00010-16-A1). The study participants signed written informed consent forms before participation. Participation was voluntarily.
Measurements
The sociodemographic and health information of the women (age, educational status, housing, occupation, smoking, chronic medication) were determined through an interviewer-administered structured questionnaire. Self-reported hyperten-sion and use of all medication were recorded. Height and weight measurements were performed using a calibrated digital scale with stadiometer (Seca 264, Hamburg, Germany). Height (cm) was measured to the nearest 0.1 cm with the partici-pant barefoot and with the head in the Frankfort plane. Weight was measured to the nearest 0.01 kg. BMI was calculated as weight (kg) divided by height (m) squared.34
Pregnancy tests were performed before DXA measurements to confirm non-pregnancy. Whole-body BMD, LFN BMD and spine BMD, fat tissue mass and fat-free tissue mass of the whole body were measured by a registered radiographer, by using DXA with the default Hologic settings (Hologic Discovery W, APEX system software version 2.3.1). Percentage body fat was calculated by the DXA software. Study participants whose bodyweights exceeded the DXA measuring stipulations (130 kg) could not be measured by DXA and were therefore sub-sequently excluded from the statistical analysis. Appendicular skeletal muscle mass (ASM) was derived as the sum of the fat-free soft tissue mass (excluding bone) of the arms and the legs.35 Appendicular skeletal muscle mass index was derived
from ASM (kg) divided by height (m) squared.
HIV testing
Written informed consent was obtained from each individual participant before HIV testing. Trained HIV counsellors did
group pre-test counselling before the test. A finger prick (capil-lary) HIV test (First Response Rapid Card Test, Premier Medical Corporation Ltd, Kachigam, India) was performed on each par-ticipant. In the case of a positive test result, the test was con-firmed using the Pareeshak card test (BHAT Bio-Tech India, Bangalore, India). The participants with positive HIV test results received individual post-test counselling and were referred for follow-up care and CD4 counts at their nearest healthcare facility.
Statistical analysis
Distribution of variables was assessed using the Kolmogorov– Smirnov test and QQ plots. Descriptive statistics (median, inter-quartile range) was used to present the study participants’age and body composition variables, since all variables deviated from the normal distribution. Categorical data were presented as number and percentage. Differences between BMD, lean and fat mass, trunk fat mass and ASM of positive and HIV-negative black women was determined using the Mann– Whitney test, while age-adjusted differences were determined using analysis of covariance. The correlation between all vari-ables was determined by Spearman rank correlation analysis. Multivariable regression was done to assess associations with BMD in the total sample and two groups separately with adjust-ment for age, smoking, educational status, alcohol intake, calcium intake and physical activity. HIV-positive women (n= 103) were matched with 103 HIV-negative women, paired according to their (1) age and (2) BMI. Statistical analyses per-formed in the total groups of HIV-positive and HIV-negative women were repeated in the matched groups. Statistical ana-lyses were performed using the SPSS version 25 statistical soft-ware program (IBM Corp, Armonk, NY, USA). The level of significance was set atp≤0.05.
Results
The demographic information indicated that a total of 23.1% of the participants smoked, 78.8% lived in brick houses, 97.7% had running water, 93.7% had flush toilets, 82.9% had electricity and 86% had televisions. In total 49.5% of the group was unem-ployed, while 23% were wage earners such as domestic workers or cleaners and 21.6% of the group were pensioners. A total of 18% had no school education, 27% had a primary school education level and 52.2% had high school education. Accurate data regarding the HIV regimen of the women and dur-ation of ART use could not be reported by the participants; however, from the available data most women reported the use of tenofovir disoproxil fumarate (TDF) 300 mg in combi-nation with lamivudine (3TC) and efavirenz (EFV) and the dur-ation ranged between three and eight years.
Participant characteristics for the total groups of HIV-positive and HIV-negative women are presented inTable 1. HIV-negative women had significantly higher median BMD, % body fat (%BF), body mass index (BMI), waist circumference (WC), ASM and ASM index compared with their positive counterparts. The positive women were significantly younger than the HIV-negative women. Smokers had significantly lower whole-body BMD, %BF, ASM and ASM index than non-smokers. Significant positive correlations between BMI (r= 0.51, p< 0.0001), ASM (r= 0.09, p= 0.03), ASM index (r= 0.52, p< 0.0001), %BF (r= 0.38, p< 0.0001), respectively, and whole-body BMD were found, as well as a negative correlation between age and whole-body BMD (r=−0.29,p< 0.0001).
25
A total of 565 apparently healthy, urban women were available for this study, of whom 103 were HIV-positive. Because 23 women declined HIV testing, complete data for 542 participants were available for analysis. Within the total group, data for spine and LFN BMD were only available for 25 HIV-positive women and 145 HIV-negative women, while physical activity data were only available for 33 HIV-positive women and 150 HIV-negative women, respectively (Figure 1).
The current study was a case-control study of these urban, black women aged 29–65 years, from Potchefstroom in the North West province, South Africa and secondary analysis of the data collected as described above. Inclusion criteria were female gender, black ethnicity, 29–65 years old and not physically dis-abled. Women previously diagnosed with hypertension were included, because exclusion of these women would result in a smaller, non-representative sample, since almost one-third of the adult South African population has hypertension.33Exclusion criteria were pregnancy, lactation and participants with any other diagnosed acute or chronic disease, excluding hyperten-sion and known HIV infection. In addition, each participant was tested for HIV infection on the study day in order to confirm HIV status.
Ethics approval was obtained for secondary data analysis from the Health Research Ethics Committee (NWU-00061-17-S1), North-West University (NWU), Potchefstroom Campus. The orig-inal projects were conducted under ethical conditions according to the Declaration of Helsinki (WMA, 2013) and ethical approval was obtained for both studies from the Health Research Ethics Committee, NWU (NWU-00060-14-A1, NWU-00010-16-A1). The study participants signed written informed consent forms before participation. Participation was voluntarily.
Measurements
The sociodemographic and health information of the women (age, educational status, housing, occupation, smoking, chronic medication) were determined through an interviewer-administered structured questionnaire. Self-reported hyperten-sion and use of all medication were recorded. Height and weight measurements were performed using a calibrated digital scale with stadiometer (Seca 264, Hamburg, Germany). Height (cm) was measured to the nearest 0.1 cm with the partici-pant barefoot and with the head in the Frankfort plane. Weight was measured to the nearest 0.01 kg. BMI was calculated as weight (kg) divided by height (m) squared.34
Pregnancy tests were performed before DXA measurements to confirm non-pregnancy. Whole-body BMD, LFN BMD and spine BMD, fat tissue mass and fat-free tissue mass of the whole body were measured by a registered radiographer, by using DXA with the default Hologic settings (Hologic Discovery W, APEX system software version 2.3.1). Percentage body fat was calculated by the DXA software. Study participants whose bodyweights exceeded the DXA measuring stipulations (130 kg) could not be measured by DXA and were therefore sub-sequently excluded from the statistical analysis. Appendicular skeletal muscle mass (ASM) was derived as the sum of the fat-free soft tissue mass (excluding bone) of the arms and the legs.35 Appendicular skeletal muscle mass index was derived
from ASM (kg) divided by height (m) squared.
HIV testing
Written informed consent was obtained from each individual participant before HIV testing. Trained HIV counsellors did
group pre-test counselling before the test. A finger prick (capil-lary) HIV test (First Response Rapid Card Test, Premier Medical Corporation Ltd, Kachigam, India) was performed on each par-ticipant. In the case of a positive test result, the test was con-firmed using the Pareeshak card test (BHAT Bio-Tech India, Bangalore, India). The participants with positive HIV test results received individual post-test counselling and were referred for follow-up care and CD4 counts at their nearest healthcare facility.
Statistical analysis
Distribution of variables was assessed using the Kolmogorov– Smirnov test and QQ plots. Descriptive statistics (median, inter-quartile range) was used to present the study participants’age and body composition variables, since all variables deviated from the normal distribution. Categorical data were presented as number and percentage. Differences between BMD, lean and fat mass, trunk fat mass and ASM of positive and HIV-negative black women was determined using the Mann– Whitney test, while age-adjusted differences were determined using analysis of covariance. The correlation between all vari-ables was determined by Spearman rank correlation analysis. Multivariable regression was done to assess associations with BMD in the total sample and two groups separately with adjust-ment for age, smoking, educational status, alcohol intake, calcium intake and physical activity. HIV-positive women (n= 103) were matched with 103 HIV-negative women, paired according to their (1) age and (2) BMI. Statistical analyses per-formed in the total groups of HIV-positive and HIV-negative women were repeated in the matched groups. Statistical ana-lyses were performed using the SPSS version 25 statistical soft-ware program (IBM Corp, Armonk, NY, USA). The level of significance was set atp≤0.05.
Results
The demographic information indicated that a total of 23.1% of the participants smoked, 78.8% lived in brick houses, 97.7% had running water, 93.7% had flush toilets, 82.9% had electricity and 86% had televisions. In total 49.5% of the group was unem-ployed, while 23% were wage earners such as domestic workers or cleaners and 21.6% of the group were pensioners. A total of 18% had no school education, 27% had a primary school education level and 52.2% had high school education. Accurate data regarding the HIV regimen of the women and dur-ation of ART use could not be reported by the participants; however, from the available data most women reported the use of tenofovir disoproxil fumarate (TDF) 300 mg in combi-nation with lamivudine (3TC) and efavirenz (EFV) and the dur-ation ranged between three and eight years.
Participant characteristics for the total groups of HIV-positive and HIV-negative women are presented inTable 1. HIV-negative women had significantly higher median BMD, % body fat (%BF), body mass index (BMI), waist circumference (WC), ASM and ASM index compared with their positive counterparts. The positive women were significantly younger than the HIV-negative women. Smokers had significantly lower whole-body BMD, %BF, ASM and ASM index than non-smokers. Significant positive correlations between BMI (r= 0.51, p< 0.0001), ASM (r= 0.09, p= 0.03), ASM index (r= 0.52, p< 0.0001), %BF (r= 0.38, p< 0.0001), respectively, and whole-body BMD were found, as well as a negative correlation between age and whole-body BMD (r=−0.29,p< 0.0001).
Data were matched for HIV-negative and HIV-positive groups as indicated in Table 2. No significant differences were found between these two groups, but spine BMD was marginally lower in HIV-positive women (p= 0.05) and there was also a trend for lower LFN BMD in the same participants.
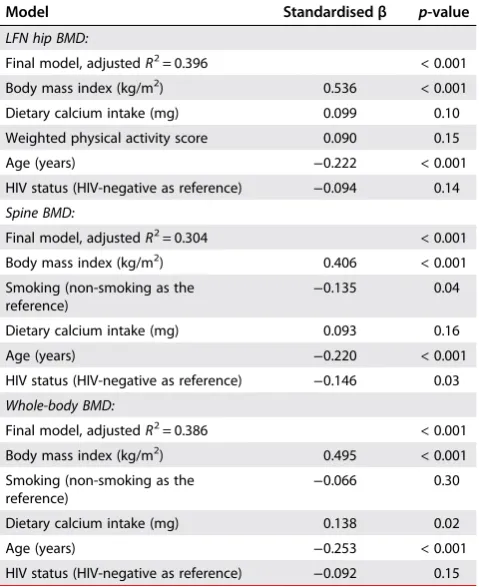
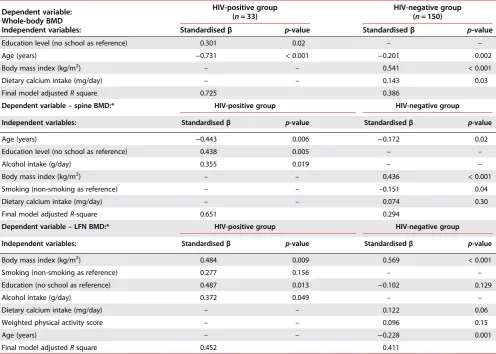
In the regression models, whole-body BMD, as well as spine BMD and LFN BMD, respectively, were used as dependent variables. Covariates included age, educational status, smoking, alcohol intake, calcium intake, HIV status (total group only), as well as physical activity level. In the total group, age, smoking and HIV status (negative association) were associated with lower BMD, while calcium intake and BMI were positively associated with whole body BMD (Table 3). Smoking, BMI, dietary calcium intake, age and HIV status explained 30.4% of the variance in spine BMD and 38.6% of the variance in whole-body BMD. Only age and education were found to be consistently associ-ated with whole-body and spine BMD in the HIV-positive group and explained 72.5% of the variance in whole-body BMD (Table 4).
Discussion
The main finding of this study indicated that different exposures were associated with low whole-body BMD among HIV-positive and HIV-negative women, as well as with whole-body BMD at the different sites. The study found that low whole-body BMD was more common among HIV-positive women compared with HIV-negative women. BMI, dietary calcium intake (positive) and age (negative) were associated with whole-body BMD in HIV-negative women. However, only age and education were consistently associated with whole-body BMD in the HIV-posi-tive group. This could indicate that HIV-posiHIV-posi-tive women who are older and have low education levels may be at an increased risk for the development of low whole-body BMD.
The study found a significant positive correlation between whole-body BMD, %BF, ASM and ASM index of HIV-positive and HIV-negative women. No significant differences were found between the matched groups, possibly due to the fact that similar variables are associated with BMI and whole-body BMD. However, spine and LFN BMD tended to be lower in HIV-Table 1:Descriptive data for the total group (median, IQR)
Variable n HIV-negative n HIV-positive p-value*
Age (years) 439 52 (47;59) 103 47 (42;53) < 0.001
BMI (kg/m2) 439 30.5 (25;36) 103 24.7 (21;31) < 0.001
Waist circumference (cm) 439 90.3 (79;100) 103 79.1 (70;88) < 0.001
Fat percentage (%) 439 41.8 (36;46) 103 36.2 (29;41) < 0.001
Fat (kg) 439 30.7 (22;39) 103 21.4 (15;30) < 0.001
Whole-body BMD (g/cm2) 439 1.06 (0.98;1.14) 103 1.04 (0.98;1.12) 0.03
LFN BMD (g/cm2)+ 145 0.80 (0.67;0.85) 25 0.67 (0.63;0.83) 0.053
Spine BMD (g/cm2)+ 145 0.88 (0.78;0.94) 25 0.78 (0.73;0.86) 0.005
Appendicular skeletal mass (ASM) (kg) 439 17.44 (14.46;20.02) 103 15.44 (13.24;17.88) < 0.001
ASM index (kg/m2) 439 7.02 (6.04;8.07) 103 6.35 (5.50; 7.31) < 0.001
Smokers (%) 439 24.4% 103 20.4% 0.31
Alcohol (g) 439 0 (0;12.2) 103 3.4 (0;27) 0.10
Physical activity (PA) index (score) 150 2.99 (2.62;3.15) 33 2.93 (2.64;3.26) 0.12
Notes: Median and interquartile ranges (25th, 75th percentiles) are indicated for non-normally distributed data; *p-values reflect significant differences between the two groups; Mann–Whitney test or chi-square for categorical data;+missing for some variables, LFN = left femoral neck, BMD = bone mineral density, BMI = body mass index.
Table 2:Matched data for HIV-negative and HIV-positive groups
Variable HIV-negativen= 103 HIV-positiven= 103 p-value*
Age (years) 48 (45;53) 48 (43;54) 0.28
Weight (kg) 61.6 (52;75) 60.8 (51;76) 0.67
Height (cm) 157.4 (152;161) 156.5 (152;160) 0.37
BMI (kg/m2) 25.1 (21;31) 24.7 (21;31) 0.85
Waist circumference (cm) 79.5 (71;93) 79.1 (71;88) 0.66
Fat percentage (%) 36.9 (32;42) 36.2 (30;42) 0.32
Body fat (kg) 22.2 (16;31) 21.4 (15;30) 0.37
BMD (g/cm2) 1.02 (0.97;1.14) 1.03 (0.95;1.09) 0.44
Spine BMD (g/cm2)* 0.88 (0.78;0.94) 0.78 (0.73;0.86) 0.05
LFN BMD (g/cm2)* 0.80 (0.67;0.85) 0.67 (0.63;0.83) 0.09
Appendicular skeletal mass (ASM) (kg) 15.56 (13.27;18.44) 15.4 (13.24; 17.84) 0.75
ASM index (kg/m2) 6.33 (5.51; 7.19) 6.35 (5.50; 7.28) 0.98
Trunk fat (kg) 10.37 (6.51;14.18) 9.21 (6.55;13.93) 0.50
Peripheral fat (kg) 12.25 (8.13;16.03) 11.32 (7.82;15.63) 0.44
The page number in the footer is not for bibliographic referencing www.tandfonline.com/oemd 26
positive compared with HIV-negative women. HIV infection has been associated with low BMD in previous studies.26Low BMD
levels were also found in young HIV-infected patients, with a mean age of 34.6 years.36
BMI was significantly associated with whole-body BMD. A variety of previous studies have also indicated a positive relationship between BMI, bodyweight and BMD.37,38 An increased BMI is
thought to be protective against osteoporosis, as well as bone loss due to the increased mechanical loading of bodyweight on bone.39 Previous studies have also found a positive
corre-lation between body fat and BMD.37A cross-sectional study con-ducted by Sotunde and co-workers in a similar population group showed lean mass had a stronger association with bone health in comparison with fat mass.5
There are a variety of risk factors for osteoporosis, including sex, age, race, family history, menopausal status, weight, physical activity and smoking, as well as alcohol consumption.40–42 As
expected, age in this study was found to be associated with sig-nificantly lower whole-body BMD at all sites.
Smoking explained some of the variance found in whole-body BMD, but it was found to be significantly associated only with spine BMD. Smoking is known to be a risk factor for the develop-ment of osteoporosis, especially in the HIV-positive population group.36Smoking has also been linked to low BMD levels and
increased bone resorption, related to HIV infection.43,44A
posi-tive association between alcohol intake and LFN BMD was found in the HIV-positive group, and the direction of the associ-ation between smoking and LFN BMD was also positive. The HIV-positive women in this study had generally low alcohol intakes, with a median intake of 3.4 g/day and those who smoked used
between 2 and 10 cigarettes daily. The unexpected associations found in this study may also be a result of the small sample size of HIV-positive women, and should be interpreted with caution.
HIV status contributed to the variance found in whole-body BMD in the total group. HIV infection as well as ART is known to result in increased bone loss.26People living with HIV have also been found to have a 58% higher fracture rate when compared with the general population.45–47A variety of studies have
inves-tigated the effect of highly active antiretroviral therapy (HAART) on BMD.48,49This study had incomplete data regarding the HIV regimen and duration of HAART therapy of the women; however, most women reported the use of tenofovir disoproxil fumarate (TDF) 300 mg in combination with lamivudine (3TC) and efavirenz (EFV). A previously conducted study indicated that the primary factors associated with lower baseline BMD were low bodyweight and smoking, as well as a long period of HIV infection (≥ 17 years).48 Antiretroviral therapy (ART) may
also affect bone metabolism through decreased activation of calcitriol (1,25-dihydroxyvitamin D3).50TDF has been associated
with increased bone loss compared with other reverse transcrip-tase inhibitors.26Studies report that TDF usage is associated with
increased vitamin D binding protein and increased PTH, as well as decreased free 1,25-dihydroxyvitamin D3 levels.51 This is
indicative of a functional vitamin D deficiency with TDF usage contributing to excess bone loss.52 A study by Dave and
co-workers (2018) on the prevalence and correlates of low BMD in HIV-positive South Africans, found that efavirenz or lopinavir exposure was strongly associated with a low BMD of the hip.46
The study also found that the exposure to efavirenz led to a higher prevalence of vitamin D deficiency.46The use of efavirenz
was also found to be inversely associated with lumbar spine BMD, after adjustments for age, weight and sex.46
Dietary calcium intake was significantly associated with whole-body BMD and explained some of the variance found in BMD. Urbanisation is known to be associated with lower calcium intake in black South African women.53Furthermore, lower
con-sumption of milk and dairy products was found in urban than rural women in a South African study.53 Achieving optimal
calcium levels is known to be beneficial to the attainment as well as maintenance of BMD.54A variety of studies have
exam-ined the effect of calcium supplementation on the risk of cardi-ovascular events.55,56A study conducted by Galli and co-workers
found that an optimal dietary calcium intake in HIV-infected patients predicted a high cardiovascular risk.57 The proposed
mechanism was linked to the multifactorial causes of cardiovas-cular risk in HIV-infected patients. This includes complex inter-actions between traditional risk factors, lifestyle, HIV-related and combination antiretroviral therapy factors.57
Physical activity was positively associated with LFN BMD in the HIV-negative women. Studies conducted in high-risk population groups such as postmenopausal women found that physical activity improved BMD and decreased fracture risk.58,59
Limited data are available regarding the impact of physical activity on BMD in people living with HIV, but it may produce similar benefits.60It appears that physical activity is particularly
associated with LFN BMD, more than spine BMD. This could be suggestive of the hip being more involved in the movement of large muscle groups. Strategies should therefore aim to increase physical activity among older HIV-positive women to prevent hip fractures. A study of strength training in 20 HIV-posi-tive men found a significant increase in all BMD regions, specifi-cally the femoral neck (8.45%), lumbar spine (3.28%) and 1/3 radius (5.41%).60A similar study of brisk walking and strength
Table 3:Multiple regression models for the association with whole BMD, spine BMD and LFN BMD in the total group (n= 542)*
Model Standardisedβ p-value
LFN hip BMD:
Final model, adjustedR2= 0.396 < 0.001
Body mass index (kg/m2) 0.536 < 0.001
Dietary calcium intake (mg) 0.099 0.10
Weighted physical activity score 0.090 0.15
Age (years) −0.222 < 0.001
HIV status (HIV-negative as reference) −0.094 0.14
Spine BMD:
Final model, adjustedR2= 0.304 < 0.001
Body mass index (kg/m2) 0.406 < 0.001
Smoking (non-smoking as the
reference) −
0.135 0.04
Dietary calcium intake (mg) 0.093 0.16
Age (years) −0.220 < 0.001
HIV status (HIV-negative as reference) −0.146 0.03
Whole-body BMD:
Final model, adjustedR2= 0.386 < 0.001
Body mass index (kg/m2) 0.495 < 0.001
Smoking (non-smoking as the
reference) −
0.066 0.30
Dietary calcium intake (mg) 0.138 0.02
Age (years) −0.253 < 0.001
HIV status (HIV-negative as reference) −0.092 0.15
*Missing data for some variables; LFN = left femoral neck.
27
positive compared with HIV-negative women. HIV infection has been associated with low BMD in previous studies.26Low BMD
levels were also found in young HIV-infected patients, with a mean age of 34.6 years.36
BMI was significantly associated with whole-body BMD. A variety of previous studies have also indicated a positive relationship between BMI, bodyweight and BMD.37,38 An increased BMI is
thought to be protective against osteoporosis, as well as bone loss due to the increased mechanical loading of bodyweight on bone.39 Previous studies have also found a positive
corre-lation between body fat and BMD.37A cross-sectional study con-ducted by Sotunde and co-workers in a similar population group showed lean mass had a stronger association with bone health in comparison with fat mass.5
There are a variety of risk factors for osteoporosis, including sex, age, race, family history, menopausal status, weight, physical activity and smoking, as well as alcohol consumption.40–42 As
expected, age in this study was found to be associated with sig-nificantly lower whole-body BMD at all sites.
Smoking explained some of the variance found in whole-body BMD, but it was found to be significantly associated only with spine BMD. Smoking is known to be a risk factor for the develop-ment of osteoporosis, especially in the HIV-positive population group.36Smoking has also been linked to low BMD levels and
increased bone resorption, related to HIV infection.43,44A
posi-tive association between alcohol intake and LFN BMD was found in the HIV-positive group, and the direction of the associ-ation between smoking and LFN BMD was also positive. The HIV-positive women in this study had generally low alcohol intakes, with a median intake of 3.4 g/day and those who smoked used
between 2 and 10 cigarettes daily. The unexpected associations found in this study may also be a result of the small sample size of HIV-positive women, and should be interpreted with caution.
HIV status contributed to the variance found in whole-body BMD in the total group. HIV infection as well as ART is known to result in increased bone loss.26People living with HIV have also been found to have a 58% higher fracture rate when compared with the general population.45–47A variety of studies have
inves-tigated the effect of highly active antiretroviral therapy (HAART) on BMD.48,49This study had incomplete data regarding the HIV regimen and duration of HAART therapy of the women; however, most women reported the use of tenofovir disoproxil fumarate (TDF) 300 mg in combination with lamivudine (3TC) and efavirenz (EFV). A previously conducted study indicated that the primary factors associated with lower baseline BMD were low bodyweight and smoking, as well as a long period of HIV infection (≥ 17 years).48 Antiretroviral therapy (ART) may
also affect bone metabolism through decreased activation of calcitriol (1,25-dihydroxyvitamin D3).50TDF has been associated
with increased bone loss compared with other reverse transcrip-tase inhibitors.26Studies report that TDF usage is associated with
increased vitamin D binding protein and increased PTH, as well as decreased free 1,25-dihydroxyvitamin D3 levels.51 This is
indicative of a functional vitamin D deficiency with TDF usage contributing to excess bone loss.52 A study by Dave and
co-workers (2018) on the prevalence and correlates of low BMD in HIV-positive South Africans, found that efavirenz or lopinavir exposure was strongly associated with a low BMD of the hip.46
The study also found that the exposure to efavirenz led to a higher prevalence of vitamin D deficiency.46The use of efavirenz
was also found to be inversely associated with lumbar spine BMD, after adjustments for age, weight and sex.46
Dietary calcium intake was significantly associated with whole-body BMD and explained some of the variance found in BMD. Urbanisation is known to be associated with lower calcium intake in black South African women.53Furthermore, lower
con-sumption of milk and dairy products was found in urban than rural women in a South African study.53 Achieving optimal
calcium levels is known to be beneficial to the attainment as well as maintenance of BMD.54A variety of studies have
exam-ined the effect of calcium supplementation on the risk of cardi-ovascular events.55,56A study conducted by Galli and co-workers
found that an optimal dietary calcium intake in HIV-infected patients predicted a high cardiovascular risk.57 The proposed
mechanism was linked to the multifactorial causes of cardiovas-cular risk in HIV-infected patients. This includes complex inter-actions between traditional risk factors, lifestyle, HIV-related and combination antiretroviral therapy factors.57
Physical activity was positively associated with LFN BMD in the HIV-negative women. Studies conducted in high-risk population groups such as postmenopausal women found that physical activity improved BMD and decreased fracture risk.58,59
Limited data are available regarding the impact of physical activity on BMD in people living with HIV, but it may produce similar benefits.60It appears that physical activity is particularly
associated with LFN BMD, more than spine BMD. This could be suggestive of the hip being more involved in the movement of large muscle groups. Strategies should therefore aim to increase physical activity among older HIV-positive women to prevent hip fractures. A study of strength training in 20 HIV-posi-tive men found a significant increase in all BMD regions, specifi-cally the femoral neck (8.45%), lumbar spine (3.28%) and 1/3 radius (5.41%).60A similar study of brisk walking and strength
Table 3:Multiple regression models for the association with whole BMD, spine BMD and LFN BMD in the total group (n= 542)*
Model Standardisedβ p-value
LFN hip BMD:
Final model, adjustedR2= 0.396 < 0.001
Body mass index (kg/m2) 0.536 < 0.001
Dietary calcium intake (mg) 0.099 0.10
Weighted physical activity score 0.090 0.15
Age (years) −0.222 < 0.001
HIV status (HIV-negative as reference) −0.094 0.14
Spine BMD:
Final model, adjustedR2= 0.304 < 0.001
Body mass index (kg/m2) 0.406 < 0.001
Smoking (non-smoking as the
reference) −
0.135 0.04
Dietary calcium intake (mg) 0.093 0.16
Age (years) −0.220 < 0.001
HIV status (HIV-negative as reference) −0.146 0.03
Whole-body BMD:
Final model, adjustedR2= 0.386 < 0.001
Body mass index (kg/m2) 0.495 < 0.001
Smoking (non-smoking as the
reference) −
0.066 0.30
Dietary calcium intake (mg) 0.138 0.02
Age (years) −0.253 < 0.001
HIV status (HIV-negative as reference) −0.092 0.15
*Missing data for some variables; LFN = left femoral neck.
training found improved spinal and femoral BMD in association with higher physical activity.61However, it should be noted that
both these studies had small sample sizes.62
Limitations of this study include the fact that data on dietary intakes, alcohol intakes and physical activity, as well as site-specific BMD were available only in a subgroup of participants. There were therefore a smaller number of HIV-positive partici-pants with complete data and these results should be inter-preted with caution. However, some published studies had similar small sample sizes.60
In conclusion we found that a decreased whole-body BMD was more common in HIV-positive women compared with HIV-nega-tive women. BMI and calcium intake as well as age were associ-ated with whole-body BMD in HIV-negative women. Only age and education were consistently associated with whole-body BMD in HIV-positive women. In this study, physical activity was also found to be more strongly related to LFN BMD than spine BMD. Future intervention studies aimed at prevention of bone loss and preservation of ASM should focus on underweight women with low educational status, low calcium intakes, high alcohol intakes and smokers, regardless of HIV status.
Disclosure statement – No potential conflict of interest was reported by the authors.
Funding–This work was supported by the South African Medical Research Council [RM77005].
ORCID
C Ellis http://orcid.org/0000-0001-9653-539X HS Kruger http://orcid.org/0000-0002-5365-1777 P Ukegbu http://orcid.org/0000-0002-6731-5344 IM Kruger http://orcid.org/0000-0002-8636-7174 M Viljoen http://orcid.org/0000-0002-4406-3666 MC Kruger http://orcid.org/0000-0002-8646-9672
References
1. Kruger MC, Kruger IM, Wentzel-Viljoen E, et al. Urbanization of black South African women may increase risk of low bone mass due to low vitamin D status, low calcium intake, and high bone turnover.Nutr Res.2011;31:748–758.
2. Vorster JNRHH, Venter CS, Kruger MC, et al. The impact of urbaniz-ation on risk factors for osteoporosis in black postmenopausal South African women.JEMDSA.2002;7(3):92–99.
3. Kruger MC, Dewinter RM, Becker PJ, et al. Changes in markers of bone turnover following urbanisation of black South African women.
JEMDSA.2004;9(1):103–108.
4. Ong T, Sahota O, Tan W, et al. A United Kingdom perspective on the relationship between body mass index (BMI) and bone health: a cross sectional analysis of data from the Nottingham Fracture Liaison Service.Bone.2014;59:207–210.
5. Sotunde OF, Kruger HS, Wright HH, et al. Lean mass appears to be more strongly associated with bone health than fat mass in urban black South African women.J Nutr Health Aging.2015;19(6):628–636. 6. Aloia JF, Vaswani A, Yeh JK, et al. Risk for osteoporosis in black
women.Calcif Tissue Int.1996;59(6):415–423.
7. Handa R, Kalla AA, Maalouf G. Osteoporosis in developing countries.
Best Pract Res Clin Rheumatol.2008;22(4):693–708. Table 4:Multiple regression models for the association with whole BMD, spine BMD and LFN BMD in HIV-negative and HIV-positive groups
Dependent variable: Whole-body BMD
HIV-positive group
(n= 33) HIV-negative group(n= 150)
Independent variables: Standardisedβ p-value Standardisedβ p-value
Education level (no school as reference) 0.301 0.02 – –
Age (years) −0.731 < 0.001 −0.201 0.002
Body mass index (kg/m2) – – 0.541 < 0.001
Dietary calcium intake (mg/day) – – 0.143 0.03
Final model adjustedRsquare 0.725 0.386
Dependent variable–spine BMD:* HIV-positive group HIV-negative group
Independent variables: Standardisedβ p-value Standardisedβ p-value
Age (years) −0.443 0.006 −0.172 0.02
Education level (no school as reference) 0.438 0.005 – –
Alcohol intake (g/day) 0.355 0.019 – –
Body mass index (kg/m2) – – 0.436 < 0.001
Smoking (non-smoking as reference) – – –0.151 0.04
Dietary calcium intake (mg/day) – – 0.074 0.30
Final model adjustedR-square 0.651 0.294
Dependent variable–LFN BMD:* HIV-positive group HIV-negative group
Independent variables: Standardisedβ p-value Standardisedβ p-value
Body mass index (kg/m2) 0.484 0.009 0.569 < 0.001
Smoking (non-smoking as reference) 0.277 0.156 – –
Education (no school as reference) 0.487 0.013 −0.102 0.129
Alcohol intake (g/day) 0.372 0.049 – –
Dietary calcium intake (mg/day) – – 0.122 0.06
Weighted physical activity score – – 0.096 0.15
Age (years) – – −0.228 0.001
The page number in the footer is not for bibliographic referencing www.tandfonline.com/oemd 28
8. Cummings SR, Black DM, Nevitt MC, et al. Bone density at various sites for prediction of hip fractures. The Study of Osteoporotic Fractures Research Group.Lancet.1993;341:72–75.
9. Serrano S, Marinoso ML, Soriano JC, et al. Bone remodelling in human immunodeficiency virus-1-infected patients. A histo-morphometric study.Bone.1995;16:185–191.
10. Paton NIJ, Macallan D, Griffin GE, et al. Bone mineral density in patients with human immunodeficiency virus infection.Calcif Tissue Int.1997;61:30–32.
11. Compston J. HIV infection and bone disease.JIM.2016;280:350–358. 12. Amorosa V, Tebas P. Bone disease and HIV infection.Clin Infect Dis.
2006;42:108–114.
13. Piso RJ, Rothen M, Rothen JP, et al. Per oral substitution with 300000 IU vitamin D (cholecalciferol) reduces bone turnover markers in HIV-infected patients.BMC Infect Dis.2013;13:577.
14. Wada N, Jacobson LP, Cohen M, et al. Cause-specific life expectancies after 35 years of age for human immunodeficiency syndrome-infected and human immunodeficiency syndrome-negative individ-uals followed simultaneously in long-term cohort studies, 1984-2008.Am J Epidemiol.2013;177(2):116–125.
15. Bedimo R, Maalouf NM, Zhang S, et al. Osteoporotic fracture risk associated with cumulative exposure to tenofovir and other antire-troviral agents.AIDS.2012;26:825–831.
16. Yin MT, Kendall MA, Wu X, et al. Fractures after antiretroviral initiation.AIDS.2012;26:2175–2184.
17. Young B, Dao CN, Buchacz K, et al. HIV outpatientstudy (HOPS) inves-tigators: increased rates of bone fracture among HIV- infected persons in the HIV outpatientstudy (HOPS) compared with the U.S. general population. 2000-2006.Clin Infect Dis.2011;52:1061–1068. 18. Triant VA, Brown TT, Lee H, et al. Fracture prevalence among human
immunodeficiency virus (HIV)-infected versus non–HIV-infected patients in a large U.S. healthcare system. J Clin EndocrinMetab. 2008;93:3499–3504.
19. Bolland MJ, Grey AB, Gamble GD, et al. Clinical review: low body weight mediates the relationship between HIV infection and low bone mineral density: a meta-analysis. J Clin Endocrin Metab. 2007;92:4522–4528.
20. Brown TT, Ross AC, Strorer N, et al. Bone turnover, osteoprtegerin/ RANKL and inflammation with antiretroviral initiation: tenofovir versus non-tenofovir regimens.Antivir Ther.2011;36:482–490. 21. Grant PM, Kitch D, McComsey GA, et al. Low baseline CD4+ count is
associated with greater bone mineral density loss after antiretroviral therapy initiation.Clin Infect Dis.2013;57(10):1483–1488.
22. Hernandez-Vallejo SJ, Beaupere C, Larghero J, et al. Hiv protease inhibitors induce senescence and alter osteoblastic potential of human bone marrow mesenchymal stem cells: beneficial effect of pravastatin.Aging Cell.2013;12:955–965.
23. Tebas P, Powderly WG, Claxton S, et al. Accelerated bone mineral loss in HIV-infected patients receiving potent antiretroviral therapy.AIDS. 2000;14:F63–F67.
24. Duvivier C, Kolta S, Assoumou L, et al. Greater decrease in bone mineral density with protease inhibitor regimens compared with non nucleoside reverse transcriptase inhibitor regimens in HIV-1 infected naive patients. AIDS. 2009;27:817–824. doi:10.1097/QAD. 0b013e328328f789.
25. Gallant JE, Staszewski S, Pozniak AL, et al. Efficacy and safety of teno-fovir DF vs. stavudine in combination therapy in antiretroviral-naive patients: a 3-year randomized trial. 903 Study Group. JAMA. 2004;292:191–201.
26. McComsey GA, Tebas P, Shane E, et al. Bone disease in HIV infection: a practical review and recommendations for HIV care providers.Clin Infect Dis.2010;51:937–946.
27. Stellbrink HJ, Orkin C, Arribas JR, et al. Assert Study Group. Comparison of changes in bone density and turnover with abacavir-lamivudine versus tenofovir-emtricitabine in HIV-infected adults: 48-week results from the ASSERT study.Clin Infect Dis.2010;51:963–972.
28. Brown TT, Qaqish RB. Antiretroviral therapy and the prevalence of osteopenia and osteoporosis: a meta-analytic review. AIDS. 2006;20:2165–2174.
29. UNAIDS. Joint United Nations Programme on HIV/AIDS. Global report: UNAIDS report on the global AIDS epidemic. 2016. Available from:
http://www.unaids.org/en/resources/documents/2016/Global-AIDS-update-2016.
30. Alonge TO, Okoje-Adesomoju VN, Atalabi OM, et al. Prevalence of abnormal bone mineral density in HIV-positive patients in Ibadan, Nigeria.J West Afr Coll Surg.2013;3:1–14.
31. Wentzel-Viljoen E, Laubscher R, Kruger A. Using different approaches to assess the reproducibility of a culturally sensitive quantified food frequency questionnaire. S Afr J Clin Nutr. 2011;24:143–148.
32. Kruger HS, Venter CS, Steyn HS. A standardised physical activity ques-tionnaire for a population in transition: the Thusa study.Afr J Phys Health Education Recreat Dance.2000;6:54–64.
33. Norman AW. Receptors for 1α25(OH)2D3: past, present, and future.
J Bone Miner Res.1998;13:1360–1369.
34. ISAK. International Standards for Anthropometric Assessment. Potchefstroom, South Africa: The International Society for the Advancement of Kinanthropometry; 2006.
35. Heymsfield SB, Smith R, Aulet M, et al. Appendicular skeletal muscle mass: measurement by dual-photon absorptiometry.Am J Clin Nutr. 1990;52:214–218.
36. Chiţu-Tișu CE, Barbu EC, Lazăr M, et al. Low bone mineral density and associated risk factors in HIV-infected patients.GERMS. 2016;6(2): 50–59.doi:10.11599/germs.2016.1089.
37. Gonnelli S, Caffarelli C, Nuti R. Obesity and fracture risk.Clin Cases Miner Bone Metab.2014;11(1):9–14.
38. Nguyen TV, Center JR, Eisman JA. Osteoporosis in elderly men and women: effects of dietary calcium, physical activity, and body mass index.J Bone Miner Res.2000;15:322–331.
39. Zhao S, Zhang YK, Harris S, et al. MLO-Y4 osteocytes-like cells support osteoclast formation and activation.J Bone Miner Res.2002;17:2068–
2079.
40. Bow CH, Cheung E, Cheung CL, et al. Ethnic difference of clinical ver-tebral fracture risk.Osteoporos Int.2012;23:879–885.
41. Cheung E, Tsang S, Bow C, et al. Bone loss during menopausal transition among southern Chinese women. Maturitas. 2011; 69(1):50–56.
42. Marcason W. What is the effect of a high protein diet on bone health?
J Am Diet Assoc.2010;3:34.
43. Jones S, Restrepo D, Kasowitz A, et al. Risk factors for decreased bone mineral density and effects of HIV on bone in the elderly.Osteoporos Int.2008;19:913–918.
44. Yin M, Dobkin J, Brudney K, et al. Bone mass and mineral metab-olism in HIV+ postmenopausal women. Osteoporos Int. 2005;16:1345–1352.
45. Shiau S, Broun EC, Arpadi SM, et al. Incident fractures in HIV-infected individuals: a systematic review and meta-analysis. AIDS. 2013;27:1949–1957.
46. Dave JA, Cohen K, Mickelsfield LK, et al. Antiretroviral therapy, especially efavirenz is associated with bone mineral density in HIV infected South Africans. PLoS ONE. 2015;10(12):e0144286. doi:10. 1371/journal.Pone. 0144286.
47. Mulubwa M, Viljoen M, Kruger IM, et al. Bone turnover markers in HIV-infected women on tenofovir-based antiretroviral therapy.S Afr J HIV Med.2017;18(1):9739.doi:10.4102/sajhivmed.v18i1.739.
48. Mondy K, Yarasheski K, Powderly WG, et al. Longitudinal evol-ution of bone mineral density and bone markers in human immu-nodeficiency virus-infected individuals. Clin Infect Dis. 2003;36:482–490.
49. Nolan D, Upton R, McKinnon E, et al. Stable or increasing bone mineral density in HIV-infected patients treated with nelfinavir or indinavir.AIDS.2001;15:1275–1280.
50. Mora S, Sala N, Bricalli D, et al. Bone mineral loss through increased bone turnover in HIV-infected children treated with highly active antiretroviral therapy.AIDS.2001;15:1823–1829.
51. Havens PL, Kiser JJ, Stephensen CB, et al. Adolescent Medicine Trials network for HIV/AIDS Interventions (ATN) 063 Study Team. Association of higher plasma vitamin D binding protein and lower free calcitriol levels with tenofovir disoproxil fumarate use and plasma and intracellular tenofovir pharmacokinetics: cause of a functional vitamin D deficiency? Antimicrob Agents Chemother. 2013;57:5619–5628.doi:10.1128/AAC.01096-13.
56 Journal of Endocrinology, Metabolism and Diabetes of South Africa2019; 24(2):50–57
52. Overton ET, Chan ES, Brown TT, et al. Vitamin D and calcium attenu-ate bone loss with antiretroviral therapy initiation.Ann Intern Med. 2015;162:815–824.doi:10.7326/M14-1409.
53. Macintyre UE, Kruger HS, Venter CS, et al. Dietary intakes of an African population in different stages of transition in the North West Province, South Africa: the THUSA study.Nutr Res.2002;22:239–256. 54. Pothiwala P, Evans EM, Chapman-Novakofski KM. Ethnic variation in risk for osteoporosis among women: a review of biological and behavioural factors.J Womens Health.2006;15(6):709–719. 55. Bolland MJ, Avenell A, Baron JA, et al. Effect of calcium supplements
on risk of myocardial infarction and cardiovascular events: meta-analysis.Br Med J.2010;341:c3691.
56. Li K, Kaaks R, Linseisen J, et al. Associations of dietary calcium intake and calcium supplementation with myocardial infarction and stroke risk and overall cardiovascular mortality in the Heidelberg cohort of the European Prospective Investigation into Cancer and Nutrition study (EPIC-Heidelberg).Heart.2012;98:920–925.
57. Galli L, Rubinacci A, Cocorullo D, et al. Optimal dietary calcium intake in HIV treated patients: no femoral osteoporosis but higher cardio-vascular risk.Clin Nutr.2014;33:363–366.
58. Mendoza N, De Teresa C, Cano A, et al. Benefits of physical exercise in postmenopausal women. Maturitas. 2016;93:83–88. doi:10.1016/j. maturitas.2016.04.017.
59. Xu J, Lombardi G, Jiao W, et al. Effects of exercise on bone status in female subjects, from young girls to postmenopausal women: an overview of systematic reviews and meta-analyses.
Sports Med. 2016;46(8):1165–1182. doi:10.1007/s40279-016-0494-0.
60. Santos WR, Santos WR, Paes PP, et al. Impact of strength training on bone mineral density in patients infected with HIV exhibiting lipody-strophy. J Strenght Cond Res. 2015;29(12):3466–3471.doi:10.1519/ JSC.0000000000001001.
61. Bonato M, Bossolasco S, Galli L, et al. Moderate aerobic exercise (brisk walking) increases bone density in cART-treated persons. JIAS. 2012;15(4):18318.doi:10.7448/IAS.15.6.18318.
62. Perazzo JD, Webel AR, Alam SMK, et al. Relationships between phys-ical activity and bone density in people living with HIV: results from the SATURN-HIV Study.JANAC.2018;29(4):528–537.
Received: 19-10-2018 Accepted: 27-02-2019
29
8. Cummings SR, Black DM, Nevitt MC, et al. Bone density at various sites for prediction of hip fractures. The Study of Osteoporotic Fractures Research Group.Lancet.1993;341:72–75.
9. Serrano S, Marinoso ML, Soriano JC, et al. Bone remodelling in human immunodeficiency virus-1-infected patients. A histo-morphometric study.Bone.1995;16:185–191.
10. Paton NIJ, Macallan D, Griffin GE, et al. Bone mineral density in patients with human immunodeficiency virus infection.Calcif Tissue Int.1997;61:30–32.
11. Compston J. HIV infection and bone disease.JIM.2016;280:350–358. 12. Amorosa V, Tebas P. Bone disease and HIV infection.Clin Infect Dis.
2006;42:108–114.
13. Piso RJ, Rothen M, Rothen JP, et al. Per oral substitution with 300000 IU vitamin D (cholecalciferol) reduces bone turnover markers in HIV-infected patients.BMC Infect Dis.2013;13:577.
14. Wada N, Jacobson LP, Cohen M, et al. Cause-specific life expectancies after 35 years of age for human immunodeficiency syndrome-infected and human immunodeficiency syndrome-negative individ-uals followed simultaneously in long-term cohort studies, 1984-2008.Am J Epidemiol.2013;177(2):116–125.
15. Bedimo R, Maalouf NM, Zhang S, et al. Osteoporotic fracture risk associated with cumulative exposure to tenofovir and other antire-troviral agents.AIDS.2012;26:825–831.
16. Yin MT, Kendall MA, Wu X, et al. Fractures after antiretroviral initiation.AIDS.2012;26:2175–2184.
17. Young B, Dao CN, Buchacz K, et al. HIV outpatientstudy (HOPS) inves-tigators: increased rates of bone fracture among HIV- infected persons in the HIV outpatientstudy (HOPS) compared with the U.S. general population. 2000-2006.Clin Infect Dis.2011;52:1061–1068. 18. Triant VA, Brown TT, Lee H, et al. Fracture prevalence among human
immunodeficiency virus (HIV)-infected versus non–HIV-infected patients in a large U.S. healthcare system. J Clin EndocrinMetab. 2008;93:3499–3504.
19. Bolland MJ, Grey AB, Gamble GD, et al. Clinical review: low body weight mediates the relationship between HIV infection and low bone mineral density: a meta-analysis. J Clin Endocrin Metab. 2007;92:4522–4528.
20. Brown TT, Ross AC, Strorer N, et al. Bone turnover, osteoprtegerin/ RANKL and inflammation with antiretroviral initiation: tenofovir versus non-tenofovir regimens.Antivir Ther.2011;36:482–490. 21. Grant PM, Kitch D, McComsey GA, et al. Low baseline CD4+ count is
associated with greater bone mineral density loss after antiretroviral therapy initiation.Clin Infect Dis.2013;57(10):1483–1488.
22. Hernandez-Vallejo SJ, Beaupere C, Larghero J, et al. Hiv protease inhibitors induce senescence and alter osteoblastic potential of human bone marrow mesenchymal stem cells: beneficial effect of pravastatin.Aging Cell.2013;12:955–965.
23. Tebas P, Powderly WG, Claxton S, et al. Accelerated bone mineral loss in HIV-infected patients receiving potent antiretroviral therapy.AIDS. 2000;14:F63–F67.
24. Duvivier C, Kolta S, Assoumou L, et al. Greater decrease in bone mineral density with protease inhibitor regimens compared with non nucleoside reverse transcriptase inhibitor regimens in HIV-1 infected naive patients. AIDS. 2009;27:817–824. doi:10.1097/QAD. 0b013e328328f789.
25. Gallant JE, Staszewski S, Pozniak AL, et al. Efficacy and safety of teno-fovir DF vs. stavudine in combination therapy in antiretroviral-naive patients: a 3-year randomized trial. 903 Study Group. JAMA. 2004;292:191–201.
26. McComsey GA, Tebas P, Shane E, et al. Bone disease in HIV infection: a practical review and recommendations for HIV care providers.Clin Infect Dis.2010;51:937–946.
27. Stellbrink HJ, Orkin C, Arribas JR, et al. Assert Study Group. Comparison of changes in bone density and turnover with abacavir-lamivudine versus tenofovir-emtricitabine in HIV-infected adults: 48-week results from the ASSERT study.Clin Infect Dis.2010;51:963–972.
28. Brown TT, Qaqish RB. Antiretroviral therapy and the prevalence of osteopenia and osteoporosis: a meta-analytic review. AIDS. 2006;20:2165–2174.
29. UNAIDS. Joint United Nations Programme on HIV/AIDS. Global report: UNAIDS report on the global AIDS epidemic. 2016. Available from:
http://www.unaids.org/en/resources/documents/2016/Global-AIDS-update-2016.
30. Alonge TO, Okoje-Adesomoju VN, Atalabi OM, et al. Prevalence of abnormal bone mineral density in HIV-positive patients in Ibadan, Nigeria.J West Afr Coll Surg.2013;3:1–14.
31. Wentzel-Viljoen E, Laubscher R, Kruger A. Using different approaches to assess the reproducibility of a culturally sensitive quantified food frequency questionnaire. S Afr J Clin Nutr. 2011;24:143–148.
32. Kruger HS, Venter CS, Steyn HS. A standardised physical activity ques-tionnaire for a population in transition: the Thusa study.Afr J Phys Health Education Recreat Dance.2000;6:54–64.
33. Norman AW. Receptors for 1α25(OH)2D3: past, present, and future.
J Bone Miner Res.1998;13:1360–1369.
34. ISAK. International Standards for Anthropometric Assessment. Potchefstroom, South Africa: The International Society for the Advancement of Kinanthropometry; 2006.
35. Heymsfield SB, Smith R, Aulet M, et al. Appendicular skeletal muscle mass: measurement by dual-photon absorptiometry.Am J Clin Nutr. 1990;52:214–218.
36. Chiţu-Tișu CE, Barbu EC, Lazăr M, et al. Low bone mineral density and associated risk factors in HIV-infected patients. GERMS. 2016;6(2): 50–59.doi:10.11599/germs.2016.1089.
37. Gonnelli S, Caffarelli C, Nuti R. Obesity and fracture risk.Clin Cases Miner Bone Metab.2014;11(1):9–14.
38. Nguyen TV, Center JR, Eisman JA. Osteoporosis in elderly men and women: effects of dietary calcium, physical activity, and body mass index.J Bone Miner Res.2000;15:322–331.
39. Zhao S, Zhang YK, Harris S, et al. MLO-Y4 osteocytes-like cells support osteoclast formation and activation.J Bone Miner Res.2002;17:2068–
2079.
40. Bow CH, Cheung E, Cheung CL, et al. Ethnic difference of clinical ver-tebral fracture risk.Osteoporos Int.2012;23:879–885.
41. Cheung E, Tsang S, Bow C, et al. Bone loss during menopausal transition among southern Chinese women. Maturitas. 2011; 69(1):50–56.
42. Marcason W. What is the effect of a high protein diet on bone health?
J Am Diet Assoc.2010;3:34.
43. Jones S, Restrepo D, Kasowitz A, et al. Risk factors for decreased bone mineral density and effects of HIV on bone in the elderly.Osteoporos Int.2008;19:913–918.
44. Yin M, Dobkin J, Brudney K, et al. Bone mass and mineral metab-olism in HIV+ postmenopausal women. Osteoporos Int. 2005;16:1345–1352.
45. Shiau S, Broun EC, Arpadi SM, et al. Incident fractures in HIV-infected individuals: a systematic review and meta-analysis. AIDS. 2013;27:1949–1957.
46. Dave JA, Cohen K, Mickelsfield LK, et al. Antiretroviral therapy, especially efavirenz is associated with bone mineral density in HIV infected South Africans. PLoS ONE. 2015;10(12):e0144286. doi:10. 1371/journal.Pone. 0144286.
47. Mulubwa M, Viljoen M, Kruger IM, et al. Bone turnover markers in HIV-infected women on tenofovir-based antiretroviral therapy.S Afr J HIV Med.2017;18(1):9739.doi:10.4102/sajhivmed.v18i1.739.
48. Mondy K, Yarasheski K, Powderly WG, et al. Longitudinal evol-ution of bone mineral density and bone markers in human immu-nodeficiency virus-infected individuals. Clin Infect Dis. 2003;36:482–490.
49. Nolan D, Upton R, McKinnon E, et al. Stable or increasing bone mineral density in HIV-infected patients treated with nelfinavir or indinavir.AIDS.2001;15:1275–1280.
50. Mora S, Sala N, Bricalli D, et al. Bone mineral loss through increased bone turnover in HIV-infected children treated with highly active antiretroviral therapy.AIDS.2001;15:1823–1829.
51. Havens PL, Kiser JJ, Stephensen CB, et al. Adolescent Medicine Trials network for HIV/AIDS Interventions (ATN) 063 Study Team. Association of higher plasma vitamin D binding protein and lower free calcitriol levels with tenofovir disoproxil fumarate use and plasma and intracellular tenofovir pharmacokinetics: cause of a functional vitamin D deficiency? Antimicrob Agents Chemother. 2013;57:5619–5628.doi:10.1128/AAC.01096-13.
52. Overton ET, Chan ES, Brown TT, et al. Vitamin D and calcium attenu-ate bone loss with antiretroviral therapy initiation.Ann Intern Med. 2015;162:815–824.doi:10.7326/M14-1409.
53. Macintyre UE, Kruger HS, Venter CS, et al. Dietary intakes of an African population in different stages of transition in the North West Province, South Africa: the THUSA study.Nutr Res.2002;22:239–256. 54. Pothiwala P, Evans EM, Chapman-Novakofski KM. Ethnic variation in risk for osteoporosis among women: a review of biological and behavioural factors.J Womens Health.2006;15(6):709–719. 55. Bolland MJ, Avenell A, Baron JA, et al. Effect of calcium supplements
on risk of myocardial infarction and cardiovascular events: meta-analysis.Br Med J.2010;341:c3691.
56. Li K, Kaaks R, Linseisen J, et al. Associations of dietary calcium intake and calcium supplementation with myocardial infarction and stroke risk and overall cardiovascular mortality in the Heidelberg cohort of the European Prospective Investigation into Cancer and Nutrition study (EPIC-Heidelberg).Heart.2012;98:920–925.
57. Galli L, Rubinacci A, Cocorullo D, et al. Optimal dietary calcium intake in HIV treated patients: no femoral osteoporosis but higher cardio-vascular risk.Clin Nutr.2014;33:363–366.
58. Mendoza N, De Teresa C, Cano A, et al. Benefits of physical exercise in postmenopausal women. Maturitas. 2016;93:83–88. doi:10.1016/j. maturitas.2016.04.017.
59. Xu J, Lombardi G, Jiao W, et al. Effects of exercise on bone status in female subjects, from young girls to postmenopausal women: an overview of systematic reviews and meta-analyses.
Sports Med. 2016;46(8):1165–1182. doi:10.1007/s40279-016-0494-0.
60. Santos WR, Santos WR, Paes PP, et al. Impact of strength training on bone mineral density in patients infected with HIV exhibiting lipody-strophy. J Strenght Cond Res.2015;29(12):3466–3471.doi:10.1519/ JSC.0000000000001001.
61. Bonato M, Bossolasco S, Galli L, et al. Moderate aerobic exercise (brisk walking) increases bone density in cART-treated persons. JIAS. 2012;15(4):18318.doi:10.7448/IAS.15.6.18318.
62. Perazzo JD, Webel AR, Alam SMK, et al. Relationships between phys-ical activity and bone density in people living with HIV: results from the SATURN-HIV Study.JANAC.2018;29(4):528–537.