International Journal of Finance and Managerial Accounting, Vol.4, No.13, Spring 2019
25
With Cooperation of Islamic Azad University – UAE BranchA Validation Test Naive Bayesian Classification Algorithm
and Probit Regression as Prediction Models for Managerial
Overconfidence in Iran's Capital Market
Shokoufeh Etebar
PhD student of accounting, Department of Economics and Accounting, Islamic Azad University, South Tehran Branch, Tehran, Iran.
Roya Darabi
Faculty Member, Department of Economics and Accounting, Islamic Azad University, South Tehran Branch, Tehran, Iran. (Corresponding Author)
Mohsen Hamidian
Faculty Member, Department of Economics and Accounting, Islamic Azad University, South Tehran Branch, Tehran, Iran. [email protected]
Seiyedeh Mahbobeh Jafari
Faculty Member, Department of Economics and Accounting, Islamic Azad University, South Tehran Branch, Tehran, Iran, email: [email protected]
ABSTRACT
Corporate directors are influenced by overconfidence, which is one of the personality traits of individuals; it may take irrational decisions that will have a significant impact on the company's performance in the long run. The purpose of this paper is to validate and compare the Naive Bayesian Classification algorithm and probit regression in the prediction of Management's overconfident at present and in the future. Financial during the years are 2012 to 2017. To support the theoretical results, the samples were the companies admitted to the Tehran Stock Exchange, (financial data of 1292 companies/year in total). Data collection in the theoretical part of the study benefitted from the library method, and for calculating data, Excel software was used, and in order to test the research hypotheses Matlab 2017 and Eviews10.0 were used. The empirical findings demonstrate that, Gained nonlinear prediction model of the Naive Bayes Classification algorithm, has high ability to predict, and the Probit regression model, has limited ability to predict the over-confidence of management. Finally, the artificial intelligence prediction model (naive Bayesian classification algorithm) has better result compared with statistical binary regression prediction model (probit regression).
Keywords:
1. Introduction
Recent advances in information and communication technology, and electronic databases have made remarkable changes in the economic relations of companies. Managers and their behavioral characteristics will have a significant influence on the continuity of companies in the competitive economic environment today. The significance of the issue is evident because the manager's false self-confidence can affect company financing decisions which, based on research, has been shown to have a greater impact in long-term management on the corporate financial risk reports. Furthermore, compared with other managerial characteristics, managers’ over-confidence is more susceptible to the influence of the external environment. More importantly, it is a well-documented measurable managerial characteristic and has significant explanatory power for corporate financial policies (Malmendier, Tate, Yan, 2011) and since corporate executives pay more attention to long-term effects of transactions, they probably choose the type of transaction that will have a better effect on the future performance of the company. Also, researches tried to provide a model for reviewing the decision-making process with high optimism, regardless of the cost of representation and information asymmetry. The importance of the present research comes from the fact that various stakeholder groups and other users of the company's financial information, insist on the existence of rules for protecting against Conflict of Interests between Managers and Owners, the importance of reporting information asymmetry And managerial overconfidence that will lead to manipulation of accounting figures and ultimately the detriment of the company's stakeholders in the future (Bamber and McMeeking, 2016).
Also, considering that so far no research inside Iran has provided a model for predicting management's overconfidence and has not simultaneously compared the validation and predictive power of models based on artificial intelligence naive Bayes algorithm and Probit Regression. Therefore, this research attempts to render the prediction models regarding recent literature and applied research abroad and theoretical literature of Iran about managerial overconfidence, in companies admitted to the capital market of Iran. We hope to predict managerial overconfidence by used from financial data and Financial Ratio in artificial intelligence algorithm and statistical methods. Our
research variables Had conditions for calculation in the Excel software, so the period of 2012–2017 was selected for our paper because the Financial database of the companies in the Tehran Stock Exchange before 2012 are not fully available. In our study, obtained 1292 firm-year observations. This study contributes to the literature in the following goals, The First objective is that the management's overconfident variance by of naive Bayesian classification algorithm is used for modeling and Validating, and the second goal is predicting the management's overconfident using the probit regression model and the validation of the obtained model. Ultimately, the third objective of the research Based on the power (ability) of predicting the overconfidence of management is to compare them with each other using these two methods .The remainder of this paper is organized as follows. In Section 2 presents the relevant literature and develops our research hypotheses. In Section 3 we describe the sample, data and our choice of variables by LVF filter algorithm, research design. Section 4 discusses the empirical results, while Section 4 conducts robustness and performance models tests, In part 5 we provide additional analysis models tests. Section 6 draws conclusions based on the findings.
2. Literature Review
In a similar vein, the ongoing debate about differences in investment to cash flow and investment to Q sensitivities (Fazzari, Hubbard, and Petersen 1988; Kaplan and Zingales, 1997) all indicate the impact of management on long-term corporate performance. Companies with over-confident CFOs use lower discount rates to value cash flows, and that they invest more, use more debt, are less likely to pay dividends, are more likely to repurchase shares, and they use proportionally more long-term, as opposed to short-term, debt (Ben-David, Graham and Harvey, 2007).
. In a research by Baharati, Delman and Fu (2016), under the title "Managerial overconfidence and Stock Returns" the results showed that there is a meaningful relationship between the CEO's overconfidence and the company's policies. Chen et al. (2014) concluded in their research that excessive self-confidence would lead to an increase in research and development spending, followed by an increase in R & D spending's, which would improve long-term corporate performance. Ben-David, Graham and Harvey (2007) have shown that managerial overconfidence is a decisive factor for some corporate financial activities. Hartog and Zanten (2018) took used a new binary classification by providing a Bayesian nonparametric approach. They were able to use the algorithm-based neural network system for their research, this, meanwhile, earlier studies took use of the plan and the causal map Bayesian. Managers often express their behavioral characteristics when making long-term decisions, and manage the investment of financial resources and respond to changes in the business environment. Our view in this research is that by using accounting variables and financial ratios, we can predict managerial overconfidence that affects long-term and continued firm performance. Therefore, the main question of our research: is whether, by accounting variables and financial ratios, in the methods of statistical and artificial intelligence are able to predict managerial overconfidence?
The Bayesian network (BN) is a probabilistic approach for reasoning under uncertainty and has become a popular knowledge representation scheme in several fields such as data mining and knowledge discovery (Jensen, 1996; Wang, Dash and Druzdzel, 2002). Naive Bayes classification algorithm based on Bayes' theorem is presented for predictive modeling.
The Bayesian theorem uses a method for categorizing phenomena based on the probability of occurrence.
The probit model is a famous model for fitting the dual response variables, which have only two outcomes that can be found in our research variable, managerial overconfidence. Antunes et al. (2018) in their paper," Forecasting banking crises with dynamic panel probit models", forecast performances of several (dynamic) probit models with the objective of developing common vulnerability indicators with early warning properties. The paper of Han and Vytlacil (2017) provides identification results for a class of models specified by a triangular system of two equations with binary endogenous variables. A new estimation method for spatial binary probit models is presented by (Martinetti and Geniaux, 2017) both spatial autoregressive (SAR) and spatial error (SEM) models are considered .
Nanzad, Anderson and Conder (2017) compares the modeling of historical resource production and forecasting of future production trends using the logit/probit transform advocated by Rutledge et al. (2011) with conventional Hubbert curve fitting, using global coal production as a case study.
We decided to test the Bayesian and probit methods for the prediction of management overconfident; therefore at the level of detection rate (Predictive Power) 50% hypotheses 1 and 2 were mentioned and tested as follows:
H1: Naive Bayesian Classification Algorithm model has the ability to predict overconfidence of managers in the companies admitted to Tehran Stock Exchange for the current and the following year.
H2: Probit binary regression model has the ability to predict overconfidence of managers in the companies admitted to Tehran Stock Exchange for the current and the following year.
In applied research Kang et al, (2017), the results from simulation and empirical analyses support the model’s predictions. Thus, while managers’ cognitive biases, when considered separately, negatively impact firm performance, they can be beneficial when considered jointly. Other research such as (Abhinav et al., 2017; Marucci-Wellman, Corns, and Lehto, 2017; Malmendier, Tate, Yan, 2011) that compared predictive models with each other created hypothesis 3 in our minds.
H3: There is a significant difference (At the level of Predictive Power or detection rate 50% ) between the overconfidence of management based on algorithm and regression prediction models for managers of companies admitted to Tehran Stock Exchange for the current and the following year.
3. Methodology
3.1. Data and Samples selection
The statistical population of this research includes all companies accepted in Tehran Stock Exchange from 2012 to 2017. In the present study, we choose 2012 as the starting year of our sample, which has the following conditions: Their data are available and they are not the investment, bank and leasing companies. Their stocks are traded on the market during the research period, they did not change the activity or change the financial period Change in reporting financial period (The financial period ended March 29 per year) and for comparability of the information, their fiscal year ends were March 29th, which are 1292 (company/year) in total. It Statistical sample includes consists of 34 different industries for 386 companies. We obtain these data from the "SEC Tehran" database.
3.2. Research design
3.2.1. Model and method of selecting research variables
In the present research overconfidence of management dependent variable is the difference between objective management precision and subjective certainty in management decisions (Fonseca Costa et al., 2017). The most relevant operational definition of the dependent variable was provided by (Hribar and Yang, 2016; Panayiotis et al., 2017; Malmendier, Tate, Yan, 2011; Scherand and Zechman, 2012) who stated that the first criterion is the remainder regression equation for capital expenditure. We measure managerial overconfidence based on the remaining amount of capital expenditure regression and the second criterion: Earnings per share prediction error. In the regression equation below, if the remainder of the regression is greater than zero, this index is equal to one (there is more management confidence) and otherwise equal to zero (no more reliable management). The index must be used based on the assets in companies with a higher rate than sales growth. The executives of these companies invest more in the company than the directors of other companies and so the regression equation index will be equal to one and shows more confidence in management. We measure managerial overconfidence based on the remaining amount of capital expenditure regression. The following is the regression equation:
(1)
: Growth of this year's assets in comparison
with the previous year in each company
: Sales growth this year compared to the
previous year in each company
: Model error, which indicates overconfidence of
management.
in both of these criteria, and that is at the level of managerial overconfidence.
The method of testing the hypotheses based on the research model was firstly the variable-selection method which was implemented by the Las Vegas filter (LVF) algorithm, a filter approach for selecting independent variables. As a second step, the optional independent variables selected were evaluated for the next step using the Naive Bayesian algorithm which was used to validate this algorithm in the prediction of managers' uncertainty or overconfidence for this year and the following year (2012 to 2017) in the Matlab software. The third step was to construct a model to predict the management's overconfidence or
management's false trust based on the Naive classification Bayesian algorithm. Then, in the fourth stage, the independent variables were selected using the probit binary regression (due to the binary nature of the dependent variable, the use of normal regression is not suitable for proper modeling) in order to investigate the ability of probit regression in predicting the overconfidence of management for this year and the year after, which was tested in Eviews software. Findings obtained from the two methods were compared with each other. The process of modeling the management overconfident prediction is presented in Fig 1
Fig1. Conceptual model form
3.2.2. Research Las Vegas(LVF) Selection variable algorithm
The Las Vegas algorithm is a filter approach for the selection of independent variables. This method searches the search space randomly using the Las Vegas algorithm. It makes a number of possible choices with the help of the benchmark of compatibility which is a faster reach to the optimal answer. This algorithm is used due to its random search, searches for a smaller range of total space conditions. The size of this range depends on the maximum number of replications of the algorithm. The optimal answer depends on the size of available resources and the execution time of the algorithm. In each iteration, the function of the producer selects a number of possible subsets of the search space randomly and submits them to the evaluation function. The random producer function has parameters that must be set, Proper adjustment of these parameters is
effective at the speed of finding the answers and finding the best answers. Compatibility benchmark relies heavily on educational data and tends to choose a subset of features. This criterion leads to a selection of smaller feature sets .This criterion finds subtypes of the smallest size based on the loss of a reasonable amount of compatibility that is determined by the user. The LVF algorithm calculates the incompatibility for each subset of the candidate. The idea is that the class is more likely to be among the examples of this subset of the independent variables, and many variables belong to that class.
long time, because the algorithm of each subset, which is better than the best answer above (both in terms of subset size and in terms of compatibility rate), returns as an answer. This algorithm is efficient, because it only tests for incompatibility, with the number of features within it less than or equal to the best subset that has been found so far. The LVF algorithm is as follows: a random subset, S, From N independent variable, is produced per repeat. If the number of independent variables (C) of the set S is less than the best one found up to now, hence for D data
with independent variables are suggested and the incompatibility criterion is examined. If the levels of Incompatibility are less than the threshold
,and are replaced respectively with C and D and
this collection is printed. If and
incompatibility criterion is provided, then a good collection is found and this collection is printed. This algorithm repeats rank. The key to the success of the LVF is its incompatibility criterion. This criterion specifies how much data can be reduced to be accepted. As explained above,
Definition of the LVF Algorithm In summary as follows:
Input D is Data and N is the Number of independent variables.
is Permissible incompatibility rate. The M set of independent variables satisfying the condition of incompatibility is output. The algorithm runs in accordance with this command for until thedo it repeatedly. Since
and if
then gets
and then
Otherwise, if
then
then will be ended Repeat
the algorithm command.
3.2.2.1. Selection of independent variables by LVF algorithm
The independent accounting variables used in this research to predict the management's uncertainty include Margin of gross profit, operating profit margin, return on assets, earnings per share, current ratio, Quick ratio working capital ratio, financial leverage, turnover ratio of inventories, asset turnover ratio, Fixed asset turnover ratio, turnover of accounts
receivable, Q Tobin, return on sales, Return on stocks, cash to total assets ratio, operating cash flow to assets ratio, current assets to total assets ratio, firm size, stock price, non-profitability Information symmetry, dividend profit ratio, P / E ratio.
We chose independent accounting variables, through the review and study of articles in Iran and international papers through a content analysis method. Based on the theoretical foundations inside Iran and internationally, 22 accounting variables, which are used in computing methods managerial overconfidence, would be reviewed simultaneously and for the first time in Iran. The choice of independent variables by the algorithmic method of LVF (Las Vegas) in the subject of prediction managerial overconfidence is first performed in Iran.
Company-year data for two criteria managerial overconfidence variables this year and the following year in during research (2012 to 2017) was given to the LVF algorithm and γ = 0.5 was used. In this algorithm 5 independent variables for the current year (p / e, stock returns, earnings per share, dividend ratio, asset turnover ratio) and 11 independent variables (p / e, return on assets, return on sales, operating profit margin, Margin of gross profit, Earnings per share, stock prices, turnover of accounts receivable, dividend payment ratio, asset turnover ratio, fixed asset turnover ratio) were selected for the following year. The number of independent variables for the current year was less than the number of variables for the coming year, and before the Naive Bayes classifier algorithm was implemented, It could be concluded that the forecast for the coming year was more difficult than the forecast for the current year since the number of independent variables related to the current year was less than the number of variables for the coming year. Definition of independent variables will be presented in the annexed table. The Definition of independent variables is included in the appendix1.
3.2.3. Research Naive Bayesian Classification algorithm model
to noise, Resistance to missing values, So this algorithm has led to widely To be used. A simple naïve Bayes classifier of machine learning is referred to as a group of simple classifier's categories based on probabilities that With simple independent random variables Assumed between different modes and based on the Bayes' theorem is applicable. In this method it is assumed that the classes are independent of each other and the possibility of tagging data x is defined by with that {
}. The possibility that data
labeled x with s, If the class data to be given as an input, if the class is independent, it is indicated by the following relationship.
)1)
| | ∏ |
In this case, the subsequent Possibility for tagging to x is calculated by relation 2 (Bayes rule):
(2) | |
∏ |
P (s) does not depend on w and it can be ignored. As a result, the value of dependency x is obtained from the following equation:
(3)
∏ |
Naive Bayes with Receiving Basic Exercise (training test dates) will provide good results (Evaluation or test dates). There are always a number of companies to learn and a number of companies to test and evaluate and Naïve Bayesian classification algorithm by repeating its prediction steps to the ten cross-validation method, Tries to be close to the optimal ranking. Prediction by algorithm this year through the same year data that the algorithm is not trained, Characterized (Validation of Naive Bayesian Classification algorithm). The forecast is performed in the next year using data from the previous year (for example for predicting more confidence of managers in the Iranians capital market in 2011 we use financial dates from 2012).
3.2.4. Research probit regression model
The probit regression prediction model was used for predicting management overconfidence with 11 independent selected variables by LVF algorithm. We will run the following model in the Eviews software according to Conceptual model form as explained in Section 3.2.1.
(1)
4. Results
4.1. Descriptive Statistics
Table 1 presents the descriptive statistics for our variables. Since the dataset is an pooling data, Descriptive indexes of the variables selected by the filter algorithm (11 independent variables) including mean, the range of variation, standard deviation, and skewness and kurtosis, which are used in this study to predict the overconfidence of management, are presented in Table 1.
4.2.
Naive
Bayesian
Classification
algorithm prediction models
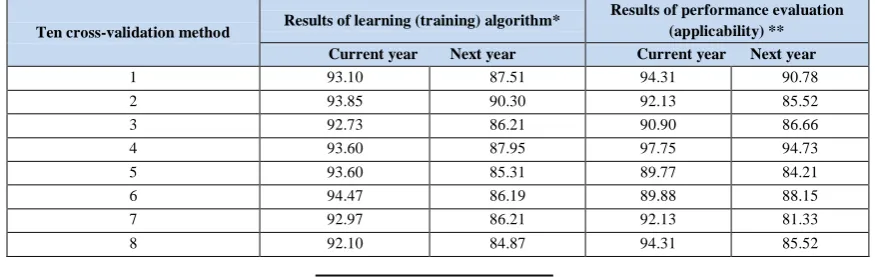
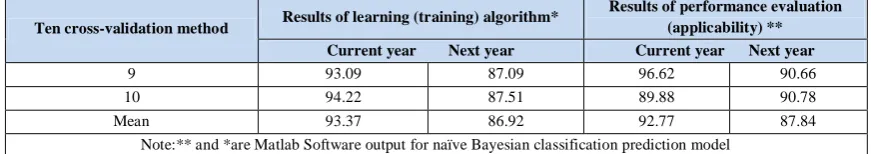
given to the algorithm, were given to the model again, with the difference that this time Bayesian model predict the value of the dependent variable, then, the average of 10 detection rates was calculated using 10 Cross-Validation methods and reported in table 2. The Average recognition rate of the Bayesian algorithm model is aimed at evaluating the percentage of learning models to predict the overconfidence of the management. The closeness of learning errors to zero, or the amount of learning to 100% is an indication of better learning of the model.
4.3. Scrutiny of non-occurrence: The over
fitting phenomenon
The companies-evaluation year's data (2012 to 2017) of the prediction model, that is not seen by algorithm yet, are given to the Naive Bayesian algorithm model. The Bayesian algorithm predicts the overconfidence of management for all of these
companies-years (evaluation data). Comparing estimated values with real, be determined the value of the applicability of prediction model. This process is carried out by 10 cross-validation methods so that all companies are tested at least once as evaluation data and that the results of the prediction model become more reliable.
Naive Bayesian algorithm model for unseen company-evaluation year's data (2012 to 2017) has predictive accuracy close to company- training year's data (2012 to 2017) for the predictive model. So the overfitting phenomenon has not happened for the prediction of the Naive Bayesian model. According to the average of the total results at 50% detection rate, the finding in Table 2 provide support for hypothesis 1, because the Average rate of detection and the Average of efficiency (applicability) prediction model, provides stronger results (more detection rates than 50%) for the current and following year.
Table 1. Descriptive statistics
Variable name/financial ratio Mean median Minimum Maximum Standard
deviation Skewness Kurtosis
Margin of gross profit ratio 0.201 0.171 -0.981 0.987 0.239 -0.104 2.807 Operating profit margin ratio 0.170 0.141 -0.874 0.749 0.165 0/187 3.008 return on assets ratio 0.089 0.075 -0.78 0.174 0/143 0.221 3.236 Earnings per share ratio 620.714 291.205 13448.111 -8347.147 1429.727 2.358 15.487
asset turnover ratio 0.875 0.738 0.003 6.305 0.667 2.683 12.886 fixed asset turnover ratio 6.442 3.718 0.010 87.486 9.164 4.227 24.035 turnover of accounts receivable
ratio 6.176 2.964 0.002 89.872 10.654 4.414 23.098 return on sales ratio 0.118 0.110 -7.298 7.141 0.577 -1.335 55.086 stock prices ratio 6414.853 3304.500 149 824163 19490.723 35.593 1483.805 dividend payment ratio 0.223 0.120 0.000 0.996 0.244 1.281 0.756
p/e ratio 7.558 5.714 99.077 17.837 16.403 1.052 9.659
Source: researcher's calculation
Table 2. Results of the prediction model of the Naive Bayesian Algorithm
Results of performance evaluation (applicability) ** Results of learning (training) algorithm*
Ten cross-validation method
Current year Next year Current year Next year
90.78 94.31
87.51 93.10
1
85.52 92.13
90.30 93.85
2
86.66 90.90
86.21 92.73
3
94.73 97.75
87.95 93.60
4
84.21 89.77
85.31 93.60
5
88.15 89.88
86.19 94.47
6
81.33 92.13
86.21 92.97
7
85.52 94.31
84.87 92.10
Results of performance evaluation (applicability) ** Results of learning (training) algorithm*
Ten cross-validation method
Current year Next year Current year Next year
90.66 96.62
87.09 93.09
9
90.78 89.88
87.51 94.22
10
87.84 92.77
86.92 93.37
Mean
Note:** and *are Matlab Software output for naïve Bayesian classification prediction model
Source: researcher's calculation
4.4. Additional analysis
4.4.1. Summary statisticsChow test or F-test Leamer was done for our financial data, before implementation of probit regression modeling in Eviews software. The results of the F test for the regression model of the present study are shown in Table 3. The calculated probability value for the model is greater than 0.05, the result is that the data is pooling in the other words, because of the data is not a panel.it is not necessary that we run the Hausman test.
Table 4 shows the WIFE test (Intensity co-linearity between independent variables) was used to examine the existence of a coincidence between the independent variables that results in, despite the high coefficient of determination, the questioning of the validity of the model. In order to investigate the co-linear severity of the independent variables of the research, the inflation factor variance and tolerance have been used. The tolerance is about 0.01 and if the variable is less than this value, it does not have validity inside the model and detection threshold amount of variance inflation factor (VIF) is greater than 5, and according to the results of variance inflation factor independent variables provided in table (4), lack of co-linearity between the independent variables is proved.
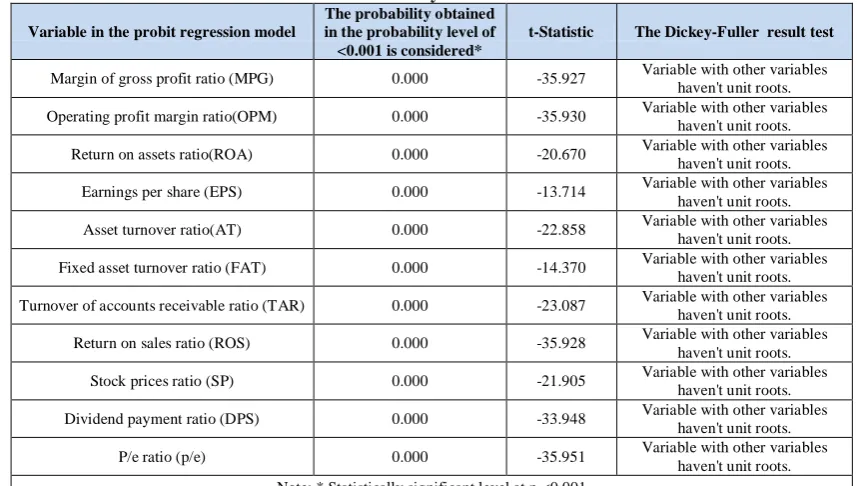
Table 5 presents the results of the Dickey-Fuller Test. The validity of regression estimation is examined in different ways. Usually, non-durable variables or,
on the other hand, having a random time series for variables leads to a false estimation of the regression. Before estimating the model, it is necessary that the durability of all variables used in estimation be tested. in this study, before the probit regression was used to investigate the unit root test of Dickey-Fuller, The results indicate that independent variables in the research are at the significant level (p <0.001) So, in short, we can say that based on Dickey Fuller's method, the null hypothesis of the test concerning the existence of a single root was rejected and, accordingly, the variables used in this research are at the durability-level.
Table 6 shows the result of the inequality test of variance, the nature of our data is required also in many studies based on this kind of data the problem of heterogeneity of variance is discussed. The existence of heterogeneous variance in the model Leads to the ineffectiveness of the estimates regardless of compatibility. The research, in order to test the heterogeneity of variance the generalized White Test is used. The results of this test used in this research (F statistics with the distribution of Fisher) are shown in table 6. By statistical analysis and the probability value obtained for the model which is more than the significance level of 0.05 considered with us, according to the research hypotheses considered for this model test, the probit regression model has variance consistency.
Table 3. F-test Leamer result
F-test Leamer test for probit regression model F statistics Probability* Test result
1.139 0.091 Pooling data
Note: * Statistically significant greater than 5 percent
Table 4. VIF test result
Variable in the probit regression model Tolerance* Variance inflation factor (VIF)**
Margin of gross profit ratio (MGP) 0.224 4.473 Operating profit margin ratio (OPM) 0.788 1.268
Return on assets ratio (ROA) 0.511 1.958
Earnings per share ratio (EPS) 0.402 2.485
Asset turnover ratio (AT) 0.837 1.195
Fixed asset turnover ratio (FAT) 0.890 1.124 Turnover of accounts receivable ratio (TAR) 0.941 1.062
Return on sales ratio (ROS) 0.237 4.211
Stock prices ratio (SP) 0.560 1.786
Dividend payment ratio (DPS) 0.292 3.430
P/e ratio (p/e) 0.295 3.388
Note: * Statistically significant at 1 percent and ** Statistically significant greater than 5 percent Source: researcher's calculation
Table 5. The Dickey-Fuller Test result
Variable in the probit regression model
The probability obtained in the probability level of <0.001 is considered*
t-Statistic The Dickey-Fuller result test
Margin of gross profit ratio (MPG) 0.000 -35.927 Variable with other variables haven't unit roots. Operating profit margin ratio(OPM) 0.000 -35.930 Variable with other variables
haven't unit roots. Return on assets ratio(ROA) 0.000 -20.670 Variable with other variables
haven't unit roots. Earnings per share (EPS) 0.000 -13.714 Variable with other variables
haven't unit roots. Asset turnover ratio(AT) 0.000 -22.858 Variable with other variables
haven't unit roots. Fixed asset turnover ratio (FAT) 0.000 -14.370 Variable with other variables
haven't unit roots. Turnover of accounts receivable ratio (TAR) 0.000 -23.087 Variable with other variables
haven't unit roots. Return on sales ratio (ROS) 0.000 -35.928 Variable with other variables
haven't unit roots. Stock prices ratio (SP) 0.000 -21.905 Variable with other variables
haven't unit roots. Dividend payment ratio (DPS) 0.000 -33.948 Variable with other variables
haven't unit roots. P/e ratio (p/e) 0.000 -35.951 Variable with other variables
haven't unit roots. Note: * Statistically significant level at p <0.001
Source: researcher's calculation
Table 6. The inequality test of variance result the inequality test of variance (heterogeneity of variance) for probit
regression model
White
statistics Probability* Test result
1.788 0.363
Homogeneity of variance
4.5. Assessment of probit regression
prediction model
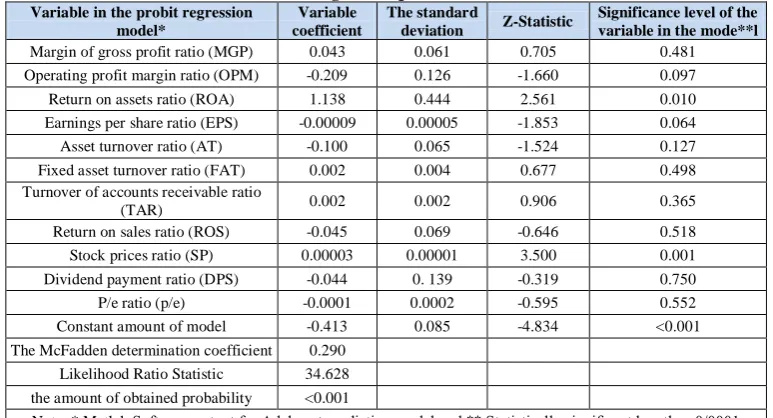
In Table 7 we report the Binary probit regression results on total independent variables for predicting managerial overconfidence. The resulting regression model is as follows:
The significance of the regression equation was calculated using the likelihood ratio statistics. As shown in Table 7, the value of the probability statistics is (the level of significance) is less than 0/0001 which indicates a general significance of the fitted regression
model at confidence level 99%. This finding supports the prediction in our first hypothesis that the probit binary regression model has the ability to predict the overconfidence of managers in the Companies admitted to Tehran Stock Exchange for Current and the following year. Regarding the implementation of step by step statistical method in Probit regression model test, were deleted a number of 22 independent variables, Which in the prediction regression model had less explanatory or predictive power to predict and the Probit regression model with four variables will Create the maximum coefficient of determination McFadden for the prediction probit regression model. The McFadden determination coefficient is 29% that can be said that independent variables of the prediction model only explain 29% of the variations of the dependent variable of management overconfidence.
Table 7. Probit regression prediction model result Variable in the probit regression
model*
Variable coefficient
The standard
deviation Z-Statistic
Significance level of the variable in the mode**l
Margin of gross profit ratio (MGP) 0.043 0.061 0.705 0.481 Operating profit margin ratio (OPM) -0.209 0.126 -1.660 0.097 Return on assets ratio (ROA) 1.138 0.444 2.561 0.010 Earnings per share ratio (EPS) -0.00009 0.00005 -1.853 0.064 Asset turnover ratio (AT) -0.100 0.065 -1.524 0.127 Fixed asset turnover ratio (FAT) 0.002 0.004 0.677 0.498 Turnover of accounts receivable ratio
(TAR) 0.002 0.002 0.906 0.365
Return on sales ratio (ROS) -0.045 0.069 -0.646 0.518 Stock prices ratio (SP) 0.00003 0.00001 3.500 0.001 Dividend payment ratio (DPS) -0.044 0. 139 -0.319 0.750 P/e ratio (p/e) -0.0001 0.0002 -0.595 0.552 Constant amount of model -0.413 0.085 -4.834 <0.001 The McFadden determination coefficient 0.290
Likelihood Ratio Statistic 34.628 the amount of obtained probability <0.001
Note: * Matlab Software output for Adaboost prediction model and ** Statistically significant less than 0/0001 Source: researcher's calculation
5. Discussion and Conclusions
From the 11 independent variables of the probit regression prediction model only 4 variables: (earnings per share, asset return, operating profit, and stock price) have the ability to predict management overconfidence in the probit regression model. Applicability of the probit regression prediction model is 36.3% based on the results (Based on the arithmetic
the Naive Bayesian Classification algorithm for this year is 89.8% and for the following year is 90.78%. It can be argued that the probit regression prediction model has less predictive ability than the Bayesian prediction model in predicting managerial overconfidence . Accordingly, hypothesis 3 of the research is proved. Considering the objectives of this research, we have validated the naive Bayesian classification algorithm as well as the probit regression to predict managerial overconfidence in accepted companies in Tehran Stock Exchange. Comparison of prediction models with regard to the average rate of recognition ( rate of learning by naive Bayesian model) and Average performance or Efficiency detection rate of algorithmic model With the obtained average of McFadden determination coefficient( that is the predictive power of the Probit regression model), It is possible.
Thus, we compared the apparent and hidden (nonlinear) predictability models for the current and future managerial overconfidence of the research period from 2012 to 2017. The Bayesian predictive algorithm model is capable of predicting management overconfident, but naive Bayesian algorithm prediction model, compared with the probit regression prediction model, has better results in predicting the overconfidence of management of this year and the following year in Tehran SEC. The probit regression prediction model, the results of which can be seen in the output of Matlab software as a regression model, have the least ability to predict the reliability of this year and the future years in Tehran SEC. Finally, we can claim that there is a significant difference between the predictive powers of the two models presented in the research for predicting managerial overconfidence. Based on the results from accepted companies in Tehran SEC, the following suggestions for future research can be offered: investors and Financial market analysts and stockbrokers must have understood the required training and expertise in full recognition of various types of overconfidence and its consequences since the long-term impacts of overconfidence of managers will have adverse consequences for firms in the capital market, While in Iran these outcomes will be evaluated at a later time and with delay. We can propose used from the other artificial intelligence algorithms and artificial neural networks and Fuzzy Logic and other alternative variable selection methods, and other Statistical and
economic variables for future research such as macroeconomic, GDP and etc. Also using variables that were not used in the regression modeling of this research can provide newer prediction models for predicting overconfidence of management in a world because managers play a vital role in advancing the goals of public and private organizations.
References
1) Abhinav, R, N., Pindoriya, M., Wu, J., and Long, C. (2017). Short-term wind power forecasting using wavelet-based neural network. Energy Procedia, 142, 455-60.
2) Antunes, A, Bonfim, D., Monteiro, N and Rodrigues, P. M, M. (2018). Forecasting banking crises with dynamic panel probit models. International Journal of Forecasting, 34 (2), 249-75.
3) BAO, H. and Haotong li, S. (2016). Overconfidence and real estate research: a survey of the literature. The Singapore Economic Review, 61(2). Doi: 10.1142/S0217590816500156
4) Bamber, M. and McMeeking, K. (2016). An examination of international accounting standard-setting due process and the implications for legitimacy. The British Accounting Review, 48 (1), 59-73.
5) Ben-David, I, Graham, J.R. and Campbell, R .H. (2007). Managerial overconfidence and corporate policies. International Bureau of Economic Research. Working Paper, Available at: http://papers.ssrn.com/sol3/papers.cfm?abstract_id =1640552
6) Bharati, R, Doellman, T. and Xudong, F. (2016). CEO confidence and stock returns. Journal of Contemporary Accounting & Economics, 12 (1), 89-110.
7) Bradley, M., Jarrell, G.A. and Kim, E.H (1984). On the existence of an optimal capital structure: Theory and evidence. The journal of Finance, 39 (3), 857-78.
8) Chen, Sh., Lai, Sh., Liu, Ch., and McVay, S. (2014). Overconfident managers and internal controls. Working paper, National Taiwan University and University of Washington.
Available at SSRN:
9) Fonseca Costa, D, Carvalho, F., Melo, B., Moreira, B.S and Prado, J. (2017). Bibliometric analysis on the association between behavioral finance and decision making with cognitive biases such as overconfidence, anchoring effect and confirmation bias. Scientometrics, 111 (3), 1775-99.
10)Fazzari, S., Hubbard, R, G. and Petersen, B, C. (1987). Financing constraints and corporate investment. International Bureau of Economic Research Cambridge, vol.1. Mass., USA.
11)Han, S and Vytlacil, E, J. (2017). Identification in a generalization of bivariate probit models with dummy endogenous repressors. Journal of Econometrics, 199 (1), 63-73.
12)Hartog, J. and Zanten, H. (2018). Nonparametric Bayesian label prediction on a graph. Computational Statistics & Data Analysis, 120, 111-31.
13)Hribar, P. and Yang, H. (2016). CEO Overconfidence and Management Forecasting. Contemporary Accounting Research, 33(1), 204-27.
14)Jensen, F. (1996). An introduction to Bayesian networks. Vol. 210: UCL press London.
15)Kang, J., Kang, J., Kang, M. And Kim, J. (2018). Curbing Managerial Myopia: The Role of Managerial Overconfidence in Owner-Managed Firms and Professionally Managed Firms.
Available at SSRN:
https://ssrn.com/abstract=2944998 or http://dx.doi.org/10.2139/ssrn.2944998.
16)Kaplan, S. and Zingales, L. (1997). Do investment-cash flow sensitivities provide useful measures of financing constraints? The quarterly journal of economics, 112 (1), 169-215.
17)Magnus, J. R., and Wang, W. (2014). Concept-Based Bayesian Model Averaging and Growth Empirics. Oxford Bulletin of Economics and Statistics, 76(6), 874-897.
18)Malmendier, U., Tate, G. and Yan, J. (2011). Overconfidence and early life experiences: the effect of managerial traits on corporate financial policies. The journal of Finance, 66 (5), 1687-733. 19)Martinetti, D. and Geniaux, G. (2017).
Approximate likelihood estimation of spatial probit models. Regional Science and Urban Economics, 64, 30-45.
20)Marucci-Wellman, H.R, Corns, H.L. and Lehto, M.R. (2017). Classifying injury narratives of large
administrative databases for surveillance-a practical approach combining machine learning ensembles and human review. Accident Analysis & Prevention, 98, 359-71.
21)Nanzad, B, Anderson, K.B. and Conder, J.A. (2017). Evaluation of the logit/probit transform method to modeling historical resource production and forecasting compared to conventional Hubbert modeling. International Journal of Coal Geology, 182, 42-51.
22)Panayiotis, A., Doukas, J.A., Koursaros, D. and Louca, C. (2017). CEO Overconfidence and the Valuation Effects of Corporate Diversification & Refocusing Decisions. Social Science Network of America, Available at: https://ssrn.com/abstract=2898469
23)Rutledge, T., L. Groesz, M., Linke, S.E, Woods, G. and Herbst, K. L. (2011). Behavioral weight management for the primary care provider. Obesity Reviews, 12 (5), e290-e7. Doi:10.1111/j.1467789X.2010.00818.x.
24)Salama, K, M. and Freitas, A. (2012). ABC-miner: an ant-based Bayesian classification algorithm. Paper presented at the International Conference on Swarm Intelligence.
25)Schrand, C.M, and Zechman, S.LC. (2012). Executive overconfidence and the slippery slope to financial misreporting. Journal of Accounting and Economics, 53 (1-2), 311-29.
26)Smith, J.r., Clifford, W. and Watts, R. (1992). The investment opportunity set and corporate financing, dividend, and compensation policies. Journal of financial Economics, 32 (3), 263-92. 27)Soleimani Rasa, M., Taherabadi, A., Karimi
Pouya, M. (1395). Accounting ratios in the analysis of financial statements: Financial ratios of companies accepted in Tehran Stock Exchange, first edition, Tehran: secret covert.
28)Titman, S. and Wessel, R. (1988). The Determinants of Capital Structure Choice. The Journal of Finance, Vol 43(1), March.
Appendix1. Variable definitions
Variable definition
Margin of gross profit ratio (MGP) The gross profit of each company is divided by the net sales of the same company
Operating profit margin ratio (OPM) The Operating profit of each company is divided by the net sales of the same company
Return on assets ratio (ROA) The net profit of each company is divided by the total assets of the same company
Earnings per share ratio (EPS) Operating profit after deduction of taxes and dividends of each company Divided by the total number of shares of the same company Asset turnover ratio (AT) The sales of each company is divided by the total assets of the same company
Fixed asset turnover ratio (FAT) The sales of each company is divided by the total fixed assets of the same company
Turnover of accounts receivable ratio (TAR) The sales of each company is divided by the accounts receivable of the same company
Return on sales ratio (ROS) The net profit of each company is divided by the net sales of the same company
Stock prices ratio (SP) Stock price at the end of the each year
Dividend payment ratio (DPS) Dividends per share of the company divided by the net earnings of the same company
P/e ratio (p/e) The price of share each company divided by the earning per share of the same company