Copyright © 2015 by Iranian Occupational Health Association (IOHA) IJOH 8: 45-53, 2016
ORIGINAL ARTICLE
HSE Key Performance Indicators in HSE-MS Establishment and
Sustainability: A Case of South Pars Gas Complex, Iran
HAMID SARKHEIL
*; SHAHROKH RAHBARI
Department of Environmental Engineering, College of Environment, Karaj, Iran.
Received October 10, 2015; Revised December 12, 2015; Accepted March 15, 2016
This paper is available on-line at http://ijoh.tums.ac.ir
ABSTRACT
Establishment of HSE management system (HSE-MS) in industries is served as important managerial factor which achieves the requirements of health, safety, environment and sustainable development. Today, HSE_MS is known as a vital system in occupational fields due to corresponding considerations for economy, sustainable development, society and ecology. The important role of HSE management system is completely undeniable in related standards for eliminations or reductions of hazards, anomalies, risks, accidents and adverse consequences. In this study, HSE key indicators were analyzed using the FMEA (Failure Mode and Effect Analysis) and the AHP (Analytical Hierarchy Process) methodologies. On this basis, the HSE performance assessment enhances the establishment of HSE_MS. The case study refers to refinery A, the South Pars Gas Field, Iran being reviewed from year 2009 (the beginning of the implementation of the HSE-MS) to year 2013. In health sector, the studied indicators of TROIF and TLOIF were reduced respectively from 2.4% and 1.7% in year 2010 to 0.3% and 0.3% in year 2013. This is a sign of complete accomplishment of standardization in year 2013. In the environmental sector, indicators of waste water, such as pH, TSS, BOD and COD achieved the environmental requirements. As well, all indicators of air quality in year 2013 express impressive improvements compared to year 2010.
KEYWORDS: Environment, Performance indicators, South Pars, HSE management system
INTRODUCTION
At the present time, the increasing variety of products manufactured by petrochemical plants and refineries has made them use many complex assets. Thus, accidents took place resulting from asset failures is often a natural phenomenon in the hydrocarbon refineries [1-2]. There are large varieties of risks in work spaces which need thorough inspections and managements. Neglecting and underestimating the corresponding hazard sources can bring about irremediable negative impact on sustainability, environment, health and safety. One of important methodologies for prevention and/or reduction of occupational incidents and their unpleasant consequences would be identification of hazards, followed by precise risk assessments. Risk assessment can assist
* Corresponding Author: Hamid Sarkheil
Email:
sarkheil_h@yahoo.co.uk
authorities in determining riskier components and making an appropriate management strategy in order to reduce or even eliminate the naming components. For achieving the aim, a proper technique requires that can assess the existing risks more precise, accurate, and sure [3].
HSE Key Performance Indicators in HSE_MS Establishment and Sustainability … ijoh.tums.ac.ir | 46
Fig.1. PDCA Cycle for HSE_MS [4]
Based on Deming’s Continual
Improvement Cycle; the Health, Safety, and Environment Management Systems are the acclaimed systems that not only would significantly minimize the risks to the enterprise human, natural, and capital resources; but also could boost their performances through continuous learning from the past experiences as well as effective benchmarking of their rivals. Indeed, management systems have become the main organizational pillars and the key prerequisite for their survival [5].
Risk is defined as a combination of an incident probability and its adverse consequence level [6]. Risk analysis is a structural process which identifies both incidents probabilities and the negative consequences imposed by a definite activity [5]. Risk assessment must comprise all phases and activities contained within work domains and must be performed before starting activities [7]. Risk assessment must be designed and documented on the basis of three steps in Figure 2 [7].
Fig.2. Risk Assessment application structure [7]
One of predominating targets of
management systems such as ISO 14001, OHSAS 18001 and HSE_MS is to obtain certainty that health, safety and environment affairs are structurally considered and documented within the organizational strategies [8-9]. HSE plans try to decrease the losses and costs on humans and/or environment due to occupational incidents [10].
In environment sector, no widely accepted
quantitative environmental risk indexes are proposed in the literature. Consequently, no comprehensive methodological approaches beyond those based on risk matrices [11] are present for the detailed simultaneous assessment of risk for environment and people [12] and also integrated HSE and sustainable development.
In word the results received from spending time and costs or better saying a combination of efficiency and effectiveness is perceived as
performance. Quality and effectiveness of
management systems are crucial and important factors in performing plans and achieving predefined strategies. High amounts of service costs and low levels of effectiveness for organizations indicate the necessity of monitoring, assessment and management of their performance [13]. Performance assessment can be defined as a set of activities performed in order to enhance levels of resource optimizations for achieving the systematic goals and arriving at an economic condition being fulfilled with efficiency and effectiveness [13].
Important targets in performance
assessment systems are mentioned as follows:
1. Activities continuous controlling and
performance management establishment. 2. Identification of advantages and disadvantages
of system and consequent feedback for reformation acts.
3. Improvement of decision making about activities, plans and targets.
4. Allocation of optimized resources and
improvement of assets and human resources. 5. Improvement of tracking and responsibility for
plans [14].
The aim of this study was creating a
systematic model for identification of
organizational risk-based indicators as well as an organizational performance assessment. For this purpose, we compared HSE_MS key performance indicators before and after establishment and compared the case study HSE performance indicators and OGP standard levels in the South Pars Gas Complex of Iran.
MATERIALS AND METHODS
Performance assessment processes
comprise four elements as the headquarters mentioned in followings [14]:
Data preparation: This part of process is responsible for designing methodology and steering acts which can define what, is in the assessment process on the basis of standards.
Measurement and assessment: The
activities and/or standards.
Correcting Acts: After comparisons
between performance and standards, deviations are determined by feedback mechanism. The correcting acts proceed on so that no significant deviation or
gap can be determined between present
performance and standards.
Relation Network: This element builds a relation among the agents: data collector, assessor and corrector. The relation network affects the structure of assessment system; or in other words, all performance assessments are structured and influenced by relation network.
The methodology in the present paper was descriptive and statistical analysis of defined indicators in three integrated fields of health, safety and environment. The related data was extracted from archives of HSE risk assessment and management performed via HSE-MS audition. In some parts, HSE reports were studied and extracted from the HSE Organization of the refinery. The next sections try to define and formulate the methodology in both verbal and formula format; hence the corresponding materials and statistical methods can be studied thereby.
Based on the methodology of performance indicator assessment, in the first step performance
indicators had to be identified in three fields of study i.e., health, safety and environment. In continue, the results for organizational performance monitoring were collected in every three fields for the time interval from 2009 up to 2013. Then, the company performances were put under analysis and comparison in the defined period. The year 2009 was the starting year for production operations in the refinery A and the year 2011 was opted as HSE_MS establishment year in the company.
Risk assessments in all HSE fields were
accomplished via an arrangement of
methodologies:
Failure Mode and Effect
Analysis
(FMEA) and Analytic Hierarchy Process AHP according to Fig.3. Based on definition of risk, the probability of risks in present study was evaluated due to frequency term in the defined indicator, and the severity of risks was engaged with the type of respective indicator. For instance, Medical Treatment Case has higher level of severity than First Aid Case and lower level of severity than Paralysis or Fatality. In this case, the major causes of incidents and their corresponding consequences were identified and assessed on the basis of OGP standard levels. About the weight factors in AHP, the similar attitude of OGP is approached and they are studied with same weights.HSE Key Performance Indicators in HSE_MS Establishment and Sustainability … ijoh.tums.ac.ir | 48
Determination of Indicators: In health field, the important indicators were categorized as personnel absence indicators: Sickness Absence Rate (SAR) and occupational illness indicators:
Total Reported Occupational Illness
Frequency (TROIF) and Total Lost time
Occupational Illness Frequency (TLOIF) are defined as Equations 1-3:
(Equation 1):
SAR=
(Equation 2):
TROIF=
(Equation 3):
TLOIF =
In safety field, two indicator categories of Leading and Lagging indicators are considered to be more important. Among the Lagging indicators,
the dominating factors are Total Recordable
Incident Rate (TRIR) and Lost Time Injury Frequency (LTIF) as Equations 4 and 5.
(Equation 4): TRIR=
(Equation 5): LTIF=
Among leading indicators, Anomalies Frequency and Anomalies Action Completed are the effective factors. Anomalies Frequency is defined as: Total number of Anomalies (unsafe conditions and unsafe acts) in a million man-hour. Anomalies Action Completed is defined as Total number of completed anomalies per million man-hour.
Annually large amounts of pollutants can be abruptly released into the environment (water, air, and soil), which can have negative impacts on the quality of the local environment and human health. The degree of damage is determined by the amount and type of the released materials and the vulnerability of the risk receptors (the ecology and lives) [15-16]. Thus, environmental performance indicators can be useful and applicable tools for assessment and management of environmental issues. The important indicators in environment field are found in air and waste water. The naming indicators for air are: concentrations of pollutants: CO, CO2, SO2, NOx, TOC, VOCs (Volatile Organic
Compounds), PM and CH4. The effective factors in
waste water are: TSS (Total Suspended Solids),
BOD (Biological Oxygen Demand), COD
(Chemical Oxygen Demand) and pH in outfall basin.
RESULT
Data relates to Refinery A, South Pars Gas Field, Bushehr province, Iran from year 2009 to 2013. The criteria indicators are HSE performance indicators of Oil and Gas Producers (OGP) standard and time dependent sustainability pattern.
Health Indicator: As it is shown in Figure 4-6; the variations of health indicators: SAR, TROIF and TLOIF are all decreasing by passing time, which represent influences of sustainability.
About personnel absence indicator, no year was in complete compliance with standard level. On the other hand, occupational illness indicators TROIF and TLOIF were in compliance with the corresponding standard levels in the studied time interval (except TROIF 2010 with 2.4 (study) >2.0 (standard)). About TROIF and TLOIF in study, Refinery A was the best complied refinery among the refineries of South Pars Gas Complex (SPGC).
Fig.5. Analysis bars for TROIF indicator in health field
Fig.6. Analysis bars for TLOIF indicator in health field
Safety Indicators: According to Figure 7 and 8, variations of Lagging indicators: LTIF and TRIR in period between 2009 and 2013 had irregular patterns which were generally higher than OGP limits. So this section shows insufficient performance in field of safety.
About Leading indicators indicator
Anomalies Frequency had an increasing pattern.
Although the year 2012 was an exception and it was in compliance with standards. This could be due to positive results of establishment of HSE_MS in the year 2011 in the company. The indicator Anomalies Completed was irregularly distributed and it was not in accordance with Anomalies Frequency Indicator pattern.
HSE Key Performance Indicators in HSE_MS Establishment and Sustainability … ijoh.tums.ac.ir | 50
Fig.8. Analysis bars for TRIR indicator in Safety field
Environment Indicators: Figure 9 shows
distribution of air pollution indicators in the case study from year 2011 to year 2013. On this base, the year 2011 had the highest levels of indicators while the year 2012 had the lowest levels of the
indicators. This is while; the ideal pattern for this distribution would be the completely decreasing pattern, although it did not happen because of considerations in process, development and management.
Fig.9. Analysis bars for Air indicators in environment field
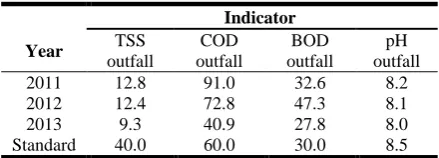
Waste water indicators and respective standard levels in the study can be found in Table1. Accordingly, in year 2013, all the present indicators were in complete compliance with the respective standard levels. This notion can represent establishment of HSE_MS with the properly allocated strategies. It is noticeable that TSS and pH in the case study were always in compliance with their standards.
Table 1. Wastewater indicators and standard levels from 2011 to 2013
Indicator
pH outfall BOD
outfall COD
outfall TSS
outfall
Year
8.2 32.6
91.0 12.8
2011
8.1 47.3
72.8 12.4
2012
8.0 27.8
40.9 9.3
2013
8.5 30.0
60.0 40.0
Standard
DISCUSSION
It is of great importance that the present
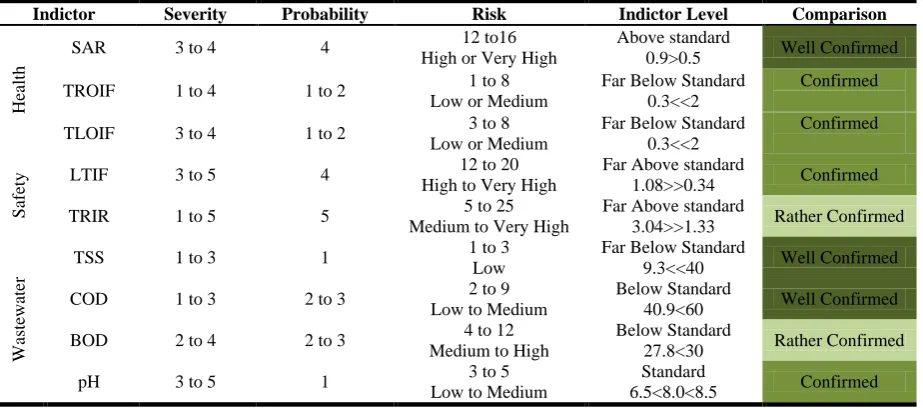
study was based on OGP standard’s KPIs, which attempted to handle justified comparisons between the HSE key performance indicators of case study and the OGP standard levels for naming KPIs. However, according to Table 2, a Matrix risk assessment is performed for comparison of results.
The subsequent matrix risk assessment for studied HSE indictors is presented in Table 3. About field air of environmental indicators, comparisons are made via air quality indictor. The naming air indictors in the study are mainly above standard level and this is validated by air quality index.
Table 2. Matrix Risk assessment methodology
Rare 1 1 2 3 4 5
at times 2 2 4 6 8 10
Sometimes 3 3 6 9 12 15
Often 4 4 8 12 16 20
Frequent/always 5 5 10 15 20 25
Risk Colors Low Risk Medium Risk High Risk Very High Risk
Table 3. Comparison of Matrix Risk Vs HSE Indictors in 2013
Indictor Severity Probability Risk Indictor Level Comparison
Hea
lt
h
SAR 3 to 4 4 12 to16 High or Very High
Above standard
0.9>0.5 Well Confirmed
TROIF 1 to 4 1 to 2 1 to 8 Low or Medium
Far Below Standard 0.3<<2
Confirmed
TLOIF 3 to 4 1 to 2 3 to 8 Low or Medium
Far Below Standard 0.3<<2
Confirmed
Safe
ty LTIF 3 to 5 4 High to Very High 12 to 20 Far Above standard 1.08>>0.34 Confirmed
TRIR 1 to 5 5 5 to 25 Medium to Very High
Far Above standard
3.04>>1.33 Rather Confirmed
Wa
stewa
te
r
TSS 1 to 3 1 1 to 3 Low
Far Below Standard
9.3<<40 Well Confirmed
COD 1 to 3 2 to 3 2 to 9 Low to Medium
Below Standard
40.9<60 Well Confirmed
BOD 2 to 4 2 to 3 4 to 12 Medium to High
Below Standard
27.8<30 Rather Confirmed
pH 3 to 5 1 3 to 5 Low to Medium
Standard
6.5<8.0<8.5 Confirmed
Paying attention that the production phase in case study started in the year 2009, the contrasts of rebellious performance indicators in the starting years can be justified for the reasons of new registration of HSE_MS and sustainability time dependency. On the other hand, in the year 2011, establishment of HSE management system all through the company brought about minimizations of deflections of HSE performance indicators from requirements. Some outstanding impacts of HSE_MS establishment in the case study are mentioned as:
• Enhancement of HSE Culture • Holding regular learning courses • Environmental pollution management
• Revising the design of Waste water treatment process
• Performing systematic risk analyses
From the perspective of sustainable development, fields of studies such as those mentioned in following can result in corporations of HSE, economy, ecology and society more strongly in order to approach sustainable development and to have sustainable management systems.
1. Indirect and intangible costs
2. Role of insurance systems in risk transfer 3. Green industry and economy
4. Eco space 5. Friends of Earth
6.HSE culture and environmental friendly attitudes
The results show that the safety system that comes from HSE-MS Implementation can be clearly identified by anomalies. Index definition can be helpful for the safety system effectiveness, anomalies feedback recognition and system continual improvement.
Lagging indicators measure incidents of the company in the form of past accident statistics containing: Injury frequency and severity, OSHA recordable injuries, Lost workdays, Worker’s compensation costs. Lagging indicators are the traditional safety metrics used to indicate progress toward compliance with safety rules.
The reactionary nature of lagging
indicators makes them a poor gauge of prevention. For example, when managers find a low injury rate, they may become complacent and put safety on the bottom of their to-do list, when in fact, there are numerous risk factors present in the workplace that will contribute to future injuries.
A leading indicator is a measure preceding or indicating a future event used to drive and measure activities carried out to prevent and control injury. Some examples for these activities are:
HSE Key Performance Indicators in HSE_MS Establishment and Sustainability … ijoh.tums.ac.ir | 52
2. Ergonomic opportunities identified and corrected 3. Reduction of MSD risk factors
4. Employee perception surveys 5. Safety audits.
Leading indicators are focused on future safety performance and continuous improvement. These measures are proactive in nature and report what employees are doing on a regular basis to prevent injuries.
In order to achieve more effectiveness and efficiency in HSE management for the case study, the following notes are highlighted:
1. Preparation of data centers for individual and organizational indicators.
2. Applications of green/environmental accounting measures.
3. Optimization of energy and materials by modern technologies such as green studies which can minimize the both losses and costs imposed by risks especially environmental and sustainable risks.
4. Performing cost benefit analysis CBA as an applied theory and philosophy handling cost oriented risk assessment which can enhance HSE_MS establishment.
Considerable attentions of world class organizations _particularly oil and gas companies_ to HSE integrated management system and sustainable development represents the significance of health, safety and environment considerations in planning and development of products, services and processes. Today HSE_MS has been turned into inherent and vital parts of an organization. HSE key performance indicators _as presented within the study_ can optimize many actions such
as monitoring, tracking and responsibility,
continual improvement, risk assessment and performance assessment so that management authorities can have well designed metrics for their company HSE performances. In this case, they can build up suitable decision making processes for finance, risk, pollution, health, asset, ecology, optimization and sustainability.
As the design of the proposed
methodology, it pursues the best integration of four philosophy models of inherently safer design as well as systematic risk management comprising:
1. Reactive Model,
2. Calculative Model,
3. Proactive Model and
4. Generative Model.
This is because the HSE key indicators have both backward and forward attitudes about the incidents; so they develop an equation between reactive, calculative and proactive philosophies. Actually they contain in themselves all preventive, mitigative and controlling measures.
The study methodology approaches to generative model based on the interactive dependency phenomena so it achieves integration
of HSE and sustainability phenomena.
CONCLUSION
This study proposes a systematic model for identification of organizational risk-based indicators as well as an organizational performance assessment. This is accomplished via a structural methodology combining analytic hierarchy process and failure mode and effect analysis. The case study accomplished to cover two aspects:
1.Comparing HSE_MS key performance indicators before and after establishment to derive positive impact of HSE_MS registration and establishment on integration of HSE and sustainability. This gives systematic managerial tool about HSE conditions within the naming company (Refinery A, SPGC, IRAN).
2. Comparing the case study HSE performance indicators and OGP standard levels in order to perform a qualified and acceptable performance assessment. Other targets would be finding steering strategies, challenges, deflections,
authorities and weak points about HSE
considerations and requirements.
ACKNOWLEDGEMENT
The authors would like to express their gratitude to the authorities at South Pars Gas Complex supports. The authors declare that there is no conflict of interests.
REFERENCES
1. Schouwenaars E. The risks arising from major accident hazards. Refining Management Forum, DNV Energy, 2008; Copenhagen, Denmark.
2. Saiidi E, Anvaripour B, Jaderi F, Nabhani N. Fuzzy risk modelling of process operations in the oil and gas refineries. J Loss Prev Process Ind 2014; 30: 63-73.
3. Jamshidi A, Yazdani-Chamzini A, Yakhchali, S
H, Khaleghi S. Developing a new fuzzy inference system for pipeline risk assessment. J Loss Prev Process Ind 2013; 26: 197-208.
4. BRITISH STANDARD, (BS) 8800: Guide to
Occupational health and safety management systems. Copyright by the British Standards institution. 1996.
5. Zutschi A, Sohal A. Integrated management
system: the experience of three Australian
organisations. JMTM 2003; 16(2): 211-232.
6. Lawson K. Pipeline Corrosion Risk Analysis - an assessment of deterministic probabilistic methods. Anti-Corrosion Method and Materials 2005; 52(1): 3-10.
7. NORSOK STANDARD. Health Safety and
Environmental (HSE) in construction–related Activities. S/012/Rev02. August 2002.
8. Mohammad fam I, Nikoomaram H, Soltanian
training methods in health, safety and environment (HSE) participation improvement. J Loss Prev Process Ind 2012; 25(2): 250-253.
9. Mohammadfam I, Mahmoudi S, Kianfar A.
Development of the health, safety and environmental excellence instrument: A
HSE-MS performance measurement tool. Procedia
Eng 2012; 45: 194-198.
10.Azadeh A, Rouzbahamen M, Sabri M,
Valianpour F, Keramati A. Improved prediction
of mental workload versus HSE and
ergonomics factors by an adaptive intelligent algorithm. Safety Science 2013; 58: 59-75.
11.ISO. ISO International Organization for
Standardization Standard 17776:2000. Petroleum and natural gas industries - Offshore production installations - Guidelines on tools and techniques for hazard identification and risk assessment, ISO. 2010; Genève.
12.Bonvicini S, Antonioni G, Morra P, Cozzani V.
Quantitative assessment of environmental risk due to accidental spills from onshore pipelines, Process Saf Environ Prot 2014; 93: 31–49.
13.Blanchard WJ. System engineering and
analysis. The USA: Prentice Hall. International Inc; 1998.
14.Willie H. Product Safety Management and
Engineering. Library of Congress- in publication date, 1993.
15.Huang L, Shao Z J, Bao W L , Duan B L, Bi J,
Yuan Z W. The influencing factors of the WTP for the risk reduction of chemical industry
accidents in China. Front. Environ Sci Eng
2012; 6 (6): 860–868.
16.Chen Q Q, Jia Q, Yuan Z, Huang L.
Environmental risk source management system
for the petrochemical industry. Process Saf
Environ Prot 2013;
![Figure 2 [7].](https://thumb-us.123doks.com/thumbv2/123dok_us/10095484.1996353/2.595.74.285.516.634/figure.webp)