Please cite this article in press as: Aghamolaei T, Madadizadeh F, Ghanbarnejad A. Confirmatory factor analysis of the Persian version of
J Biostat Epidemiol. 2017; 3(1): 20-8.
Original Article
Confirmatory factor analysis of the Persian version of the multidimensional
health locus of control scale - Form A
Teamur Aghamolaei1, Farzan Madadizadeh2,4, Amin Ghanbarnejad3,4*
1
Department of Public Health, School of Health, Social Determinants in Health Promotion Research Center, Hormozgan University of Medical Sciences, Bandar Abbas, Iran
2
Noncommunicable Diseases Research Center, Fasa University of Medical Sciences, Fasa, Iran 3
Department of Public Health, School of Health, Social Determinants in Health Promotion Research Center, Hormozgan University of Medical Sciences, Bandar Abbas, Iran
4
Department of Epidemiology and Biostatistics, School of Health, Tehran University of Medical Sciences, Tehran, Iran
ARTICLE INFO ABSTRACT
Received 27.05.2016 Revised 03.09.2016 Accepted 13.10.2016 Published 04.03.2017
Background & Aim: Health locus of control (HLC) is a construct that refers to how person’s beliefs influence on his/her health. The aim of this study was to assess the reliability and construct validity of multidimensional HLC (MHLC) scale in a representative Iranian samples.
Methods & Materials: This cross-sectional study was done among 881 subjects over 15 years old in Bandar Abbas, in the south of Iran through cluster sampling. Translated Persian version of MHLC questionnaire was administered to participants. Data were analyzed using confirmatory factor analysis (CFA) to compare three different models. Multiple groups CFA were conducted to examine the measurement equivalence across gender (390 men and 391 women) in EQS software. Reliability assessment was done by Cronbach’s α coefficient in SPSS v.16 software.
Results: Based on CFA, 18-item with three correlated factor had good fit (goodness-of-fit index = 0.92 and comparative fit index = 0.9). The results established full configural, metric, and scalar invariance across gender. Cronbach’s α for subscales was ranged from 0.65 to 0.74.
Conclusion: Eighteen items Persian version of MHLC scale in three oblique subscales was introduced as a valid and reliable tool for assessing HLC among the general population in Iran. Furthermore, it is derived that the MHLC was full invariant across gender.
Key words: Factor analysis; Validation study; Reliability
Introduction
1Health locus of control (HLC) is a construct that refers to how person’s beliefs influence on his/her health (1). HLC based on Rotter’s social learning theory was developed to measure these beliefs on an introverted internal-external dimensionality (2, 3).
The individuals with an internal locus of
* Corresponding Author: Amin Ghanbarnejad, Postal Address: Department of Epidemiology and Biostatistics, School of Health, Tehran University of Medical Sciences, Tehran, Iran.
Email: [email protected]
control are believed to have control on the environmental condition and generally are effective in social activity and self-confident while individuals with an external locus of control believe to their outcomes determined by external factors and they do not have control over their health (4). Success and failures of these people are believed to determine by factors such as chance, others, and fate and they often are not responsible for their actions in life (5).
believes that personal activities or opinions can affect their outcomes of their health) and external locus of control (if the individuals believe in their health can be determined by powerful others such as god, physicians, or if chance is believed to control the health outcome) (1).
These three dimensions (internal, chance, and powerful others) are traditionally assumed to be independent factors; however, some studies have shown non-negligible between factor correlations (6, 7). Score on each MHLC subscales can be determined by beliefs and actions an individual experienced in his/her life.
MHLC scales have three Form A, B, and C. Form A and B is equivalent and can be administered to general community (1) and Form C was developed by Wallston and Stein to evaluate the HLC among unhealthy individuals (8).
The MHLC scales were applied to different languages (9-12), and cross-cultural differences in HLC were studied. South Asian woman was compared to British Caucasian women in a study, and it is concluded that Asian women have a higher score on internality dimension than British women because, in the Asian cultures, religion and belief in God play an important role in life. The outcome and actions a religious person have done in life are based on trusting in god and this belief help individuals to overcome health problems and disease shortly that reflects the high score on internal dimension. It is remarkable to mention that Asian women scored higher on externality than western women. Belief in fate and assisting others were the component of Asian cultures that controls the externality HLC. However, the construct validity of HLC scale in two compared samples has not been investigated in the mentioned study, and it could be different over cultures (13).
Iranian community is a specific one due to the beliefs of people and its religiosity. As mentioned previously these beliefs could affect the procedure of responding to the subscales of MHLC. To the best of our knowledge, there is only one study to assess the factor structure and reliability of MHLC among Iranian community that has done by Moshki et al. (14), but the
population in the study restricted to college students, and it could not be considered as a representative sample for all Iranian people. In this study, we investigated the structure of translated Persian version of MHLC - Form A, using confirmatory factor analysis (CFA) based on some theoretical constructs defined to the present in a relatively representative sample of Iranian adults. Form A is used in general population; therefore, we use it in the study. Some studies evaluated the construct validity and reliability of other forms (B and C) across the world (15-17).
Some empirical studies found that sex of individuals related to MHLC (18-20), and some other studies concluded that MHLC does not vary in gender (21, 22). Therefore, more research is needed to clarify whether gender differences in MHLC exists. One way to reply to this issue is to examine whether men and women conceptualize HLC in a similar way. That is, to examine whether measurement equivalence/invariance (ME/I) can be established across genders. Because women and men may have different beliefs about health and its locus of control, it is essential to ensure that groups compared share similar conceptualizations of the relevant latent construct (23-25). Up today, there is only one research in comparing factor structure of MHLC across gender (26), and this context should be investigated in other culture and extensively in other western samples. In this study, we also analyze the best models across gender for ME/I.
Methods
In this cross-sectional study conducted during 2013-2014, 881 participants over 15 years old were asked to fill the questionnaire. Individuals who answered the questionnaire completely were 781 out of 881 (response rate = 88.65%). Non-respondents were excluded from the study. 49.9% of them were male and 51.1% were female.
center and their coverage, and then from each district, two location points were selected, and from each point, 10 households were selected in a regular manner. In each household, two persons were sampled at random. Bandar Abbas is an economic and industrial city in south of Iran, and due to this characteristic, people from all ethnicity founded in Iran live in it.
Ethical approval of this study was gained from the Research Ethics Committee, which at the time of the study was based at Hormozgan University of Medical Sciences. Individuals were informed through an informed consent based on the Helsinki declaration (28).
The participants were asked to answer the HLC questionnaire. The questionnaire was MHLC with 18 questions to assess the HLC in three dimensions: Internality, chance, and powerful others. Each subscale consisted 6 items. For simplicity, in rest of the paper, we indicate each subscale with abbreviated one as follows: Internal HLC dimension as IHLC; chance HLC dimension as CHLC and powerful others HLC dimension as PHLC.
We used a translated version of MHLC that is rephrased according to that translated by Moshki et al. (14).
Each item is scored based on 6-point Likert scale from 1 (“strongly agree”) to 6 (“strongly disagree”), and score for each subscale is computed as summation of corresponding items. Therefore, each subscale scoring ranged from 6 to 36.
Construct validity of the questionnaire was evaluated by CFA. In CFA, researcher is interested in investigating a specific factorial structure so that number of factors, number of items and pattern of loading items on factors were determined according to a hypothesized theory and then fitness of model assess based on covariance structure of observed data (29, 30). Minimum sample size for conducting CFA is approximately 10 for each item (31) since the questionnaire was used in this study contained 18 items, the minimum required sample size was 180. In this study, 881 subjects were surveyed that met the minimum condition. Construct validity of the questionnaire was evaluated in a representative Iranian community through the CFA in EQS 6.1 (Multivariate
Software Inc. Encino, CA) (32), and Cronbach’s alpha was used to assess the scale and subscales reliability in SPSS (version 16, SPSS Inc., Chicago, IL, USA).
Fitness of hypothesized model was evaluated based on several fit indices: chi-square test of model fit, goodness-of-fit index (GFI), normed square statistics calculated as ratio of chi-square to degrees of freedom, adjusted GFI (AGFI), root mean square error of approximation (RMSEA), and Akaike information criterion (AIC). Since every index indicating some aspects of model fitting, so we used several indices for model assessment (33). The value of GFI and AGFI is between 0 and 1 and the values > 0.9 represent the good model fitting (31, 34). RMSEA is a persimmons correction index and the value < 0.05 indicate good fit, value near the 0.08 indicates moderate fit, and value > 0.1 indicate poor model fitting (35). Low value of chi-square statistic and non-significant P value indicate good fit, but these criteria are hardly met in practice (36), so we used normed chi-square statistics instead. A normed chi-square < 5 indicated an adequate model fit, while a value ≤ 3 denoted a close fit (29, 33). For analysis of ME/I, a series of nested multiple groups CFAs (MGCFA) were conducted to inspect ME/I across gender with EQS 6.1 (32). A series of chi-square difference tests among pairs of nested MGCFA models were used (29, 33, 37), to examine whether a specific type of ME/I was obtained or not.
Results
Demographic characteristics: The mean age of
college students. Preliminary analysis showed that there is no significant difference in demographic characteristics such as sex, education level, occupational status, and household location and age between respondents and non-respondents participants.
Reliability analysis and internal consistency:
Scale descriptive statistics for MHLC subscale, IHLC, CHLC, and PHLC were reported in table 1.
Reliability assessment was carried out through Cronbach’s alpha. Descriptive statistics and reliability related index were shown in table 2.
Table 1. Descriptive statistics for subscales of MHLC- Form A
Subscale Number of items Mean ± SD
IHLC 6 30.23 ± 4.22
CHLC 6 21.54 ± 6.67
PHLC 6 30.19 ± 5.96
MHLC: Multidimensional health locus of control, IHLC: Internal health locus of control, CHLC: Chance health locus of control, PHLC: Powerful others health locus of control, SD: Standard deviation
Initial model identification: In context of
CFA, we checked the assumption of normality
through the Mardia’s multivariate kurtosis and its normalized estimate (38). The assumption of normality was not met according to normalized kurtosis estimate 57.78 (P < 0.0010), then we used robust generalized least square method for estimation instead of maximum likelihood approach. We used Satorra-Bentler scaled chi-square statistics (39), for correction of non-normality existing in our data.
Three models are investigated in the present study; (1) one factor model for HLC; (2) two factor (internality/externality) model; and (3) correlated three-factor models with three oblique factors.
Model comparison: All of the models were
constituted 18 items. Model 1 has only one latent factor, Model 2 has two latent factor (externality factor combined Chance and Powerful others subscales), and Model 3 has three latent factor so that 6 items were in each subscale (IHLC, CHLC, and PHLC). For Model 2 and Model 3, we considered the correlation between factors according to previous studies (1, 40, 41).
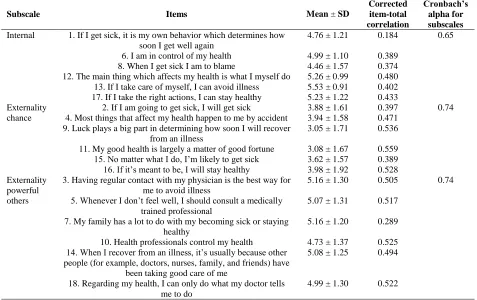
Table 2. Means, Standard deviations, item-total correlations and Cronbach’s alpha coefficients of items
Subscale Items Mean ± SD
Corrected item-total correlation
Cronbach’s alpha for subscales Internal 1. If I get sick, it is my own behavior which determines how
soon I get well again
4.76 ± 1.21 0.184 0.65
6. I am in control of my health 4.99 ± 1.10 0.389 8. When I get sick I am to blame 4.46 ± 1.57 0.374 12. The main thing which affects my health is what I myself do 5.26 ± 0.99 0.480 13. If I take care of myself, I can avoid illness 5.53 ± 0.91 0.402 17. If I take the right actions, I can stay healthy 5.23 ± 1.22 0.433 Externality
chance
2. If I am going to get sick, I will get sick 3.88 ± 1.61 0.397 0.74 4. Most things that affect my health happen to me by accident 3.94 ± 1.58 0.471
9. Luck plays a big part in determining how soon I will recover from an illness
3.05 ± 1.71 0.536 11. My good health is largely a matter of good fortune 3.08 ± 1.67 0.559 15. No matter what I do, I’m likely to get sick 3.62 ± 1.57 0.389 16. If it’s meant to be, I will stay healthy 3.98 ± 1.92 0.528 Externality
powerful others
3. Having regular contact with my physician is the best way for me to avoid illness
5.16 ± 1.30 0.505 0.74
5. Whenever I don’t feel well, I should consult a medically trained professional
5.07 ± 1.31 0.517 7. My family has a lot to do with my becoming sick or staying
healthy
5.16 ± 1.20 0.289 10. Health professionals control my health 4.73 ± 1.37 0.525 14. When I recover from an illness, it’s usually because other
people (for example, doctors, nurses, family, and friends) have been taking good care of me
5.08 ± 1.25 0.494
18. Regarding my health, I can only do what my doctor tells me to do
Table 3. GFI for models
Model χ2 df χ2/df GFI AGFI CFI RMSEA (90% CI) AIC
1: One general factor 579.01 134 4.3 0.89 0.86 0.87 0.077 (0.071-0.082) 311 2: Correlated 2 factor 530.28 135 3.9 0.90 0.88 0.89 0.071 (0.066-0.077) 261.7 3: Correlated 3 factor 451.7 132 3.4 0.92 0.90 0.90 0.049 (0.04-0.059) 187.7
GFI: Goodness-of-fit index, AGFI: Adjusted goodness-of-fit index, CFI: Comparative fit index, RMSEA: Root mean square error of approximation, CI: Confidence interval, AIC: Akaike information criterion
CFA was conducted for all models separately, and the results for goodness-of-fit were shown in table 3.
Based on GFI, all models except Model 1 fit the data well. Furthermore, the value of AGFI for Model 1 and Model 2 was less than determined criteria for good fitting. The reported chi-squared with an associated degree of freedom for all models indicating poor fit (P < 0.0001), but as mentioned previously we did not use it as an index for evaluating the goodness of fitting model (36). Normed chi-square statistic for Model 2 and Model 3 indicating adequate but close fit. RMSEA for Model 3 was < 0.05 and indicating good model fitting, but for Model 2 and Model 3 based on the RMSEA values, it can be resulted to the moderate fit. At final, based on the reported results and comparison between models, we choose the Model 3 as best model. Furthermore, it is mentionable that AIC for Model 3 was less than others that indicated the superiority of Model 3. Factor loadings for
correlated three-factor model were reported in table 4.
Correlation analysis: Correlations between
factors were estimated from CFA obtained solution shown in table 5. The only significant correlation was between IHLC and PHLC.
ME/I: At last step of analysis, we examined
ME of three-factor model across gender in four stages: first, we test the model separately for men and women. Second, we conducted the simultaneous test of the equal form (identical factor structure). Third, we test the equality of factor loadings. Fourth, we test the equality of indicator intercepts.
Single-group CFAs were first conducted to examine the construct validity of the MHLC within each sex group. For men, the three-factor model verified acceptable model fit. All factor loadings were significant at a 0.05 level. For women, the three-factor model confirmed marginally acceptable model fit. Convergent validity was supported because all factor loadings were significant at the 0.05 level.
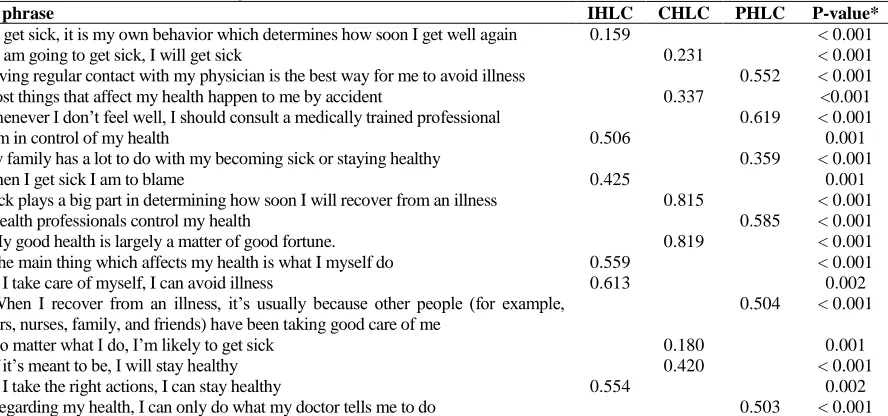
Table 4. Standardized factor loadings for correlated three-factor model
Item phrase IHLC CHLC PHLC P-value*
1. If I get sick, it is my own behavior which determines how soon I get well again 0.159 < 0.001
2. If I am going to get sick, I will get sick 0.231 < 0.001
3. Having regular contact with my physician is the best way for me to avoid illness 0.552 < 0.001 4. Most things that affect my health happen to me by accident 0.337 <0.001 5. Whenever I don’t feel well, I should consult a medically trained professional 0.619 < 0.001
6. I am in control of my health 0.506 0.001
7. My family has a lot to do with my becoming sick or staying healthy 0.359 < 0.001
8. When I get sick I am to blame 0.425 0.001
9. Luck plays a big part in determining how soon I will recover from an illness 0.815 < 0.001
10. Health professionals control my health 0.585 < 0.001
11. My good health is largely a matter of good fortune. 0.819 < 0.001
12. The main thing which affects my health is what I myself do 0.559 < 0.001
13. If I take care of myself, I can avoid illness 0.613 0.002
14. When I recover from an illness, it’s usually because other people (for example, doctors, nurses, family, and friends) have been taking good care of me
0.504 < 0.001
15. No matter what I do, I’m likely to get sick 0.180 0.001
16. If it’s meant to be, I will stay healthy 0.420 < 0.001
17. If I take the right actions, I can stay healthy 0.554 0.002
18. Regarding my health, I can only do what my doctor tells me to do 0.503 < 0.001
Table 5. Correlation between subscales in health locus of control
Subscales IHLC CHLC
CHLC 0.032
PHLC 0.621* 0.104
*Significant at level 0.05. IHLC: Internal health locus of control, CHLC: Chance health locus of control, PHLC: Powerful others health locus of control
For multiple groups CFA, at first a test of configural invariance was conducted by considering a baseline model with no constrained parameters across two groups (equal form). The model showed acceptable model fit. Since configural invariance has been verified, consequent ME/I tests can be conducted. At the second step of MGCFA, to test metric invariance, corresponding factor loadings were set to be equal across two groups (equal factor loadings). The chi-square differences test result proposed that factor loadings were invariant across gender ( , P > 0.0500).
At third step of MGCFA, scalar invariance was tested by further constraining like items’ intercepts on the latent construct to be invariant across gender (equal indicator intercepts). The constrained model showed acceptable model fit. Based on the chi-square differences test, it’s concluded that factor like item s’ intercepts on the latent constructs was invariant across gender ( , P > 0.0500). The results of this section are shown in table 6.
Discussion
The first aim of this study was to examine the internal consistency of the MHLC scale to evaluate its reliability. Cronbach’s α in the present study was ranged from 0.65 to 0.74
which was comparable to that in Wallston’s normative data (0.67-0.77) (1), Kuwahara’s study (0.62-0.76) in Japan (19), Moshki’s study (0.66-0.72) in college students (14), Astrom’s study (0.72-0.76) in Ghana (22), Hashemian’s study (0.61-0.80) among Iranian female with history of breast cancer (42), and Marshal’s study (43). These values showed good reliability and were sufficiently acceptable for administration to Iranian community.
All the correlations between factors were computed. Since these coefficients were calculated from latent variables, so the measurement error is considered in the calculation. There was an insignificant correlation between IHLC and CHLC and its value considered as weak. Furthermore, the correlation between CHLC and PHLC was weak and insignificant. The only significant and approximately strong correlation was between IHLC and PHLC. The reported correlations between factors were in a different pattern around the world (1, 7, 41). However, in this study, correlation between IHLC and CHLC and between CHLC and PHLC was weak that is not in accordance with the original study by Wallston and colleagues (7). They mentioned that there is no correlation between IHLC and PHLC, but in the present study, we found that there is relatively strong correlation between IHLC and PHLC; this can be true because a person’s beliefs could be in a close interaction with others beliefs in Iranian community.
As a secondary goal, construct validity of the HLC scale was evaluated through CFA by comparing three competing models. This is the first study in Iran that comparing theoretical models of MHLC.
Table 6. Tests of measurement invariance of MHLC in men and women
Test type χ2 df
Δdf RMSEA (90% CI) GFI AGFI
Single group solution
Men (n = 390) 239.65 132 0.046 (0.036-0.055) 0.92 0.90
Women (n = 391) 314.95 132 0.06 (0.051-0.068) 0.91 0.90
Measurement invariance
Equal form 553.52 264 0.038 (0.033-0.042) 0.91 0.90
Equal factor loadings* 562.65 279 9.13 15 0.036 (0.032-0.04) 0.91 0.90
Equal indicator intercepts** 579.43 294 16.78 15 0.035 (0.031-0.039) 0.91 0.90
A one-factor model for HLC was investigated in the present study and was not met the criteria for acceptable fit; therefore, it can be concluded that HLC should be a multidimensional scale rather than one dimension. After that, we were looking for a better model and compared the model with 2 latent factors “internality” and “externality” and 3 latent factors titled “internality,” “chance externality,” and “powerful others.”
The two-factor model did not fit the data well, however, some studies such as Astrom and Blay (22), Cooper and Fraboni (40), and O’Looney and Barett (26), stated that HLC has only two dimensions: internality and externality.
The results confirmed the original factor structure with the 18 items of the original instrument grouped in three correlated theoretical dimensions as conceptualized by the original authors of the MHLC (IHLC, CHLC, and PHLC). CFA closely approached the standard criteria for adequate fit for models of this type (29). The three-factor model confirmed by CFA is similar to Otto study in Germany (1, 7, 41). Spanish version applied by Rodriguez-Rosero (44), kuwahara’s study (19), Hashemian’s study (42), Ross et al. study among college students (27), and Casey study (45).
Conclusion
Based on the results, this instrument has good reliability and validity among a sample of general individuals. Cross-cultural of this instrument confirmed well in the present study. Furthermore, it mentioned that the scale with three subscales is the best model to responsible for evaluating HLC in three aspects including internality, externality chance, and externality powerful others. The usefulness of application of this instrument in general population was doubtful before doing this study, but now it can be administered to the Iranian sample with confidence. It is noticeable that as a limitation the sample did not contain rural population, and it could be different, also ME/I analysis was performed only across the gender. Further studies can be proposed to investigate such study in other communities and cultures and assess the
other aspects of ME in the future. Furthermore, it is mentionable to assess other forms of MHLC, i.e., Form B and C in an Iranian population, there are some studies which evaluate psychometric properties of other forms (15, 16).
Conflict of Interests
Authors have no conflict of interests.
Acknowledgments
The authors wish to thank the participants for contributing the research and respond the questionnaire patiently. Part of funding for conducting this research was provided by Deputy of Research and Technology, Hormozgan University of Medical Sciences, Bandar Abbas, Iran.
References
1. Wallston KA, Wallston BS, DeVellis R. Development of the Multidimensional health locus of control (MHLC) sales. Health Educ Monogr 1978; 6(2): 160-70.
2. Strickland BR. Internal-external expectancies and health-related behaviors. J Consult Clin Psychol 1978; 46(6): 1192-211.
3. Rotter JB. Generalized expectancies for internal versus external control of reinforcement. Psychol Monogr 1966; 80(1): 1-28.
4. DeMello LR, Imms T, Psychological studies. Self-esteem, locus of control and coping styles and their relationship to school attitudes of adolescents. Psychological Studies 1999; 44(1-2): 24-34.
5. Gomez R. Locus of control and avoidant coping: Direct, interactional and mediational effects on maladjustment in adolescents. Pers Individ Dif 1998; 24(3): 325-34.
6. Luszczynska A, Schwarzer R. Multidimensional health locus of control: Comments on the construct and its measurement. J Health Psychol 2005; 10(5): 633-42.
multidimensional health locus of control scales. J Health Psychol 2005; 10(5): 623-31. 8. Wallston KA, Stein MJ, Smith CA. Form C
of the MHLC scales: A condition-specific measure of locus of control. J Pers Assess 1994; 63(3): 534-53.
9. Roberts LJ, Ho R. Development of an Australian health locus of control scale. Pers Individ Dif 1996; 20(5): 629-39.
10. Malcarne VL, Fernandez S, Flores L. Factorial validity of the multidimensional health locus of control scales for three American ethnic groups. J Health Psychol 2005; 10(5): 657-67.
11. Athale N, Aldridge A, Malcarne VL, Nakaji M, Samady W, Robins SG. Validity of the multidimensional health locus of control scales in american sign language. J Health Psychol 2010; 15(7): 1064-74.
12. Lundgren S, Eurenius E, Olausson A, Opava CH. The swedish version of the multidimensional health locus of control scales, form C. Aspects of reliability and validity in patients with rheumatoid arthritis. Adv Physiother 2007; 9(1): 16-22.
13. Wrightson KJ, Wardle J. Cultural variation in health locus of control. Ethn Health 1997; 2(1-2): 13-20.
14. Moshki M, Ghofranipour F, Hajizadeh E, Azadfallah P. Validity and reliability of the multidimensional health locus of control scale for college students. BMC Public Health 2007; 7: 295.
15. De Las Cuevas C, Penate W, Betancort M, Cabrera C. What do psychiatric patients believe regarding where control over their illness lies? Validation of the multidimensional health locus of control scale in psychiatric outpatient care. J Nerv Ment Dis 2015; 203(2): 81-6.
16. Konkoly Thege B, Rafael B, Rohanszky M. Psychometric properties of the multidimensional health locus of control scale form C in a non-Western culture. PLoS One 2014; 9(9): e107108.
17. Pereira LS, Araujo LG, Sampaio RF, Haddad JP. Factorial analysis of the Multidimensional Health Locus of Control Scale-Form C for elderly. Rev Bras Fisioter 2011; 15(5): 363-70.
18. Afifi M. Health locus of control and depressive symptoms among adolescents in Alexandria, Egypt. East Mediterr Health J 2007; 13(5): 1043-52.
19. Kuwahara A, Nishino Y, Ohkubo T, Tsuji I, Hisamichi S, Hosokawa T. Reliability and validity of the multidimensional health locus of control Scale in Japan: Relationship with demographic factors and health-related behavior. Tohoku J Exp Med 2004; 203(1): 37-45.
20. Egan JT, Leonardson G, Best LG, Welty T, Calhoun D, Beals J. Multidimensional health locus of control in American Indians: The strong heart study. Ethn Dis 2009; 19(3): 338-44.
21. Aghamolaei T, Tavafian S, Ghanbarnejad A. Health locus of control and its relation with health-promoting behaviors among people over 15 in Bandar Abbas, Iran. J Health Adm 2014; 17(55): 7-16. [In Persian].
22. Astrom AN, Blay D. Multidimensional health locus of control scales: Applicability among Ghanaian adolescents. East Afr Med J 2002; 79(3): 128-33.
23. Cheung GW, Rensvold RB. Evaluating goodness-of-fit indexes for testing measurement invariance. Struct Equ Modeling 2002; 9(2): 233-55.
24. Drasgow F, Kanfer R. Equivalence of psychological measurement in heterogeneous populations. J Appl Psychol 1985; 70(4): 662-80.
25. Vandenberg RJ, Lance CE. A review and synthesis of the measurement invariance literature: Suggestions, practices, and recommendations for organizational research. Organ Res Methods 2000; 3(1): 4-70.
26. O'Looney BA, Barrett PT. A psychometric investigation of the multidimensional health locus of control questionnaire. Br J Clin Psychol 1983; 22 (Pt 3): 217-8.
27. Sura M. Selected findings of national population and housing census, 2011 [Online]. [cited 2011]; Available from: URL: https://www.amar.org.ir/Portals/1/Iran/90.pdf 28. World Medical Association (WMA). WMA
[Online]. [cited 2014]; Available from: URL: https://www.wma.net/policies-post/wma- declaration-of-helsinki-ethical-principles-for-medical-research-involving-human-subjects 29. Brown TA. Confirmatory factor analysis for
applied research. New York, NY: Guilford Publications; 2015.
30. Bazargan A, Sarmad Z, Hejazi E. Research methods in behavioral sciences. Tehran, Iran: Agah Publications; 1998. [In Persian]. 31. Bentler PM. Comparative fit indexes in
structural models. Psychol Bull 1990; 107(2): 238-46.
32. Bentler PM, Wu EJ. EQS 6.1 for windows; Users guideline. Encino, CA: Multivariate Software; 2005.
33. Kline RB. Principles and practice of structural equation modeling, third edition (methodology in the social sciences). New York, NY: Guilford Publications; 2015. 34. Stevens JP. Applied multivariate statistics for
the social sciences. 5th ed. London, UK: Routledge; 2012.
35. Merkle EC, You D, Preacher KJ. Testing nonnested structural equation models. Psychol Methods 2016; 21(2): 151-63. 36. Bollen KA. Structural equations with latent
variables. New York, NY: John Wiley & Sons; 2014.
37. Byrne BM, Shavelson RJ, Bengt M. Testing for the equivalence of factor covariance and mean structures: The issue of partial measurement invariance. Psychol Bull 1989; 105(3): 456-66.
38. Mardia KV. Measures of multivariate skewness and kurtosis with applications.
Biometrika 1970; 57(3): 519-30.
39. Satorra A, Bentler PM. A scaled difference chi-square test statistic for moment structure analysis. Psychometrika 2001; 66(4): 507-14. 40. Cooper D, Fraboni M. Toward a more valid
and reliable health locus of control scale. J Clin Psychol 1988; 44(4): 536-40.
41. Otto C, Bischof G, Rumpf HJ, Meyer C, Hapke U, John U. Multiple dimensions of health locus of control in a representative population sample: Ordinal factor analysis and cross-validation of an existing three and a new four factor model. BMC Med Res Methodol 2011; 11: 114.
42. Hashemian M, Aminshokravi F, Hidarnia A, Lamyian M, Hassanpour K, Akaberi A, et al. Farsi version of the multidimensional health locus of control and God locus of health control scales: Validity and reliability study among Iranian women with a family history of breast cancer. J Pak Med Assoc 2014; 64(9): 1057-62.
43. Marshall GN, Collins BE, Crooks VC. A comparison of two multidimensional health locus of control instruments. J Pers Assess 1990; 54(1-2): 181-90.
44. Rodriguez-Rosero JE, Ferriani M, Dela Coleta MF. Multidimensional health locus of control scale - MHLC: Validation study. Rev Lat Am Enfermagem 2002; 10(2): 179-84. 45. Casey TA, Kingery PM, Bowden RG,