O R I G I N A L R E S E A R C H
Open Access
Evaluation of data-driven respiratory gating
waveforms for clinical PET imaging
Matthew D. Walker
1*, Andrew J. Morgan
1, Kevin M. Bradley
2and Daniel R. McGowan
1,3Abstract
Background:We aimed to evaluate the clinical robustness of a commercially developed data-driven respiratory gating algorithm based on principal component analysis, for use in routine PET imaging.
Methods:One hundred fifty-seven adult FDG PET examinations comprising a total of 1149 acquired bed positions were used for the assessment. These data are representative of FDG scans currently performed at our institution. Data were acquired for 4 min/bed position (3 min/bed for legs). The data-driven gating (DDG) algorithm was applied to each bed position, including those where minimal respiratory motion was expected. The algorithm provided a
signal-to-noise measure of respiratory-like frequencies within the data, denoted asR. Qualitative evaluation was performed by
visual examination of the waveforms, with each waveform scored on a 3-point scale by two readers and then averaged
(scoreSof 0 = no respiratory signal, 1 = some respiratory-like signal but indeterminate, 2 = acceptable signal
considered to be respiratory). Images were reconstructed using quiescent period gating and compared with
non-gated images reconstructed with a matched number of coincidences. If present, the SUVmaxof a well-defined lesion in
the thorax or abdomen was measured and compared between the two reconstructions.
Results:There was a strong (r= 0.86) and significant correlation betweenRand scoresS. Eighty-six percent of
waveforms withR≥15 were scored as acceptable for respiratory gating. On average, there were 1.2 bed positions per
patient examination withR≥15. Waveforms with highRandSwere found to originate from bed positions
corresponding to the thorax and abdomen: 90% of waveforms withR≥15 had bed centres in the range 5.6 cm
superior to 27 cm inferior from the dome of the liver. For regions where respiratory motion was expected to be
minimal,Rtended to be < 6 andStended to be 0. The use of DDG significantly increased the SUVmaxof focal lesions,
by an average of 11% when considering lesions in bed positions withR≥15.
Conclusions:The majority of waveforms with highRcorresponded to the part of the patient where respiratory motion was expected. The waveforms were deemed suitable for respiratory gating when assessed visually, and when used
were found to increase SUVmaxin focal lesions.
Keywords:PET/CT, Motion, Respiratory gating, Data-driven gating, Imaging
Background
Respiratory motion during PET data acquisition is un-avoidable and often degrades clinical image quality. Fea-tures within the abdomen and thorax are generally blurred in the cranio-caudal direction when respiratory motion is left unaccounted for in the PET image recon-struction. A range of image artefacts can also occur. These are mostly due to a mismatch between the CT at-tenuation correction image, which is typically a snapshot
at a single phase of respiration, and the PET image which typically represents an average over the whole re-spiratory cycle [1–3].
Many approaches have been demonstrated to mitigate the degrading effects of respiratory motion in PET-CT. For both the PET and CT modalities, methods fall into one of two categories. The first of these is instructed breathing, such as breath hold or repeated breath hold techniques. The second category is tracking of the re-spiratory phase, sometimes with gated exposure (for CT), and with compensated image processing (e.g. re-spiratory gated image reconstruction). The short
* Correspondence:[email protected]
1Radiation Physics and Protection, Churchill Hospital, Oxford University
Hospitals NHS Foundation Trust, Oxford OX3 7LE, UK
Full list of author information is available at the end of the article
exposure time (seconds) required in CT makes breath hold techniques compatible with this modality, and they are frequently used clinically. Repeated breath-hold PET has been performed [4, 5] but is not common, due to the much longer duration (minutes) required for PET data acquisition. Tracking the respiratory cycle by means of an external system, such as a pressure belt or a cam-era, is commonly performed for both CT and PET. Commercial products that interface with the PET-CT scanner include the respiratory gating system AZ-733VI (Anzai Medical; Tokyo, Japan) and the Real-time Pos-ition Management™ (RPM) Respiratory Gating system (Varian Medical Systems; CA, USA). While these exter-nal systems do provide respiratory gating solutions, they also require time to set up on the patient and occasion-ally do not yield a useful gating waveform [6]. Rather than using an external system to track the respiratory cycle, it is also possible to extract a respiratory signal from the PET data itself in what is known as data-driven gating (DDG). The periodic motion of the radioactivity within the patient, attributable to respiration, can be ex-tracted from either the PET raw data (e.g. from a time series of short-duration sinograms [7]) or from PET ages (e.g. from a time series of short-duration PET im-ages [8]). In both cases, the duration must be a small fraction of the respiratory period, e.g. 0.5 s. Data-driven gating has several potential advantages as compared to tracking the respiratory cycle using an external system. DDG is based on the motion of the radioactivity within the patient and hence directly linked to the respiratory motion of organs and tumours. External devices generally track the position of the chest wall and assume that or-gans of interest move synchronous to this. In fact, oror-gans and lesions within the body can exhibit respiratory mo-tions that are phase-shifted compared to the chest wall motion [9]. There is no set-up time involved for DDG, as no external system or tool is attached to the patient. The DDG waveforms are inherently time-synchronised to the scanner without the possibility of a time offset, which could otherwise prevent robust gating. The clinical impact and feasibility of using DDG have been investigated by Kesner et al. [10]. Until now, however, commercial data-driven respiratory gating solutions have not been widely available.
In this study, we evaluated respiratory waveforms gen-erated by a DDG algorithm which has been commer-cially developed by GE Healthcare (Waukesha, WI, USA), marketed with the name MotionFree, and which has the 510(k) approval for use in the USA. The algo-rithm applies principal component analysis to a time series of down-sampled sinograms, with one of these components then selected and assumed to capture the period of the respiratory motion. The variation of the weighting factor for this component over time provides
a respiratory waveform similar to that provided by the external respiratory gating equipment. The method has been recently validated in phantom studies, and several patient examples have been presented [11, 12]. The commercial implementation is built on the work of Thielmans et al. [7,13,14]. A preliminary version of this work has been presented previously [15].
Methods Study design
This evaluation of the prototype DDG algorithm focused on several technical aspects of the respiratory gating to allow practical implementation in routine clinical use. The first part of the evaluation concerned the quality of the respiratory waveforms generated by the algorithm, as assessed on 157 FDG PET-CT scans and in an experi-ment using a moving phantom. The algorithm generates its own metric of waveform quality (based on a signal-to-noise ratio and denoted as R). We first con-firmed, using the phantom data, how R increases when the amplitude of the respiratory motion applied to the phantom increases. Following this, the DDG waveform from each bed position of the 157 patient examinations was visually examined and scored. These scores were compared to the algorithm’s own metric. The variation of these scores with the location of the PET bed pos-ition, i.e. the patient’s body part, was investigated.
The next step in the evaluation was an assessment of the magnitude of changes in SUVmax values for well-defined lesions in the thorax or abdomen. Recon-struction was performed using quiescent period gating (retaining 50% of coincidences) [16] and compared to re-construction without respiratory gating.
Phantom data
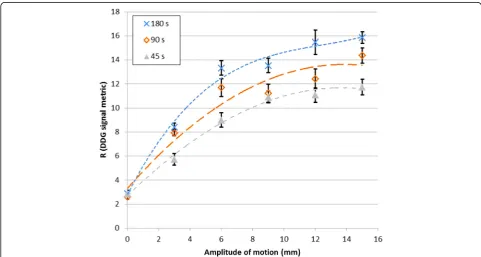
Data were acquired from a moving phantom and proc-essed using the DDG algorithm. The phantom setup consisted of a foam phantom containing five small68Ge spheres (the VQC-068 phantom; Eckert & Ziegler; Val-encia, CA, USA), each with an activity of 13 kBq. This phantom was placed on the QUASAR™ respiratory mo-tion platform (Modus QA; London, ON, Canada) that performed periodic motions in the Z direction, using a driving waveform that was typical for normal respiration (named Typical1, supplied by the manufacturer). A cy-lindrical, uniform68Ge phantom (20 cm diameter, 19 cm height, activity concentration of 0.2 kBq/mL) was placed on the scanner couch, adjacent to the platform to pro-vide a source of activity outside the scanner’s coinci-dence field-of-view. This setup was chosen to represent the case of imaging lesions within the lung. Data were acquired with the platform driving the phantom with a range of amplitudes (0–15 mm, corresponding to max-imum displacements of 0–30 mm). There were three re-peated acquisitions at each amplitude. Each acquisition was at the same bed position and was 180 s in duration. Each acquisition was processed with the full 180-s dur-ation, and also after being split into two frames of 90 s and four frames of 45 s. This provided between 3 and 12
Rvalues at each amplitude for the given frame duration, from which the mean and standard deviations were found. The standard error on the mean was calculated as the standard deviation divided by √n, where n equalled 3 for 180 s, 6 for 90 s and 12 for 45 s.
Patient data
One hundred fifty-seven sets of adult [18F]FDG PET ex-aminations comprising a total of 1149 acquired bed po-sitions were used to evaluate the performance of the data-driven gating algorithm. These scans were acquired on 20 different days in December 2017 and January 2018, randomly chosen and are representative of [18F]FDG scans currently performed at our institution. Patients fasted for more than 6 h prior to i.v. administra-tion of 4 MBq/kg [18F]FDG. The uptake period was 90 min. The PET-CT examination commenced with a free-breathing helical CT, followed by free-breathing PET with 4 min/bed position (3 min/bed for legs). The PET-CT scanner used was a Discovery 710 (GE Health-care; Waukesha, WI, USA). This is a fully 3D PET-CT scanner incorporating a time-of-flight technology with LYSO-based scintillation detectors [17].
DDG waveform generation and assessment
The data-driven gating algorithm [13] was applied to each bed position, including those where minimal re-spiratory motion was expected. The algorithm performs principal component analysis on a time series of
sinograms to identify the particular sinogram elements that change during the scan. The weighting factor for each principal component describes how that compo-nent changes with time and may capture the phase and period of respiratory motion. The algorithm first bins listmode data into a set of down-sampled sinograms. Each sinogram in this set is 0.5 s in duration and sampled in its radial and angular components. No down-sampling is applied in the axial components to retain maximum spatial resolution in the direction most com-monly associated with changes caused by respiratory motion. Time-of-flight information is discarded in this implementation. There is then a correction for low-frequency shifts in the total counts, to account for changes that are not due to respiration (e.g. those from radiotracer redistribution). The sinograms are then masked using a threshold to remove those parts of the sinogram that are considered to be outside the patient. PCA is then applied, and the first three principal com-ponents assessed for the strength of the respiratory sig-nal that they contain. This assessment is performed using a signal-to-noise measure of respiratory-like fre-quencies within the data, denoted asR, derived from the power spectrum of the transformed dataset. The max-imum value of the Fourier transform of the eigenvector’s weight function within the frequency range for respir-ation (0.1–0.4 Hz) is divided by its mean value for fre-quencies above this range (0.4–1.0 Hz). From these three ratios (respiratory maximum/mean noise), the largest one is chosen and defined asR. The corresponding prin-cipal component becomes the respiratory prinprin-cipal com-ponent, with the respiratory waveform extracted using its eigenvector. The respiratory waveform is thus created from this weighting factor, up-sampled to 0.25-s inter-vals using linear interpolation.
For each waveform, a qualitative evaluation was also performed. Each auto-scaled waveform was reviewed by two clinical scientists (medical physicists) blinded to the
Rvalue and scored on a 3-point scale assessing its suit-ability for clinical use (scoreSof 0 = no respiratory sig-nal, 1 = some respiratory-like signal but indeterminate, 2 = acceptable signal considered to be respiratory). The scores from the two readers were averaged. The axial lo-cation of the centre of each bed position, and hence each corresponding R and S values, was determined relative to the reference location at the most superior point of the liver as determined from the CT image.
The data were analysed by linear regression of the re-duced duration R values with those from the reference time of 4 min (240 s). The slope of the linear fit (inter-cept fixed at 0) was used as a measure of the systematic change in R with duration. The mean values of R were also calculated, considering only bed positions with R≥ 15 as found with the full 240-s bed duration.
Assessment of DDG-reconstructed images
PET images were reconstructed using DDG-triggered quiescent period gating (QPG), retaining 50% of coinci-dences [16]. Images were also reconstructed without gat-ing, using data from the first 2 min of each bed position, such that the number of coincidences used for image re-construction was matched to that used for the gated image. A non-gated image was also reconstructed using the full 4 min of data at each bed position. The recon-struction algorithm was the manufacturer’s Bayesian penalised likelihood reconstruction (Q.Clear) with a beta value of 400 [18].
The three [18F]FDG PET-CT images for each patient were reviewed by a clinical scientist (medical physicist) and screened for the presence of a focal, avid lesion in the upper abdomen or thorax (including the rib cage). When multiple lesions were present, the most focal was chosen for analysis. The SUVmax from the lesion was measured on each PET image. The axial location of the lesion was also recorded to allow the R value for this
lesion to be identified from its bed position. In the case of a lesion being identified in the overlap region of two bed positions, the assigned values of R were calculated as the sensitivity-weighted average of the two values. This allowed exploration of the relationships between the lesion locations, R values and changes in SUVmax due to the application of DDG.
Results
The phantom experiment confirmed that increasing the amplitude of respiratory-like motion led to an increase in R. The data also demonstrated a reduction in R for shorter acquisition durations. These results are pre-sented in Fig.1.
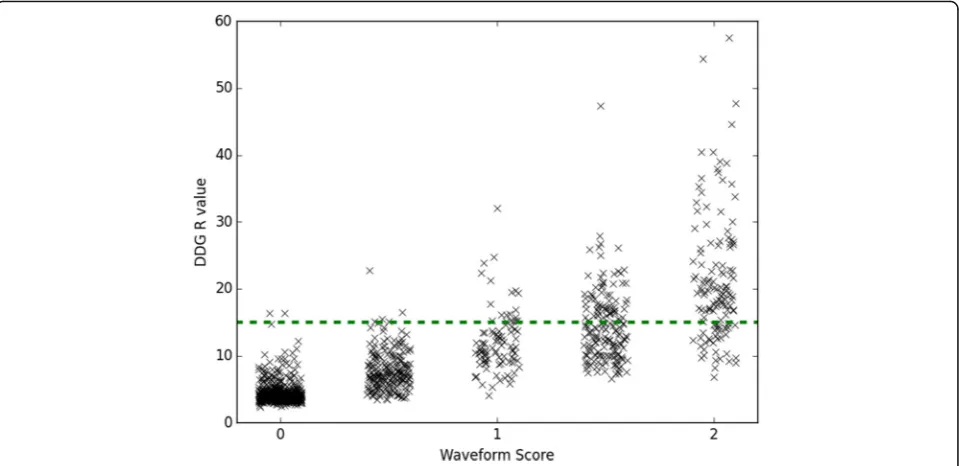
From the patient data with 1149 bed positions, there was a strong (r= 0.86) and statistically significant (Wald test, p< 0.001) positive correlation between the natural logarithm of the algorithm’s figure of merit for the wave-form, log(R) and the scoreSassigned from visual inspec-tion. The distribution ofRvalues for different scoresSis shown in Fig.2, where the good agreement between the two measures can be observed. There were 2 cases (out of 1149; 0.2%) where S equalled 0 while R was greater than 15. There were 35 bed positions (3%) where wave-forms were scored as 2 whileRwas less than 15. Exam-ples of waveforms for a range of scores S and Rvalues are provided in Fig.3.
For a practical clinical implementation, one could set a threshold on theRvalue, above which respiratory gating is applied. As the chosen threshold is increased, the number of bed positions withRexceeding the threshold reduces. This is demonstrated in Fig. 4a, which also shows that there was an average of 1.2 bed positions per patient examination that had an R value exceeding the default threshold of 15. Figure 4b shows that as the R value threshold increases, a higher proportion of wave-forms is scored as visually acceptable. Of the 191 bed positions withRgreater than the threshold of 15, 164 of them (86%) were scored as acceptable for respiratory gating (S≥1.5).
Waveforms with highR and Swere found to originate from bed positions corresponding to the thorax and abdo-men: 90% of waveforms withR≥15 had bed centres in the range 5.6 cm superior to 27 cm inferior from the dome of the liver. Using the eyes as an alternative reference point, this corresponded to 26–57 cm inferior of eye level. This is presented in Fig. 5. For regions where respiratory mo-tion was expected to be minimal such as the head and legs,Rtended to be < 6 andStended to be 0.
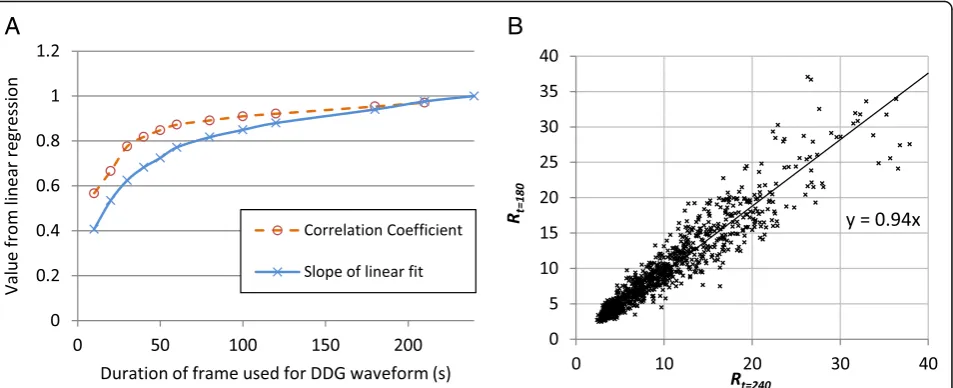
Analysis of the waveforms generated using reduced acquisition durations demonstrated that R is systemat-ically lower for shorter acquisitions. This dependence of R on the acquisition duration is shown in Fig. 6a, Fig. 2Relationship between the algorithm’s figure of merit for the waveform (theRvalue) and the waveform scoreSas determined by two readers from visual inspection of the waveform. The horizontal dashed line shows a threshold,R= 15
where the slope from a linear regression (Rt= 240 vs
Rt) is plotted for the various acquisition durations t.
Pearson’s correlation coefficient is also displayed. A comparison of Rt= 180 and Rt = 240 is presented in Fig. 6b. Mean R values for waveforms with high R (Rt = 240≥15) are provided in Table 1 and confirm a sys-tematic dependence, which led to substantial reduc-tions in R for short durations and which was statistically significant for all the durations tested.
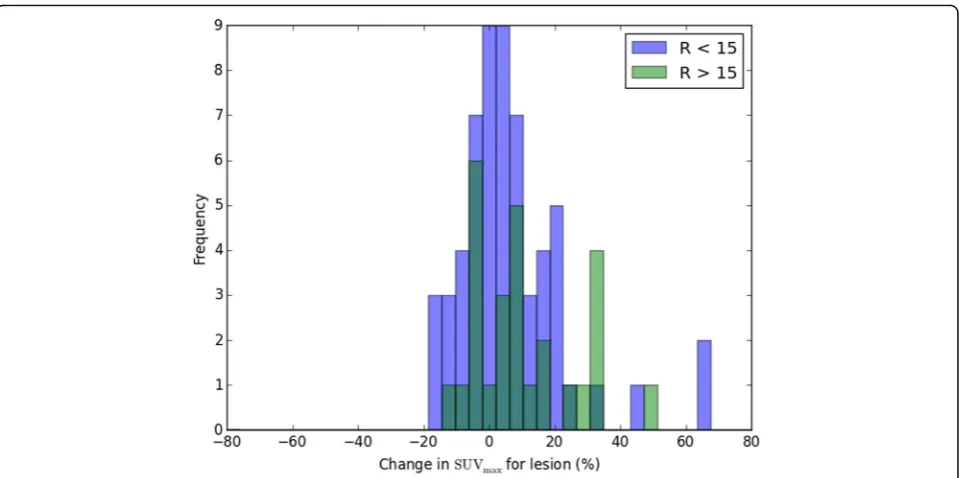
Of the 157 examinations in this study, a focal lesion in the thorax or abdomen was found in 86 cases (with any
Rvalue). Application of data-driven QPG was found, on average, to increase the lesion’s SUVmax in comparison to non-gated images with a matched number of coinci-dences (p< 0.001; paired t test). In many cases, the change (either increase or decrease) was small and ex-pected to be clinically insignificant. In other cases, there was a substantial increase that could be clinically Fig. 4aNumber of bed positions per patient withRgreater than a set threshold, shown forRvalue thresholds between 1 and 20.bTotal number of bed positions withRgreater than theRvalue threshold, split by the scoreSassigned to the waveform from visual inspection of all bed positions in 157 examinations. Shown forRvalue thresholds between 1 and 20. For data in both figures, the acquisition duration per bed position was 240 s (4 min)
significant. When only lesions with a corresponding R value greater than or equal to 15 were considered, the mean increase was 11%. Considering only those lesions withRt= 240< 15, the mean increase was 6%. For all lesions regardless of theRvalue, the mean increase was 8%. The distribution of this change is presented as a histogram in Fig. 7. There was a small difference in SUVmaxbetween the two sets of ungated images; those reconstructed from 2 min of data were, on average, 3% higher than those re-constructed from the full 4 min (p= 0.003; pairedttest).
Discussion
Several technical and practical aspects relating to a com-mercial implementation of data-driven gating have been evaluated. The algorithm’s figure of merit for the respira-tory waveform signal, R, was found to be highly corre-lated with our assessments based on visual inspection. The phantom study confirmed thatRincreased with lar-ger motion amplitudes. We also verified that R tended to be substantially higher when scanning a part of the patient where large respiratory motion was expected. These results support the use of anRvalue threshold to determine whether or not QPG should be applied.
The practicalities of such an approach led to several other questions that we addressed, including how R de-pends on the acquisition duration. This is of particular importance when considering live DDG, where an R
value is determined part way through a bed position (typ-ically around the completion time of the standard bed duration), with a decision then made based on theRvalue as to whether the acquisition should be automatically ex-tended. QPG may then be applied while ensuring that the gated images have a sufficient number of counts. While this may be a seamless approach to the management of re-spiratory motion, theRvalue threshold needs to be chosen with care. It may be possible to devise improved measures of the suitability of DDG waveforms for respiratory gating, as well as the benefit that may be expected from applying such gating. Different metrics which have some similarity toRhave been used in the evaluation of other DDG algo-rithms [19,20]. The phantom study confirmed that larger motion amplitudes do lead to higher R values but also showed that the increase was not linear. When automating the decision of whether or not to apply DDG, it may be beneficial to assess both the motion amplitude alongside the validity of the DDG waveform. The Rmetric as cur-rently implemented is sensitive to both, but is primarily designed as an indicator of the waveform validity, and is not a direct measure of the respiratory motion amplitude.
Another practical issue is that of patient throughput, which will be directly influenced by the choice of thresh-old in the case of live DDG. When all bed positions are screened for motion, we found an average of 1.2 bed po-sitions per patient with Rt= 240≥15. It is hence possible
A
B
Fig. 6aResults from linear regression, comparingRcalculated from a 240-s duration acquisition toRfound for the firsttseconds of the acquisition.bExample regression, showingRt= 180compared toRt= 240
Table 1MeanRvalues from all bed positions that satisfied the conditionRt= 240≥15
Scan duration (s) 10 20 30 40 50 60 80 100 120 180 210 240 MeanR
[forRt= 240≥15]
7.8 10.6 12.8 14.3 15.2 16.3 17.3 18.2 18.7 20.1 21.0 21.7
to calculate the expected additional scanning time needed when moving from a workflow without respira-tory gating to one where live DDG is applied. On the other hand, if the current workflow made use of an ex-ternal gating system and extended acquisition durations for 2 fixed bed positions, changing to live DDG may re-sult in increased throughput.
The commercial release of a data-driven gating solu-tion for respiratory mosolu-tion represents an important step forward for the field. The development builds on many important contributions from various groups. The core component of all DDG algorithms is the method used to identify and thus extract a respiratory signal from the data. The intuitive image-based method tested by Bundschuh et al. [8] was to position a volume of interest (VOI) over the lesion and to then calculate thez -coord-inate of the VOI’s centre of mass for each short time frame. The method was found to yield usable data for DDG, but it relies on a manual VOI definition and also requires the often time-consuming reconstruction of many image frames. An automated image-based method was developed by Kesner et al. [20], whose algorithm se-lectively incorporates image voxels to build a high-quality respiratory signal from their combined time-activity curves. Approaches based on the raw coin-cidence (sinogram) data, with no requirement for a dy-namic image reconstruction, include the geometric sensitivity method [21] that utilises the fact that 3D PET scanners exhibit large variations in sensitivity with axial position. Periodic fluctuations in the coincidence count-ing rates may then be attributed to respiratory motion.
This method was later developed further and compared to the waveform provided by the change in the axial centre of mass of the true coincidences [22]. The inclusion of time-of-flight information, as well as consideration of mo-tion in other direcmo-tions (e.g. anterior-posterior), was used in the centroid of the distribution algorithm recently eval-uated by Ren et al. [23]. Kesner and Kuntner [24] devel-oped a more complex, automated DDG algorithm that extracts data from selected pixels within the filtered pro-jection data. Their algorithm combines several aspects of the aforementioned image-based works, incorporating only those sinogram pixels (projection bins) whose inclu-sion increases the standard deviation of the waveform as it is generated. On the other hand, the algorithm of Schleyer et al. uses spectral analysis to ascertain which sinogram pixels should be considered useful in the generation of the respiratory waveform [25]. Like the algorithm of Kesner and Kuntner [24], the automatic PCA-based DDG algo-rithm tested in this work involves extraction of a wave-form from raw sinogram data with high temporal resolution but reduced spatial resolution [13]. Selection of appropriate pixels is however performed via principal component analysis. The temporal variations of the princi-pal component weighting factors are then examined, and the component with the strongest respiratory frequency is retained. The variation of this component’s weighting fac-tor with time is used as the DDG waveform.
scanner’s FOV. It is expected thatR, and also the most ap-propriateRvalue threshold, depends to some degree on a variety of other factors in addition to the magnitude of the respiratory motion. These include the radioactivity distri-bution within the patient as well as the part of the patient currently being imaged. We do not recommend choosing an R value threshold based solely on the results of the phantom experiment shown in Fig.1. CalculatedRvalues could potentially be modulated by a number of factors in-cluding those that change the statistical quality of the data.
Ris hence expected to change not just with the region be-ing imaged and scan duration but also the injected activ-ity, uptake period, patient habitus, and especially if a different radiotracer is used. The appropriate threshold may hence be scanner and protocol dependent.
The current evaluation did not include a comprehen-sive clinical evaluation of the gated images nor was a comparison attempted against waveforms from an exter-nal device. Our data did however confirm that applica-tion of DDG led to an increased SUVmax, on average. The observed increase due to respiratory gating was both expected and similar to that reported by others [26]. A comparison against the RPM device was made previously using anthropomorphic phantom data, for which the true driving waveform was known [12]. Al-though the similarities between waveforms from the PCA-DDG algorithm and the RPM system have been presented for several patients [7, 13], the benefit from such a comparison is limited by the lack of a gold stand-ard. The reasonable agreement observed is reassuring, but it is difficult to ascertain the superiority of either method. There is a similar limitation in the current work, where neither the R value nor the score S from visual inspection can be considered as a gold standard for determining the validity of the waveform and its crespondence to the respiratory motion of internal or-gans. We anticipate that these important questions will be addressed by the results of a large, ongoing clinical study including detailed clinical evaluations.
Conclusions
For the PCA-based DDG algorithm, the majority of waveforms with highR corresponded to the part of the patient where respiratory motion was expected, and the waveforms were deemed suitable for respiratory gating when assessed visually. Application of DDG was found to significantly increase the SUVmax of focal lesions by mitigating the blurring effects of respiratory motion.
Abbreviations
DDG:Data-driven gating; PCA: Principal component analysis; QPG: Quiescent period gating; RPM: Real-time Position Management™system; SUV: Standard uptake value
Acknowledgements
The authors thank Rob Johnsen and Scott Wollenweber for their assistance with DDG processing and for discussion on the implementation and performance of the MotionFree data-driven gating algorithm.
Funding
DM is funded by a National Institute for Health Research (NIHR) / Health Education England (HEE) Clinical Lectureship (ICA-CL-2016-02-009). This paper presents independent research funded by the NIHR and HEE. The views expressed are those of the authors and not necessarily those of the NHS, the NIHR, HEE or the Department of Health.
Availability of data and materials
The analysed data may be available from the corresponding author on reasonable request and with the permission Oxford University Hospitals NHS Foundation Trust.
Authors’contributions
MW contributed to the study design and data acquisition; performed the data processing, analysis and interpretation; and drafted the manuscript. AM contributed to the data processing and manuscript revision. KB contributed to the data interpretation and manuscript revision. DM contributed to the study design, data interpretation and manuscript revision. All authors read and approved the final manuscript.
Ethics approval and consent to participate
Ethics approval was not required by our institution for the anonymous, retrospective use of patient data for optimisation of imaging procedures.
Consent for publication Not applicable.
Competing interests
Oxford University Hospitals NHS Foundation Trust has a research contract with GE Healthcare covering loan of equipment.
Publisher’s Note
Springer Nature remains neutral with regard to jurisdictional claims in published maps and institutional affiliations.
Author details
1Radiation Physics and Protection, Churchill Hospital, Oxford University
Hospitals NHS Foundation Trust, Oxford OX3 7LE, UK.2Department of Radiology, Churchill Hospital, Oxford University Hospitals NHS Foundation Trust, Oxford, UK.3Department of Oncology, Old Road Campus Research Building, University of Oxford, Oxford, UK.
Received: 17 October 2018 Accepted: 18 December 2018
References
1. Nehmeh SA, Erdi YE. Respiratory motion in positron emission tomography/computed tomography: a review. Semin Nucl Med. 2008; 38:167–76.
2. Pépin A, Daouk J, Bailly P, Hapdey S, Meyer M-E. Management of respiratory motion in PET/computed tomography: the state of the art. Nucl Med Commun. 2014;35:113–22.
3. Osman MM, Cohade C, Nakamoto Y, Wahl RL. Respiratory motion artifacts on PET emission images obtained using CT attenuation correction on PET-CT. Eur J Nucl Med Mol Imaging. 2003;30:603–6.
4. Meirelles GSP, Erdi YE, Nehmeh SA, Squire OD, Larson SM, Humm JL, et al. Deep-inspiration breath-hold PET/CT: clinical findings with a new technique for detection and characterization of thoracic lesions. J Nucl Med Off Publ Soc Nucl Med. 2007;48:712–9.
5. Nehmeh SA, Erdi YE, Meirelles GSP, Squire O, Larson SM, Humm JL, et al. Deep-inspiration breath-hold PET/CT of the thorax. J Nucl Med Off Publ Soc Nucl Med. 2007;48:22–6.
7. Thielemans K, Schleyer P, Marsden PK, Manjeshwar RM, Wollenweber SD, Ganin A. Comparison of different methods for data-driven respiratory gating of PET data. 2013 IEEE Nuclear Science Symposium and Medical Imaging Conference (2013 NSS/MIC). Seoul: IEEE; 2013. p. 1–4.https://doi.org/10. 1109/NSSMIC.2013.6829055.
8. Bundschuh RA, Martínez-Moeller A, Essler M, Martínez M-J, Nekolla SG, Ziegler SI, et al. Postacquisition detection of tumor motion in the lung and upper abdomen using list-mode PET data: a feasibility study. J Nucl Med. 2007;48:758–63.
9. Rietzel E, Chen GTY, Choi NC, Willet CG. Four-dimensional image-based treatment planning: target volume segmentation and dose calculation in the presence of respiratory motion. Int J Radiat Oncol Biol Phys. 2005;61:1535–50. 10. Kesner AL, Chung JH, Lind KE, Kwak JJ, Lynch D, Burckhardt D, et al.
Validation of software gating: a practical technology for respiratory motion correction in PET. Radiology. 2016;281:239–48.
11. Morley NCD, McGowan DR, Gleeson FV, Bradley KM. Software respiratory gating of positron emission tomography-computed tomography improves pulmonary nodule detection. Am J Respir Crit Care Med. 2017;195:261–2. 12. Walker MD, Bradley KM, McGowan DR. Evaluation of principal component
analysis-based data-driven respiratory gating for positron emission tomography. Br J Radiol. 2018;91:20170793.
13. Thielemans K, Rathore S, Engbrant F, Razifar P. Device-less gating for PET/CT using PCA. 2011 IEEE Nuclear Science Symposium Conference Record. Valencia: IEEE; 2011. p. 3904–10.https://doi.org/10.1109/NSSMIC.2011. 6153742.
14. Bertolli O, Arridge S, Wollenweber SD, Stearns CW, Hutton BF, Thielemans K. Sign determination methods for the respiratory signal in data-driven PET gating. Phys Med Biol. 2017;62:3204–20.
15. Walker MD, Morgan AJ, McGowan DR. Evaluation of novel data driven respiratory gating waveforms. Eur J Nucl Med Mol Imaging. 2018;45(1):S716. 16. Liu C, Alessio A, Pierce L, Thielemans K, Wollenweber S, Ganin A, et al.
Quiescent period respiratory gating for PET/CT. Med Phys. 2010;37:5037–43. 17. Bettinardi V, Presotto L, Rapisarda E, Picchio M, Gianolli L, Gilardi MC.
Physical performance of the new hybrid PET∕CT Discovery-690. Med Phys. 2011;38:5394–411.
18. Teoh EJ, McGowan DR, Macpherson RE, Bradley KM, Phantom GFV. Clinical evaluation of the Bayesian penalized likelihood reconstruction algorithm Q. Clear on an LYSO PET/CT system. J Nucl Med. 2015;56:1447–52.
19. Büther F, Ernst I, Frohwein LJ, Pouw J, Schäfers KP, Stegger L. Data-driven gating in PET: influence of respiratory signal noise on motion resolution. Med Phys. 2018;45:3205–13.
20. Kesner AL, Bundschuh RA, Detorie NC, Dahlbom M, Ziegler SI, Czernin J, et al. Respiratory gated PET derived in a fully automated manner from raw PET data. IEEE Trans Nucl Sci. 2009;56:677–86.
21. He J, O’Keefe GJ, Gong SJ, Jones G, Saunder T, Scott AM, et al. A novel method for respiratory motion gated with geometric sensitivity of the scanner in 3D PET. IEEE Trans Nucl Sci. 2008;55:2557–65.
22. Büther F, Dawood M, Stegger L, Wübbeling F, Schäfers M, Schober O, et al. List mode-driven cardiac and respiratory gating in PET. J Nucl Med. 2009;50: 674–81.
23. Ren S, Jin X, Chan C, Jian Y, Mulnix T, Liu C, et al. Data-driven event-by-event respiratory motion correction using TOF PET list-mode centroid of distribution. Phys Med Biol. 2017;62:4741–55.
24. Kesner AL, Kuntner C. A new fast and fully automated software based algorithm for extracting respiratory signal from raw PET data and its comparison to other methods. Med Phys. 2010;37:5550–9.
25. Schleyer PJ, O’Doherty MJ, Marsden PK. Extension of a data-driven gating technique to 3D whole body PET studies. Phys Med Biol. 2011;56:3953–65. 26. Büther F, Vehren T, Schäfers KP, Schäfers M. Impact of data-driven