R E S E A R C H A R T I C L E
Open Access
Development and validation of an
improved HPLC-UV method for
simultaneous determination of lamotrigine
and oxcarbazepine and its active
metabolite
10,11-dihydro-10-hydroxycarbazepine in human blood
plasma and comparison with an
UHPLC-MS/MS method
Siyao Jin
1,2†, Qing Zhao
1,2†, Dongjie Zhang
1, Zhigang Zhao
1,2and Shenghui Mei
1,2*Abstract
Lamotrigine (LTG) and oxcarbazepine (OXC) are first-line drugs for epilepsy treatment. Their large pharmacokinetics variabilities and relations between efficacy and toxicity and blood plasma concentration require routine monitoring for dose adjustment. In this study, we developed and validated a simple, accurate, and reliable method for
simultaneous determination of LTG, OXC and 10,11-dihydro-10-hydroxycarbazepine (MHD) in human blood plasma by high-performance liquid chromatography-ultraviolet detection (HPLC-UV) with a simple one-step protein precipitation using methanol (1% acetic acid) and 15 min elution time under isocratic elution at 1 mL/min. Calibration range was 2.4 to 120 mg/L for LTG, OXC, and MHD. The intra-day and inter-day bias were−8.84 to 4.18%, and the imprecision was less than 8.08% for all analytes. The internal standard (fluconazole) normalized recovery was 96.30 to 107.69% for LTG, 98.51 to 111.04% for MHD, and 95.04 to 109.86% for OXC. A total of 186 LTG samples and 25 MHD samples were used to evaluate the agreement between HPLC-UV and ultra-performance liquid chromatography-mass spectrometry (UHPLC-MS/MS) by Passing-Bablok regression and Bland-Altman plot.
The mean bias and the 95% limits of agreement (95% LOA) of the two measurements were 0.575 mg/L and−1.238
to 2.387 mg/L for LTG (n= 186) and−1.222 mg/L and−8.271 to 5.827 mg/L for MHD (n= 25), which indicated the UV method was comparable with the MS method for LTG and MHD analysis.
Keywords:HPLC-UV, Lamotrigine, Oxcarbazepine, 10,11-Dihydro-10-hydroxycarbazepine, Method comparison
© The Author(s). 2019Open AccessThis article is distributed under the terms of the Creative Commons Attribution 4.0 International License (http://creativecommons.org/licenses/by/4.0/), which permits unrestricted use, distribution, and reproduction in any medium, provided you give appropriate credit to the original author(s) and the source, provide a link to the Creative Commons license, and indicate if changes were made.
* Correspondence:meishenghui1983@126.com
†Siyao Jin and Qing Zhao are equal first authors. †Siyao Jin and Qing Zhao contributed equally to this work.
1
Department of Pharmacy, Beijing Tiantan Hospital, Capital Medical University, 119 Nansihuan west road, Fengtai District, Beijing 100160, People’s Republic of China
Introduction
Drug therapy is the most important treatment for epi-lepsy control for most of the patients (Palte et al.,2018). New generations of anti-epileptic drugs (AEDs) such as lamotrigine (LTG) and oxcarbazepine (OXC) have grad-ually replaced traditional AEDs as first-line drugs for their less drug interactions and better toleration (Thei-tler et al.,2017).
LTG is widely used in monotherapy and combined therapy for epilepsy control, especially for special popu-lations such as children, the elderly, and pregnant women (Italiano & Perucca, 2013; Westley & Morris,
2008). The most important and prevalent toxicity of
LTG is toxic epidermal necrosis with a mortality of about 30%, and its incidence increases significantly when
LTG plasma level is above 15 mg/L (Alabi et al., 2016;
Baldelli et al., 2015a; Pereira et al., 2007). LTG plasma level could be affected by various factors including age, pregnancy, liver and kidney function, smoking, genetic background, and combined medication (Italiano & Per-ucca, 2013; Petrenaite et al., 2005; Clark et al., 2013; Lovric et al., 2018; Brzakovic et al., 2012; Milosheska et al.,2016). Therefore, LTG dose adjustment is a chal-lenge for clinicians and pharmacist to achieve satisfied efficacy and avoid life-threatening toxicity.
OXC is another first-line drug for the treatment of generalized tonic-clonic and partial seizure (Wellington & Goa, 2001). After oral administration, OXC is rapidly reduced to its active metabolite 10,11-dihydro-10-hydro-xycarbazepine (MHD), which is the biomarker for its pharmacological activity (May et al., 2003) and toxicity (Wellington & Goa,2001; Striano et al.,2006). However, the pharmacokinetics of MHD varied greatly among in-dividuals, and it could be influenced by age, body weight, renal function, and pregnancy (Patsalos et al.,2008; Lin
et al., 2018). Based on the characteristics of LTG and
OXC mentioned above, therapeutic drug monitoring (TDM) is recommended for safe and effective use of the two drugs (Patsalos et al.,2008).
Previously, several methods were developed and vali-dated for the determination of the three analytes with many limitations. One HPLC-UV method published in 2013 used solid-phase extraction for sample pretreat-ment, but it was too expensive to afford for developing countries (Serralheiro et al., 2013). Other methods did not simultaneously determine MHD and LTG (EMEA, 2011; Almeida et al.,2002). We also developed and vali-dated an UHPLC-MS/MS method for the simultaneous determination of the three analytes. However, during routine clinical application of the method, we found that an alternative method was required due to the following reasons: immunoassay for LTG, OXC, and MHD meas-urement is not available in China; for routine monitor-ing of clinical samples, the LC-MS should be ready
during the work day, which resulted in big dissipate of machine-hour; UV method was more affordable for rou-tine monitoring than the LC-MS method, especially in developing countries like China; and during the long-time clinical application, LC-MS might be shut down due to various troubles, however the drug monitoring should not be interrupted to ensure medical quality. This study was designed to develop and validate a sim-ple, accurate, and reliable HPLC-UV method for simul-taneous determination of LTG, OXC, and MHD. The agreement between HPLC-UV method and LC-MS/MS method for LTG and MHD analysis was also evaluated by Passing-Bablok regression and Bland-Altman plot.
Method and materials
Standards and reagents
LTG (98% purity) was purchased from HePeng (Shang-hai, China) Biotech, Ltd. OXC (Lot, 100657-201102, 99.8% purity) and fluconazole (FCZ, internal standard, IS) (Lot, 100314-201204, 99.8% purity) were acquired from the Na-tional Institutes for Food and Drug Control (Beijing, China). MHD (Lot, 20140827, 97% purity) was obtained from Nanjing Chemlin Chemical Industry Company, Ltd. Methanol and acetonitrile were purchased from Fisher Scientific (Waltham, USA). Acetic acid and potassium dihydrogen phosphate were obtained from Sinopharm Chemical Reagent Company, Ltd. Human blank plasma was provided by healthy volunteers and checked to ensure they did not contain LTG, MHD, OXC, or FCZ. Ultrapure water was produced by Millipore ultra-pure water system (Bedford, USA).
Equipment and chromatographic conditions
Experiment was carried out on Dionex UltiMate 3000 (Thermo Fisher, USA) with a PDA3000 UV Detector
(Thermo Fisher, USA) equipped with an Acclaim™ C18
column (Thermo, 4.6 × 150 mm, 5μm particles).
Instru-ment control and data acquisition were performed by the Chromeleon™software (Thermo Fisher, version 7).
A mixture of potassium dihydrogen phosphate buffer (50 mM) and methanol (61:39) was used for separation at 1.0 mL/min. The column oven was maintained at 37 °C. LTG, OXC, and MHD were monitored at 210 nm.
Preparation of stock and working solutions
IS stock solution was prepared by dissolving FCZ in methanol at 4400 mg/L, and IS working solution was 440 mg/L. All stock and working solutions were stored
at−80 °C and thawed to room temperature before use.
Preparation of calibration and QC samples
Ten microliters of analytes working solution and 10μL of IS working solution were added to 50μL of
analytes-and IS-free blood plasma, then 130μL of methanol (1%
acetic acid) was added following a 5-min vortex-mixing and a 2-min centrifugation at 12000×g for protein pre-cipitation. Sixty microliters of the supernatant was
trans-ferred into a sample vial, and 20μL was injected for
analysis. Thus, calibration samples for curve fitting were prepared at 2.4, 4.8, 12, 30, 60, and 120 mg/L for LTG, MHD, and OXC, and QC samples were prepared at 2.4, 6, 24, 48, and 96 mg/L for LTG, MHD, and OXC. The final concentration was 22 mg/L for IS.
Sample extraction and patient enrollment
This study was approved by the Ethics Committee of Beijing Tiantan Hospital, Capital Medical University,
Beijing, Peoples’ Republic of China. Informed consent
was obtained from all individual participants included in the study. About 1 to 2 mL of venous blood was ob-tained from patients with epilepsy on OXC and/or LTG therapy. After 5 min centrifugation at 5000×g, 50μL of
the blood plasma was transferred and mixed with 10μL
of IS, then 140μL of methanol (1% acetic acid) was
added, and then a 5-min vortex-mixing and a 2-min
centrifugation at 12,000×g were performed for protein
precipitation. Subsequently, 60μL of the supernatant
was transferred into the sample vial, and 20μL was
injected for analysis.
Method validation
Method validation was performed in accordance with the EMEA and FDA guidelines including selectivity, lower limit of quantitation (LLOQ), carry-over, linearity, accuracy, precision, recovery, and stability (FDA, 2013; EMEA,2011).
Selectivity and LLOQ
The selectivity was assessed by comparing the peak area of analytes- and IS-free plasma from six individuals with those of LLOQ samples. The peak area of interfering peaks in blank plasma should be less than 20% of that of
the LLOQ sample for analytes (FDA, 2013; EMEA,
2011). The lowest concentration of the calibration curve (2.4 mg/L for LTG, MHD, and OXC) was defined as the LLOQ. LLOQ is reliable when its bias and precision are within ± 20% and < 20%, respectively.
Linearity and carry-over
Least square method was used for linear regression for all analytes. A weighting factor of 1/x2was chosen for its lower relative error and higher r2 for linear regression (Almeida et al., 2002). The linear regression equations and correlation coefficients were calculated. Carry-over was evaluated by injecting a blank sample immediately following the highest concentration of the calibration sample. Acceptable carry-over is achieved when the peak area of interfering peaks in blank plasma was less than 20% of those in the LLOQ sample for analytes, and 5% for the IS (FDA,2013; EMEA,2011).
Accuracy and precision
The inter-day and intra-day accuracy and precision were estimated by analyzing five replicates of QC samples at 2.4, 6, 24, 48, and 96 mg/L for all analytes on 12 days, and the bias and coefficient of variation (CV%) were cal-culated. The accuracy was acceptable when bias was within ± 15% (± 20% for LLOQ), and the acceptable pre-cision was obtained when CV was less than 15% (20% for LLOQ).
Recovery
Two batches of QC samples at 2.4, 6, 24, 48, and 96 mg/ L for LTG, OXC, and MHD were prepared to evaluate
the recovery as follows (FDA, 2013; EMEA, 2011): (A)
LTG, OXC, MHD, and IS spiked in blank plasma from six individuals with extraction; (B) LTG, OXC, MHD, and IS in post-extracted blank plasma from the same six individuals. The ratios of (Aanalyte/Banalyte) × 100% were defined as recovery while the ratios of (Aanalyte/Banalyte)/ (AIS/BIS) × 100% were defined as IS normalized recovery. The recovery was reliable when IS normalized recovery was consistent at all QC levels.
Stability
Stability was assessed by using four levels of QC sam-ples. The bias between post-stored samples and the QC samples prepared at the same day was used to evaluate the stability of analytes during sample preparation, stor-age, and analysis: in plasma: 25 °C for 6 h and 9 h, three
freeze-thaw cycles from − 80 to 25 °C, and− 80 °C for
15 days; post-extraction: 25 °C for 10 h and 24 h, 4 °C for 24 h, and−80 °C for 17 days. Analytes were stable when the bias of QC samples was within ± 15%.
The influence of other co-medicated AEDs on the measurement of LTG, OXC, and MHD
measurement of these analytes was not evaluated be-cause all of them were lack of ultra-violet absorption. To make sure the commonly used AEDs did not influence the determination of LTG, OXC, and MHD, samples were prepared by adding working solutions (concentra-tion 24 mg/L for LTG, OXC, and MHD) into the plasma obtained from patients taking PB, PHT, or CBZ (the plasma concentrations of these co-medicated AEDs were all within the therapeutic window) and analyzed within a runtime of 30 min and 15 min, respectively. Then, two blank samples (methanol only) were injected immediately.
The UHPLC-MS/MS method
The UHPLC-MS/MS method was performed on an Acquity UHPLC H-Class (Waters, MA, USA) tandem 5500 QTRAP mass system (AB SCIEX, CA, USA). The calibration range was 0.06 to 12 mg/L for LTG and 0.03
to 6 mg/L for MHD using LTG-13C3and MHD-D4as
in-ternal standards. The quantitative ion pair was m/z
256.0 > 144.9 for LTG,m/z255.1 > 194.1 for MHD,m/z 259.0 > 144.9 for LTG-13C3, and m/z259.1 > 198.1 for MHD-D4. The separation was achieved by using metha-nol (A, 0.1% formic acid) and water (B, 0.1% formic acid) at 0.4 mL/min under gradient elution with a run time of 3 min. Calibrators at 0.03, 0.06, 0.3, 0.6, 3, and 6 mg/L for MHD and 0.06, 0.12, 0.6, 1.2, 6, and 12 mg/L for LTG and QC samples at 0.09, 0.225, 2.25, and 4.5 mg/L for MHD and 0.18, 0.45, 4.5, and 9 mg/L for LTG were prepared by spiking 10μL working solution and 10μL IS
into 100μL drug- and IS-free blood plasma and
vortex-mixed and centrifuged with 300μL methanol for precipi-tation. The supernatant was diluted 10 times, and then, 1μL of the supernatant was injected for analysis. Ten-fold dilution by plasma or water did not affect the meas-urement of analytes in LC-MS/MS method, by doing that, the method could cover the clinical plasma concen-tration range for all analytes.
Statistical analysis
Statistical analysis was performed by using SPSS (SPSS Inc., Chicago, IL, USA, version 17) and MedCale (Med-Cale Software bvba, Ostend, Belgium, version 15.8) soft-ware. Statistical significance was defined as aPvalue less than 0.05.
Application and comparison
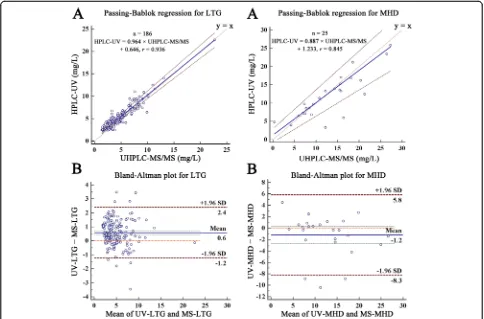
A total of 186 samples for LTG (25 samples for MHD) were analyzed by the HPLC-UV and the UHPLC-MS/ MS methods. The equation and the correlation coeffi-cient were evaluated by Passing-Bablok regression (a lin-ear regression procedure with no special assumptions regarding the distribution of the samples and the meas-urement errors) and Pearson test for both two methods (Passing & Bablok, 1983). The mean value of the two
measurements was evaluated by paired samples ttest or
Wilcoxon test. Bland-Altman plot was used to supple-ment the results of the Passing-Bablok regression and evaluate the agreement of the two methods (Bland & Altman,1986; Bland & Altman,1999).
Results
Linearity and LLOQ
Figure 1 shows the typical chromatograms of the HPLC
method. The typical linear regression equation is y =
5.8274 ×x−0.767,r2= 0.9983 for LTG;y= 4.0106 ×x+ 1.278,r2= 0.9972 for MHD; andy= 2.9969 ×x−0.028,r2 = 0.9967 for OXC (x, analytes concentration;y, peak area ratio of analytes to IS). The bias and imprecision of LLOQ samples were −12.54 to 4.41% and < 11.74% for LTG,− 15.72 to 8.44% and < 18.96% for MHD;−17.62 to 13.33% and < 15.94% for OXC, respectively (supplementary data-accuracy).
Selectivity and carry-over
The signal-to-noise ratio of LLOQ samples was 17.0, 32.3, and 56.7 for LTG, MHD, and OXC, respectively. Interfering peaks at the elution time of analytes in blank plasma were less than 20% of those at LLOQ samples and IS did not influence the analysis. Carry-over was negligible for all analytes and IS.
Accuracy and precision
Table 1 shows the intra-day and inter-day accuracy and
precision of the method. The intra-day and inter-day
bias at five QC levels were −7.99 to 4.18% for LTG, −
8.84 to 2.97% for MHD, and − 5.30 to 3.56% for OXC;
the imprecision was < 8.08% for LTG, < 7.22% for MHD, and < 7.79% for OXC.
Recovery
At four QC levels, the recovery was 90.74 to 95.53% for LTG, 92.78 to 99.65% for MHD, and 89.37 to 99.31% for OXC, respectively (Table2). The IS normalized recovery was 96.30 to 107.69% for LTG, 98.51 to 111.04% for MHD, and 95.04 to 109.86% for OXC, separately. Thus, the extraction recovery was consistent and acceptable.
Stability
LTG, OXC, and MHD were stable under all storing
con-ditions at four QC levels with a bias ranged from −
13.24 to 19.60% (Additional file1: Appendix 1).
Calibration and QC of the UHPLC-MS/MS method
The influence of other co-medicated AEDs on the measurement of LTG, OXC, and MHD
The influence of PB, PHT, and CBZ on the analysis of
LTG, OXC, and MHD is illustrated in Additional file1:
Appendix 2. PB, PHT, and CBZ were well separated from the three analytes with a retention time of 5.20 min for FCZ, 6.22 min for LTG, 7.90 min and 8.61 min for PB, 9.73 min for MHD, 13.40 min for OXC, 21.20 min for PHT, and 26.57 min for CBZ in a 30-min elution
(Additional file 1: Appendix 2-A). With a 15-min
elu-tion, the retention time of PB was 7.90 and 8.61 min, but PHT and CBZ were retained on the column, and they were eluted from the column in the next 15-min elution with a retention time of 3.72 min and 9.15 min (Add-itional file1: Appendix 2-B, C, D).
Method application and comparison
LTG measurements for both two methods were
abnor-mally distributed (P < 0.05 for Kolmogorov-Smirnov
test), while MHD measurements were normally distrib-uted (P < 0.2 for Shapiro-Wilk test). The results of UHPLC-MS/MS method were 4.50 ± 2.66 (0.51 to 22.70) mg/L for LTG and 12.08 ± 7.66 (0.04 to 27.30) mg/L for MHD. The results of HPLC-UV method were 5.61 ± 2.58 (2.42 to 22.57) mg/L for LTG and 11.14 ± 5.88 (3.33 to 25.90) mg/L for MHD. Between the two
measurements, the mean value was different (P <
0.0001) for LTG, but it was similar for MHD (P =
0.102). Evaluated by Passing-Bablok regression (Fig. 2a),
the regression equation of the two measurements was
HPLC-UV = 0.960 × UHPLC-MS/MS + 0.64 (r= 0.936)
for LTG and HPLC-UV = 0.887 × UHPLC-MS/MS + 1.23 (r= 0.845) for MHD.
There was no correlation between the difference and magnitude in both two measurements for both LTG and MHD; therefore, comparison was achieved by using the initial data of both measurements (Bland & Altman, 1986; Bland & Altman, 1999). The mean bias and the 95% LOA of the two measurements were 0.575 mg/L
and − 1.238 to 2.387 mg/L for LTG, and − 1.222 mg/L
and −8.271 to 5.827 mg/L for MHD. Eight LTG (8/186,
4.30%) and three MHD samples (3/25, 12%) fallen out-side the range of their 95% LOA (Fig.2b), respectively.
Discussion
Optimization of chromatographic conditions
In published studies, 210 nm and 270 nm were com-monly used wavelength for the measurement of LTG, MHD, and OXC, and their maximum UV absorptions were 210 nm, 230 nm, and 255 nm, respectively (Baldelli et al.,2015a; Greiner-Sosanko et al.,2007; Contin et al., 2010; Fortuna et al., 2010). When 270 nm was used for detection, the absorption was 7.22 times lower than those at 210 nm for LTG at LLOQ, and MHD and OXC
were undetectable at LLOQ (Additional file1: Appendix
3). We found that all analytes had a relatively high ab-sorption at 210 nm, which was chosen for detection
(Additional file 1: Appendix 4). Methanol and
acetonitrile were optimized for separation. Acetonitrile was tested at first, and we found that it would greatly shorten the retention time of LTG to 2.62 min and its
quantification will be affected by protein peaks
(Additional file 1: Appendix 5-A). After decreasing the proportion of acetonitrile (15% acetonitrile-water) to im-prove LTG retention (6.69 min), MHD and OXC were eluted out of 15 min, which was too long to use in clin-ical monitoring (Additional file 1: Appendix 5-B). This problem was solved when we used methanol (Additional file 1: Appendix 3-A). Several studies have shown that isocratic elution by methanol-water was useful for separ-ation, and we also used it for optimization for its low price (Westley & Morris,2008; Rivas et al.,2010). Thus, isocratic elution by methanol-water was used for
separation. The use of potassium dihydrogen phosphate
in water (20–100 mM) could increase the intensity and
shorten the retention time of three analytes (Additional file1: Appendix 6) (Greiner-Sosanko et al.,2007; Contin et al., 2010; Rivas et al., 2010; Kimiskidis et al., 2007; Zhang et al., 2019). In summary, isocratic elution with methanol to water-50 mM potassium dihydrogen phos-phate at 39:61 was used for separation, and 210 nm was used for detection to get acceptable peak shape, sensitiv-ity, and run time.
Different precipitants were tested. Acetic acid was use-ful to separate PB and MHD (Jebabli et al.,2015) as well as to improve peak shape for three analytes (Additional
file 1: Appendix 7). Moreover, by using acetic acid as
precipitant, a smaller precipitant volume (3 to 0.6 times Table 1The precision and accuracy of LTG, MHD, and OXC in human blood plasma (mean ± standard deviation)
Measurement Drug Analyte concentration (mg/L) Measured concentration (mg/L) Bias (%) Coefficient variation (%)
Intra-day,n= 5 LTG 96 100.015 ± 8.078 4.18 8.08
48 46.138 ± 2.457 −3.88 5.32
24 22.082 ± 0.789 −7.99 3.57
6 5.703 ± 0.427 −4.95 7.49
2.4 2.308 ± 0.08 −3.84 3.45
MHD 96 98.85 ± 7.1 2.97 7.18
48 46.773 ± 2.372 −2.56 5.07
24 22.536 ± 0.788 −6.10 3.49
6 5.89 ± 0.425 −1.83 7.22
2.4 2.188 ± 0.102 −8.84 4.67
OXC 96 99.414 ± 7.201 3.56 7.24
48 47.06 ± 2.307 −1.96 4.90
24 22.729 ± 0.794 −5.30 3.49
6 5.953 ± 0.379 −0.78 6.37
2.4 2.345 ± 0.183 −2.30 7.79
Inter-day,n= 60 LTG 96 98.769 ± 2.952 2.88 2.99
48 46.561 ± 1.076 −3.00 2.31
24 23.337 ± 0.491 −2.76 2.10
6 5.878 ± 0.091 −2.03 1.55
2.4 2.337 ± 0.084 −2.63 3.58
MHD 96 96.934 ± 2.884 0.97 2.97
48 46.565 ± 1.416 −2.99 3.04
24 23.468 ± 0.475 −2.22 2.03
6 6.053 ± 0.128 0.89 2.12
2.4 2.335 ± 0.117 −2.69 5.01
OXC 96 98.103 ± 2.908 2.19 2.96
48 46.931 ± 1.074 −2.23 2.29
24 23.912 ± 0.473 −0.37 1.98
6 6.114 ± 0.204 1.89 3.34
2.4 2.336 ± 0.066 −2.68 2.83
Table 2The recovery of LTG, MHD, and OXC in human blood plasma (mean ± standard deviation,n= 6)
Drug Analyte concentration (mg/L) Recovery-analytes (%) IS normalized recovery (%)
LTG 96 96.416 ± 11.993 107.685 ± 19.554
48 95.532 ± 10.998 104.92 ± 19.041
24 94.036 ± 6.047 101.893 ± 8.805
6 90.742 ± 10.653 96.295 ± 1.431
MHD 96 99.648 ± 12.17 111.04 ± 18.242
48 98.922 ± 10.127 108.393 ± 16.871
24 95.792 ± 6.056 103.762 ± 8.332
6 92.784 ± 10.517 98.514 ± 2.574
OXC 96 97.591 ± 12.581 108.75 ± 18.517
48 96.473 ± 9.032 105.696 ± 15.734
24 95.643 ± 6.356 103.66 ± 9.514
6 89.374 ± 9.427 95.038 ± 5.174
FCZ (IS) 96 90.983 ± 13.712
-48 92.412 ± 11.783
24 92.782 ± 9.522
6 94.309 ± 11.685
Abbreviations: LTGlamotrigine,MHD10,11-dihydro-10-hydroxycarbazepine,OXCoxcarbazepine,ISinternal standard (fluconazole),CVcoefficient of variation
of plasma volume) and a higher response of analytes were obtained compared to methanol or acetonitrile. However, incomplete protein precipitation was observed, and the response of protein peak treated with acetic acid was 3.5-fold higher than those with methanol. Moreover, white flocculent precipitates appeared in acetic acid-precipitated samples after storing at room temperature for 2 h. Although we could solve this problem by storing the post-precipitated sample at 4 °C for 30 min, the time-consuming precipitation was not suitable for its clinical application. Due to the benefits of acetic acid for protein precipitation, different concentrations of acetic acid (0.1%, 0.3%, 1%, 3%) were added in methanol for sample pretreatment. The results indicated that metha-nol with 1% acetic acid had the highest intensity and ac-ceptable peak shapes (Additional file1: Appendix 8), and this simple and effective method was chosen for protein precipitation and extraction (Serralheiro et al., 2013;
Jebabli et al., 2015). The low proportion of methanol
(39%) for separation could result in column pollution; therefore, column should be washed every day after ana-lysis to guarantee the column efficiency.
PB and PHT would not affect the determination of LTG, MHD, and OXC because they were well separated from the three analytes. However, CBZ might interfere MHD analysis in the next injection (9.15 min for CBZ and 9.73 min for MHD). Therefore, a blank sample should be injected immediately after the analysis of sam-ples containing CBZ to avoid its influence on MHD measurement.
Method validation
The linear range was 2.4–120 mg/L for all analytes, and
each of them could meet their therapeutic ranges (2.5–
15 mg/L for LTG and 3–35 mg/L for MHD) (Patsalos
et al., 2008). The IS normalized recovery (96.30 to
107.69% for LTG, 98.51 to 111.04% for MHD, and 95.04 to 108.75% for OXC at four QC levels) was similar com-pared with the values in many published studies (84.16 to 103.7% for LTG, 77.30 to 104.40% for MHD, and
79.30 to 96.93% for OXC) (Serralheiro et al., 2013;
Kimiskidis et al., 2007; Begas et al., 2017; Alves et al.,
2007; Contin et al., 2005). The freeze-thaw and
long-term storing stabilities were similar to the published re-sults (Serralheiro et al.,2013; Baldelli et al.,2015b; Mor-gan et al., 2011; Antonilli et al., 2011). Three analytes were stable at room temperature for 9 h, while in the lit-erature, they were stable for 4 h (Serralheiro et al.,2013; Fortuna et al.,2010).
In actual daily measurements, it is not convenient to obtain large amount of drug-free human plasma. There-fore, we tried to use water instead of plasma as matrix for the preparation of calibration and QC samples. The results indicated that bias between water and plasma
samples at five QC levels (2.4 to 96 mg/L) was −14.89
to 11.16% (supplementary data-serum-water), which in-dicated that water could be used to replace plasma.
Method application and comparison
A good correlation (r = 0.936) between HPLC-UV and
UHPLC-MS/MS for LTG analysis was observed, and the correlation equation was almost coincident with the line of equality (y =x) (Bland & Altman, 1986; Bland &
Alt-man, 1999). The sample size was big enough as
sug-gested (> 100) to get a stable result for LTG but not for
MHD (Bland, 2004). HPLC-UV was higher than
UHPLC-MS/MS for LTG analysis with a mean value of 0.6 mg/L, which could be explained by the co-elution of endogenous impurities attributed to the well-known less specificity of UV detector (Zhang et al.,2019). Quantita-tive microsphere system LTG immunoassay was applied in the clinical practice and compared with HPLC-UV method in the previous studies (Westley & Morris,2008; Baldelli et al., 2015a; Morgan et al., 2011). The results demonstrated a significant overestimation (6 to 21%) for the immunoassay which might be caused by the cross-reaction of the antibody used in the assay with the N2-glucuronide metabolite of LTG (Westley & Morris,
2008; Morgan et al.,2011). The mean bias and 95% LOA
of MHD observed between the two methods were rela-tively high perhaps because of the small sample size. Due to lack of clinical information, we did not know whether this degree of variation for drug measurement will affect clinical therapy.
Conclusion
A simple, accurate, and reliable method for simultaneous determination of LTG, OXC, and MHD by HPLC-UV was developed, validated, and applied in clinical practice. The experiences in method development and validation might be useful for other researchers. The 95% LOA of
HPLC-UV and UHPLC-MS/MS was − 1.238 to 2.387
mg/L for LTG and − 8.271 to 5.827 mg/L for MHD.
More clinical information was required to evaluate their clinical agreements.
Supplementary information
Supplementary informationaccompanies this paper athttps://doi.org/10. 1186/s40543-019-0198-9.
Appendix 4, The UV absorption spectrum of: (A) LTG; (B) MHD; (C) OXC; Appendix 5, The chromatogram of LTG, MHD, and OXC under the iso-cratic elution of: (A) 30% acetonitrile-water; (B) 15% acetonitrile-water; Ap-pendix 6, The chromatogram of LTG, MHD, and OXC under the isocratic elution of: (A) 45% methanol-water; (B) 45% methanol-water (50 mM po-tassium dihydrogen phosphate); the retention time of LTG, MHD, and OXC was: (A) 4.69, 6.08, and 7.90 min, respectively; (B) 3.94, 5.19, and 6.59 min, respectively; the UV absorption of three analytes was: (A) 1.99, 2.00, and 1.59 mAU*min, respectively; (B) 3.32, 2.06, and 1.72 mAU*min, re-spectively;Appendix 7, The chromatogram of FCZ, LTG, MHD, and OXC under the isocratic elution of 40% methanol-water (50 mM potassium dihydrogen phosphate) with the use of: (A) 10% acetic acid; (B) methanol as the precipitant;Appendix 8, The chromatogram of FCZ, LTG, MHD, and OXC under the isocratic elution of 39% methanol-water (50 mM po-tassium dihydrogen phosphate) with the use of: (A) methanol (0.3% acetic acid); (B) methanol (0.1% acetic acid); (C) methanol (1% acetic acid); (D) methanol (3% acetic acid); (E) acetonitrile (0.3% acetic acid) as the precipitant; The peak area of FCZ, LTG, MHD, and OXC with the use of: (A) methanol (0.3% acetic acid); (B) methanol (0.1% acetic acid); (C) methanol (1% acetic acid); (D) methanol (3% acetic acid); (E) acetonitrile (0.3% acetic acid) as the precipitant.
Abbreviations
95% LOA:95% limits of agreement; AEDs: Anti-epileptic drugs;
CBZ: Carbamazepine; FCZ: Fluconazole; HPLC-UV: High-performance liquid chromatography-ultraviolet detection; IS: Internal standard; LLOQ: Lower limit of quantitation; LTG: Lamotrigine; MHD:
10,11-Dihydro-10-hydroxycarbazepine; OXC: Oxcarbazepine; PB: Phenobarbital; PHT: Phenytoin; QC: Quality control; TDM: Therapeutic drug monitoring; UHPLC-MS/MS: Ultra-performance liquid chromatography-mass spectrometry
Acknowledgements Not applicable
Authors’contributions
JSY and ZQ analyzed and interpreted the method validation data and were a major contributor in writing the manuscript. ZDJ finished the acquisition and analysis. MSH and ZZG drafted the work or substantively revised it. All authors read and approved the final manuscript.
Funding
This study was supported by the Beijing Municipal Administration of Hospitals (ZYLX201827).
Availability of data and materials
All data generated or analyzed during this study are included in this published article (Additional file1).
Competing interests
The authors declare that they have no competing interests.
Received: 8 August 2019 Accepted: 14 November 2019
References
Alabi A, Todd A, Husband A, et al. Safety profile of lamotrigine in overdose. Ther Adv Psychopharmacol. 2016;6(6):369–81.
Almeida AM, Castel-Branco MM, Falcão AC. Linear regression for calibration lines revisited: weighting schemes for bioanalytical methods. Journal of Chromatography B. 2002;774(2):215–22.
Alves G, Figueiredo I, Castel-Branco M, et al. Enantioselective HPLC-UV method for determination of eslicarbazepine acetate (BIA 2-093) and its metabolites in human plasma. Biomed Chromatogr. 2007;21(11):1127–34.
Antonilli L, Brusadin V, Filipponi F, et al. Development and validation of an analytical method based on high performance thin layer chromatography for the simultaneous determination of lamotrigine, zonisamide and
levetiracetam in human plasma. J Pharm Biomed Anal. 2011;56(4):763–70. Baldelli S, Castoldi S, Charbe N, et al.(2015a) Comparison of the QMS analyzer
with HPLC-UV for the quantification of lamotrigine concentrations in human plasma samples. Therapeutic drug monitoring.37(5):689-694.
Baldelli S, Cattaneo D, Giodini L, et al. Development and validation of a HPLC-UV method for the quantification of antiepileptic drugs in dried plasma spots. Clin Chem Lab Med. 2015b;53(3):435–44.
Begas E, Tsakalof A, Dardiotis E, et al. Development and validation of a reversed-phase HPLC method for licarbazepine monitoring in serum of patients under oxcarbazepine treatment. Biomed Chromatogr. 2017;31(9).
Bland J.(2004) How can I decide the sample size for a study of agreement between two methods of measurement. John Martin Bland. Bland J M, Altman D G.(1986) Statistical methods for assessing agreement
between two methods of clinical measurement. Lancet (London, England). 1(8476):307-310.
Bland J M, Altman D G.(1999) Measuring agreement in method comparison studies. Statistical methods in medical research.8(2):135-160.
Brzakovic BB, Vezmar Kovacevic SD, Vucicevic KM, et al. Impact of age, weight and concomitant treatment on lamotrigine pharmacokinetics. J Clin Pharm Ther. 2012;37(6):693–7.
Clark CT, Klein AM, Perel JM, et al. Lamotrigine dosing for pregnant patients with bipolar disorder. Am J Psychiatry. 2013;170(11):1240–7.
Contin M, Balboni M, Callegati E, et al. Simultaneous liquid chromatographic determination of lamotrigine, oxcarbazepine monohydroxy derivative and felbamate in plasma of patients with epilepsy. J Chromatogr B Analyt Technol Biomed Life Sci. 2005;828(1-2):113–7.
Contin M, Mohamed S, Candela C, et al. Simultaneous HPLC-UV analysis of rufinamide, zonisamide, lamotrigine, oxcarbazepine monohydroxy derivative and felbamate in deproteinized plasma of patients with epilepsy. J Chromatogr B Analyt Technol Biomed Life Sci. 2010;878(3-4):461–5. EMEA.(2011) Committee for Medicinal Products for Human Use, Guideline on
Bioanalytical Method Validation. EMEA/CHMP/EWP/192217/2009 Rev. 1 Corr. 2** (21July2011). Available at:http://www.emaeuropaeu/docs/en_GB/ document_library/Scientific_guideline/2011/08/WC500109686pdf. FDA.(2013) Guidance for industry: bioanalytical method validation. Available at:
http://www.fdagov/ucm/groups/fdagov-public/@fdagov-drugs-gen/ documents/document/ucm368107pdf.
Fortuna A, Sousa J, Alves G, et al. Development and validation of an HPLC-UV method for the simultaneous quantification of carbamazepine,
oxcarbazepine, eslicarbazepine acetate and their main metabolites in human plasma. Anal Bioanal Chem. 2010;397(4):1605–15.
Greiner-Sosanko E, Giannoutsos S, Lower DR, et al. Drug monitoring:
simultaneous analysis of lamotrigine, oxcarbazepine, 10-hydroxycarbazepine, and zonisamide by HPLC-UV and a rapid GC method using a nitrogen-phosphorus detector for levetiracetam. J Chromatogr Sci. 2007;45(9):616–22. Italiano D, Perucca E. Clinical pharmacokinetics of new-generation antiepileptic
drugs at the extremes of age: an update. Clin Pharmacokinet. 2013;52(8):627–45. Jebabli N, Gaies E, El Jebari H, et al. Development and validation of a new HPLC
method for determination of Lamotrigine and clinical application. Tunis Med. 2015;93(8-9):565–8.
Kimiskidis V, Spanakis M, Niopas I, et al. Development and validation of a high performance liquid chromatographic method for the determination of oxcarbazepine and its main metabolites in human plasma and cerebrospinal fluid and its application to pharmacokinetic study. J Pharm Biomed Anal. 2007;43(2):763–8.
Lin WW, Li XW, Jiao Z, et al. Population pharmacokinetics of oxcarbazepine active metabolite in Chinese paediatric epilepsy patients and its application in individualised dosage regimens. Eur J Clin Pharmacol. 2018.
Lovric M, Cajic I, Petelin Gadze Z, et al. Effect of antiepileptic drug comedication on lamotrigine concentrations. Croat Med J. 2018;59(1):13–9.
May TW, Korn-Merker E, Rambeck B. Clinical pharmacokinetics of oxcarbazepine. Clin Pharmacokinet. 2003;42(12):1023–42.
Milosheska D, Lorber B, Vovk T, et al. Pharmacokinetics of lamotrigine and its metabolite N-2-glucuronide: influence of polymorphism of UDP-glucuronosyltransferases and drug transporters. Br J Clin Pharmacol. 2016; 82(2):399–411.
Morgan PE, Fisher DS, Evers R, et al. A rapid and simple assay for lamotrigine in serum/plasma by HPLC, and comparison with an immunoassay. Biomed Chromatogr. 2011;25(7):775–8.
Passing H, Bablok. A new biometrical procedure for testing the equality of measurements from two different analytical methods. Application of linear regression procedures for method comparison studies in clinical chemistry. Part I. Journal of clinical chemistry and clinical biochemistry Zeitschrift fur klinische Chemie und klinische Biochemie. 1983;21(11):709–20. Patsalos PN, Berry DJ, Bourgeois BF, et al. Antiepileptic drugs--best practice
guidelines for therapeutic drug monitoring: a position paper by the subcommission on therapeutic drug monitoring, ILAE Commission on Therapeutic Strategies. Epilepsia. 2008;49(7):1239–76.
Pereira FA, Mudgil AV, Rosmarin DM. Toxic epidermal necrolysis. J Am Acad Dermatol. 2007;56(2):181–200.
Petrenaite V, Sabers A, Hansen-Schwartz J. Individual changes in lamotrigine plasma concentrations during pregnancy. Epilepsy Res. 2005;65(3):185–8. Rivas N, Zarzuelo A, Lopez FG. Optimisation of a high-efficiency liquid
chromatography technique for measuring lamotrigine in human plasma. Farm Hosp. 2010;34(2):85–9.
Serralheiro A, Alves G, Fortuna A, et al.(2013) First HPLC-UV method for rapid and simultaneous quantification of phenobarbital, primidone, phenytoin, carbamazepine, carbamazepine-10,11-epoxide, 10,11-trans-dihydroxy-10,11-dihydrocarbamazepine, lamotrigine, oxcarbazepine and licarbazepine in human plasma. J Chromatogr B Analyt Technol Biomed Life Sci.925:1-9. Striano S, Striano P, Di Nocera P, et al. Relationship between serum
mono-hydroxy-carbazepine concentrations and adverse effects in patients with epilepsy on high-dose oxcarbazepine therapy. Epilepsy Res. 2006;69(2):170–6. Theitler J, Brik A, Shaniv D, et al. Antiepileptic drug treatment in
community-dwelling older patients with epilepsy: a retrospective observational study of old-versus new-generation antiepileptic drugs. Drugs Aging. 2017;34(6):479–87. Wellington K, Goa KL. Oxcarbazepine: an update of its efficacy in the
management of epilepsy. CNS Drugs. 2001;15(2):137–63. Westley I S, Morris R G.(2008) Seradyn quantitative microsphere system
lamotrigine immunoassay on a Hitachi 911 analyzer compared with HPLC-UV. Therapeutic drug monitoring.30(5):634-637.
Zhang K, Kurita K L, Venkatramani C, et al.(2019) Seeking universal detectors for analytical characterizations. J Pharm Biomed Anal.162:192-204.
Publisher’s Note