R E S E A R C H
Open Access
Relationship between plasma
homocysteine level and lipid profiles in a
community-based Chinese population
Mohetaboer Momin
1, Jia Jia
1, Fangfang Fan
1, Jianping Li
1, Jingtao Dou
3, Dafang Chen
2, Yong Huo
1and Yan Zhang
1*Abstract
Background:Previous studies established a possible link among hyperhomocysteinemia (HHcy), dyslipidemia, and
atherosclerosis. However, there was limited epidemic data concerning the relation between HHcy and lipid profiles, especially in community-based Chinese populations. This study aim to investigate the association of plasma homocysteine (Hcy) level with lipid profiles in a Chinese community-based population without lipid-lowering treatment.
Method:A total of 4660 Chinese subjects from a cohort of the Shijingshan district in Beijing were included in the analysis. Plasma total Hcy, serum lipid files including total cholesterol (TC), triglycerides (TG), low-density lipoprotein cholesterol (LDL-C), high-density lipoprotein cholesterol (HDL-C) as well as relevant metabolic risk factors were measured. Multivariate regression models adjusting for age, gender, smoking, drinking, physical activity, vitamin B supplement, body mass index, fasting blood glucose level, serum creatinine, systolic and diastolic blood pressure were used to evaluate associations of Hcy and lipid profiles.
Result:Subjects were 56.75 ± 8.91 years old, and 38.15% were male. Median (IQR) Hcy was 11.98 (10.00–14.93)μmol/L, and 24.4% had HHcy (defined as Hcy≥15μmol/L). Mean (SD) baseline TC was 5.34 ± 0.98 mmol/L, LDL-C was 3.27 ± 0. 81 mmol/L, and HDL-C was 1.43 ± 0.38 mmol/L. Median (IQR) of TG was 1.28 (0.91–1.85) mmol/L. In multivariable linear-regression analyses, lnHcy (ln transformation for Hcy) level was positively associated with lnTG (adjustedβ= 0. 075, SE = 0.021,P= 0.001). Using Hcy < 15μmol/L as a reference, HHcy was independently associated with both lnTG (adjustedβ= 0.056, SE = 0.020,P= 0.004) and lnHDL (adjustedβ=−0.018, SE = 0.009,P= 0.038). In multivariable logistic-regression analyses, HHcy was associated with increasing risk of low HDL-C (HDL-C < 1.04 mmol/L; adjusted odds ratio [OR] =1.406, 95% confidence interval [CI]: 1.143–1.728,P= 0.001) and hypertriglyceridemia (TG≥1.7 mmol/L; adjusted OR = 1.293, 95% CI: 1.096–1.524,P= 0.002) after adjusting the confounders. However, there were no significant associations between Hcy and TC or LDL-C.
Conclusion:The present study showed that HHcy was independently associated with hypertriglyceridemia and low levels of HDL-C, which provides evidence that Hcy levels might affect HDL-C and TG metabolism.
Keywords:Homocysteine, High-density lipoprotein cholesterol, Triglycerides
* Correspondence:drzhy1108@163.com
1Department of Cardiology, Peking University First Hospital, Beijing, China
Full list of author information is available at the end of the article
Background
Hyperhomocysteinemia (HHcy) has been regarded as a new modifiable risk factor for cardiovascular disease (CVD) through various mechanisms, including vascular endothelium damage, stimulation of smooth muscle cell proliferation, enhanced low-density lipoprotein cholesterol (LDL-C) peroxidation and thrombosis activation [1, 2]. Previous studies also established that there was a possible link among HHcy, dyslipidemia and atherosclerosis. Regarding Hcy, an inverse association between this amino acid and lipoproteins, especially high-density lipoprotein cholesterol (HDL-C), has been well described in humans and various animal models of HHcy [3]. HHcy might also increase the risk of CVD in dyslipidemia patients [4–6]. Although the mechanism of the link is not thoroughly known, recent studies strongly demonstrated the importance of the meta-bolic balance between S-adenosylmethionine (SAM), S-adenosylhomocysteine (SAH), phosphatidylcholine (PC), phosphatidylethanolamine (PE) and choline in Hcy metabolism, hypolipoproteinemia, liver function, and CVD [3, 7]. Several studies relating HHcy to disturbed HDL-C metabolism showed that Hcy can reduce circulating HDL-C via inhibiting ApoA-I pro-tein synthesis and enhance HDL-C clearance [8, 9]. However, there are limited epidemic data about the relationship between HHcy and lipid profiles, espe-cially in community-based Chinese populations. This study aims to investigate the association of plasma Hcy level with lipid profiles in a Chinese community-based population without lipid-lowering treatment.
Methods Subject
Participants were from an atherosclerosis cohort survey performed in the Gucheng and Pingguoyuan communities of the Shijingshan district in Beijing, China from December 2011 to April 2012. The methods and primary results of this survey have been reported elsewhere [10]. A total of 4,660 eligible participants aged 40 years old and above were included in this analysis, after excluding those with missing covariates and those under lipid-lowering treatment. The proposal was approved by the ethics com-mittee of both Peking University and Peking University First Hospital, and all subjects signed informed consent before enrollment.
Data collection
Baseline data were collected by trained research staff according to a standard operating procedure. Each par-ticipant was interviewed using a standardized question-naire designed specifically for the present study that provided information related to education status, med-ical history, body mass index (BMI), past and current
medication use, and personal habits such as use of vitamin B (VB) supplements and exercise habits, as well as cigarette and alcohol consumption. Seated brachial blood pressure (BP) and pulse for each participant were obtained by trained researchers after subjects rested for 5 min; an Omron HEM-7117 electronic sphygmoman-ometer was used. The mean of three consecutive mea-surements was used in the analysis.
Blood sample collection and laboratory methods
After an overnight fast of at least 12 h, a venous blood sam-ple was obtained from the forearm of each participant. Plasma samples were separated within 30 min of collection and were stored at−80 °C. Plasma Hcy was measured using an electrochemiluminescence method at Southern Medical University Nanfang Hospital National Clinical Research Center for Kidney Disease in Guangzhou. Serum total chol-esterol (TC), LDL-C, HDL-C, triglycerides (TG), fasting blood glucose (FBG), and creatinine (Scr) at baseline were measured on a Roche C8000 Automatic Analyzer in the la-boratory of Chinese PLA General Hospital. According to the China Adult Dyslipidemia Prevention Guide (2007 Edition) criteria [11], we defined TC ≥5.18 mmol/L as hypercholesterolemia, LDL-C≥3.37 mmol/L as a high level of LDL-C, HDL-C <1.04 mmol/L as low HDL-C, and TG
≥1.7 mmol/L as hypertriglyceridemia. According to results from previous studies [12], Hcy≥15 μmol/L is often de-fined as HHcy. Additionally, in the present study, 15μmol/L was the cut-off value of the upper quartiles of Hcy, so we defined Hcy≥15μmol/L as HHcy and divided the participants into two groups (Hcy≥15 μmol/L and Hcy < 15μmol/L) for further analysis.
Statistical analysis
Results
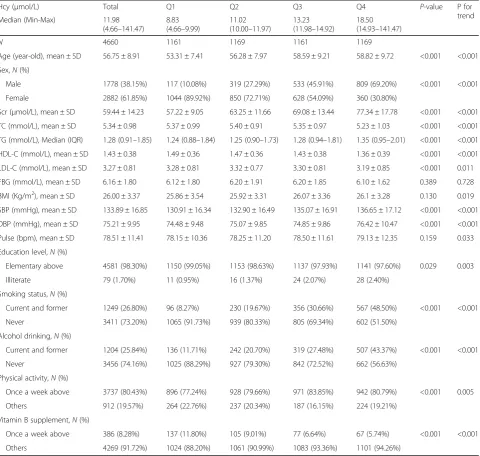
Subjects were 56.75 ± 8.91 years old, and 38.15% were male. The median (IQR) value of Hcy was 11.98 (10.00– 14.93)μmol/L, and 24.4% of subjects had HHcy. In order to have an even distribution in each group, the subjects were divided into subgroups using Hcy quartiles (Q1: 4.66–9.99 μmol/L; Q2: 10.00–11.97 μmol/L; Q3: 11.98– 14.92 μmol/L; and Q4: 14.93–141.47μmol/L). The trend test showed that with higher Hcy grade, subjects were older, more males, more smokers and drinkers. Also, levels of TG, Scr, BP, pulse, BMI and the proportion of physically active subjects were significantly higher. In con-trast, with increased Hcy grade, HDL-C level, education level and the proportion of patients who took VB supple-ments were lower. No differences were observed for FBG. These data are presented in Table 1.
Multivariable regression analysis was carried out to assess whether Hcy was independently associated with these lipid profiles by adjusting for likely confounders. Model 1 was univariate analysis, Model 2 adjusted age and gender, model 3 adjusted age, gender, smoking, alcohol drinking, VB supplement, BMI, FBG, pulse, physical activity, education level, BP and Scr. In multi-variable linear-regression analyses, lnHcy was positively associated with the lnTG in both models (adjusted βin full model = 0.075, SE = 0.021, P= 0.001). lnHcy was negatively associated with lnHDL (β=−0.024, SE = 0.010, P= 0.021) after adjustment for age and sex, but the associ-ation turned statistically insignificant after adjustment for all confounders (β=−0.016, SE = 0.010, P= 0.115). Though similar inverse trends were seen for lnTC and lnLDL, these were not statistically significant. When Hcy <15μmol/L group was used as the reference, Hcy≥15 μmol/L group was independently associated with lnTG (adjusted β in full model = 0.056, SE = 0.020, P= 0.004) and lnHDL (adjusted β in full model =−0.018, SE = 0.009, P= 0.038) as well. No positive associations were observed between HHcy and lnTC or lnLDL-C. These data are presented in Table 2.
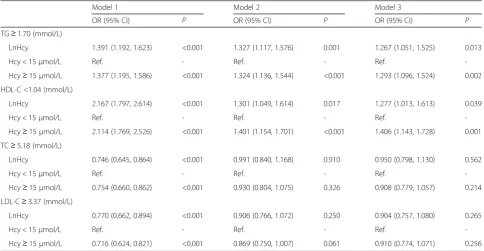
Furthermore, HHcy was associated with increasing risk of low HDL-C (adjusted odds ratio [OR] in full model = 1.406, 95% confidence interval [CI]:1.143–1.728, P= 0.001) and hypertriglyceridemia (adjusted OR in full model = 1.293, 95% CI: 1.096–1.524,P= 0.002) in multi-variable logistic-regression analyses. Similar significant findings were also found when analyzed the relation be-tween InHcy and low HDL-C and hypertriglyceridemia. However, there were no significant correlations between HHcy and hypercholesterolemia or high LDL-C. These data are presented in Table 3.
Discussion
The major findings of the present study are that HHcy status is independently associated with lower HDL-C
and higher TG. The population of the present study was from a Chinese urban community. Compared to prior studies based on Chinese population, the lipid levels observed in this population are close to those reported in recent epidemic data [13–15]. The median level of Hcy was 11.98 μmol/L, which is comparable to other data [12].
regression model, only age, sex, HbA1c, insulin and Scr were adjusted. Other factors such as BMI, statin usuage, VB supplement, drinking status, and physical activities weren’t taken into account, which should partly explain the discrepancy between two studies.
In summary, while studies examining the association between HHcy and lipid profiles in humans have had mixed conclusions, the most consistent findings indicate that higher Hcy is associated with decreased serum HDL-C and increased TG, which are consistent with the results of the present study. Furthermore, we found that TC and LDL-C levels showed a downward trend in the
HHcy group, but there is no significant difference. The clinical and epidemical data concerning correlations be-tween Hcy and TC, LDL-C are very limited, indicating that more studies are needed. To the best of our know-ledge, this was the largest study in Chinese population which could provide enough statistical power to evaluate the association of Hcy and lipid profiles. Besides, most prior researches were aimed at CVD patients or high risk patients, therefore, there is little reliable data about this phenomenon in community-based population. The population in the present study is community-based, which could provide more evidence for extrapolating the Table 1Baseline Characteristics Stratefied by Hcy quartiles
Hcy (μmol/L) Total Q1 Q2 Q3 Q4 P-value P for
trend
Median (Min-Max) 11.98
(4.66–141.47)
8.83 (4.66–9.99)
11.02 (10.00–11.97)
13.23 (11.98–14.92)
18.50 (14.93–141.47)
N 4660 1161 1169 1161 1169
Age (year-old), mean ± SD 56.75 ± 8.91 53.31 ± 7.41 56.28 ± 7.97 58.59 ± 9.21 58.82 ± 9.72 <0.001 <0.001
Sex,N(%)
Male 1778 (38.15%) 117 (10.08%) 319 (27.29%) 533 (45.91%) 809 (69.20%) <0.001 <0.001
Female 2882 (61.85%) 1044 (89.92%) 850 (72.71%) 628 (54.09%) 360 (30.80%)
Scr (μmol/L), mean ± SD 59.44 ± 14.23 57.22 ± 9.05 63.25 ± 11.66 69.08 ± 13.44 77.34 ± 17.78 <0.001 <0.001
TC (mmol/L), mean ± SD 5.34 ± 0.98 5.37 ± 0.99 5.40 ± 0.91 5.35 ± 0.97 5.23 ± 1.03 <0.001 <0.001
TG (mmol/L), Median (IQR) 1.28 (0.91–1.85) 1.24 (0.88–1.84) 1.25 (0.90–1.73) 1.28 (0.94–1.81) 1.35 (0.95–2.01) <0.001 <0.001
HDL-C (mmol/L), mean ± SD 1.43 ± 0.38 1.49 ± 0.36 1.47 ± 0.36 1.43 ± 0.38 1.36 ± 0.39 <0.001 <0.001
LDL-C (mmol/L), mean ± SD 3.27 ± 0.81 3.28 ± 0.81 3.32 ± 0.77 3.30 ± 0.81 3.19 ± 0.85 <0.001 0.011
FBG (mmol/L), mean ± SD 6.16 ± 1.80 6.12 ± 1.80 6.20 ± 1.91 6.20 ± 1.85 6.10 ± 1.62 0.389 0.728
BMI (Kg/m2), mean ± SD 26.00 ± 3.37 25.86 ± 3.54 25.92 ± 3.31 26.07 ± 3.36 26.1 ± 3.28 0.130 0.019
SBP (mmHg), mean ± SD 133.89 ± 16.85 130.91 ± 16.34 132.90 ± 16.49 135.07 ± 16.91 136.65 ± 17.12 <0.001 <0.001
DBP (mmHg), mean ± SD 75.21 ± 9.95 74.48 ± 9.48 75.07 ± 9.85 74.85 ± 9.86 76.42 ± 10.47 <0.001 <0.001
Pulse (bpm), mean ± SD 78.51 ± 11.41 78.15 ± 10.36 78.25 ± 11.20 78.50 ± 11.61 79.13 ± 12.35 0.159 0.033
Education level,N(%)
Elementary above 4581 (98.30%) 1150 (99.05%) 1153 (98.63%) 1137 (97.93%) 1141 (97.60%) 0.029 0.003
Illiterate 79 (1.70%) 11 (0.95%) 16 (1.37%) 24 (2.07%) 28 (2.40%)
Smoking status,N(%)
Current and former 1249 (26.80%) 96 (8.27%) 230 (19.67%) 356 (30.66%) 567 (48.50%) <0.001 <0.001
Never 3411 (73.20%) 1065 (91.73%) 939 (80.33%) 805 (69.34%) 602 (51.50%)
Alcohol drinking,N(%)
Current and former 1204 (25.84%) 136 (11.71%) 242 (20.70%) 319 (27.48%) 507 (43.37%) <0.001 <0.001
Never 3456 (74.16%) 1025 (88.29%) 927 (79.30%) 842 (72.52%) 662 (56.63%)
Physical activity,N(%)
Once a week above 3737 (80.43%) 896 (77.24%) 928 (79.66%) 971 (83.85%) 942 (80.79%) <0.001 0.005
Others 912 (19.57%) 264 (22.76%) 237 (20.34%) 187 (16.15%) 224 (19.21%)
Vitamin B supplement,N(%)
Once a week above 386 (8.28%) 137 (11.80%) 105 (9.01%) 77 (6.64%) 67 (5.74%) <0.001 <0.001
Others 4269 (91.72%) 1024 (88.20%) 1061 (90.99%) 1083 (93.36%) 1101 (94.26%)
Abbreviations:TCTotal cholesterol,TGTriglycerides,HDL-CHigh density lipoprotein cholesterol,LDL-CLow density lipoprotein cholesterol,HcyHomocysteine,
Table 2Multivariate linear regression for effects of Hcy on lipid profiles
Model 1 Model 2 Model 3
β(SE) P β(SE) P β(SE) P
LnTG (mmol/L)
LnHcy 0.102 (0.020) <0.001 0.077 (0.022) <0.001 0.075 (0.021) 0.001
Hcy < 15μmol/L Ref. - Ref. - Ref.
-Hcy≥15μmol/L 0.084 (0.018) <0.001 0.061 (0.020) 0.001 0.056 (0.020) 0.004
LnHDL-C (mmol/L)
LnHcy −0.098 (0.010) <0.001 −0.024 (0.010) 0.021 −0.016 (0.010) 0.115
Hcy < 15μmol/L Ref. - Ref. - Ref.
-Hcy≥15μmol/L −0.082 (0.009) <0.001 −0.026 (0.010) 0.003 −0.018 (0.009) 0.038
LnTC (mmol/L)
LnHcy −0.033 (0.007) <0.001 −0.002 (0.008) 0.739 −0.002 (0.008) 0.771
Hcy < 15μmol/L Ref. - Ref. - Ref.
-Hcy≥15μmol/L −0.029 (0.006) <0.001 −0.005 (0.006) 0.486 −0.006 (0.007) 0.691
LnLDL-C (mmol/L)
LnHcy −0.044 (0.010) <0.001 −0.016 (0.011) 0.095 −0.018 (0.012) 0.133
Hcy < 15μmol/L Ref. - Ref. - Ref.
-Hcy≥15μmol/L −0.039 (0.009) <0.001 −0.017 (0.009) 0.080 −0.017 (0.010) 0.071
Model 1 univariate analysis Model 2 adjusted for age and sex
Model 3 adjusted for age, sex, education level, physical activity, vitamin B supplement, body mass index, pulse, fasting glucose, smoking status, drinking status, systolic blood pressure, diastolic blood pressure, serum creatinine
Abbreviations:TCTotal cholesterol,TGTriglycerides,HDL-CHigh density lipoprotein cholesterol,LDL-CLow density lipoprotein cholesterol,HcyHomocysteine
Table 3Multivariate Logistic Regression for Effects of Hcy on Dyslipidemia
Model 1 Model 2 Model 3
OR (95% CI) P OR (95% CI) P OR (95% CI) P
TG≥1.70 (mmol/L)
LnHcy 1.391 (1.192, 1.623) <0.001 1.327 (1.117, 1.576) 0.001 1.267 (1.051, 1.525) 0.013
Hcy < 15μmol/L Ref. - Ref. - Ref.
-Hcy≥15μmol/L 1.377 (1.195, 1.586) <0.001 1.324 (1.136, 1.544) <0.001 1.293 (1.096, 1.524) 0.002
HDL-C <1.04 (mmol/L)
LnHcy 2.167 (1.797, 2.614) <0.001 1.301 (1.049, 1.614) 0.017 1.277 (1.013, 1.613) 0.039
Hcy < 15μmol/L Ref. - Ref. - Ref.
-Hcy≥15μmol/L 2.114 (1.769, 2.526) <0.001 1.401 (1.154, 1.701) <0.001 1.406 (1.143, 1.728) 0.001
TC≥5.18 (mmol/L)
LnHcy 0.746 (0.645, 0.864) <0.001 0.991 (0.840, 1.168) 0.910 0.950 (0.798, 1.130) 0.562
Hcy < 15μmol/L Ref. - Ref. - Ref.
-Hcy≥15μmol/L 0.754 (0.660, 0.862) <0.001 0.930 (0.804, 1.075) 0.326 0.908 (0.779, 1.057) 0.214
LDL-C≥3.37 (mmol/L)
LnHcy 0.770 (0.662, 0.894) <0.001 0.906 (0.766, 1.072) 0.250 0.904 (0.757, 1.080) 0.265
Hcy < 15μmol/L Ref. - Ref. - Ref.
-Hcy≥15μmol/L 0.716 (0.624, 0.821) <0.001 0.869 (0.750, 1.007) 0.061 0.910 (0.774, 1.071) 0.256
Model 1 univariate analysis Model 2 adjusted for age and sex
Model 3 adjusted for age, sex, education level, physical activity, vitamin B supplement, body mass index, pulse, fasting glucose, smoking status, drinking status, systolic blood pressure, diastolic blood pressure, serum creatinine
results to the general population. Additionally, most prior studies conducted univariate analysis or multivari-ate analysis adjusting for few confounders. Our study not only excluded subjects with lipid-lowering drugs which is one of the most important confounders, but also included many additional coviarates such as FBG, BMI, kidney function, physical activity, among others.
There are many experimental foundations that provide support for the hypothesis that Hcy affects lipid metab-olism. (1) Prior study results suggest the mechanisms for HHcy are mainly related to the down regulation of key players in HDL production (Apo-AI, lecithin-cholesterol acyltransferase (LCAT)) [30] and the reducing of the liver Apo-AI mRNA expression [31]. (2) The inhibition of PC conversion to PE and the low ratio of PE/PC caused by HHcy are key issues in the relationship be-tween HHcy and triglycerides accumulation [32, 33].(3) Hcy has been found to enhance the expression of sterol regulatory element-binding proteins (SREBPs) to increase intracellular accumulation of TC and TG [34]. (4) Hcy causes protein misfolding in the endoplasmic reticulum and oxidative stress, which might affect lipoprotein par-ticle production [34–38]. (5) Global DNA hypomethyla-tion has been suggested as a mechanism linking Hcy to lipid disorders and atherosclerosis in vascular smooth muscle cells [39]. (6) Plasma concentrations of TG have significantly important effects on the distribution of HDL subclasses, and HDL maturation might be abnormal and reverse cholesterol transport might be weakened in HTG patients [40]. Consequently, the findings in the present study might partially be explained by the interaction be-tween TG and HDL-C.
The present study also has several limitations. It was a cross-sectional study, thus predictions about the incidence of dyslipidemia due to HHcy in the community-based population cannot be made from this study. Additionally, serum lipid profiles might relate to dietary habits that were not assessed in detail due to lack of such data. Fur-ther follow-up data in this cohort as well as independent replication are needed.
Conclusion
The present study showed that HHcy status is indepen-dently associated with hypertriglyceridemia and low HDL-C levels, which provides evidence that Hcy might affect HDL-C and TG metabolism.
Acknowledgements
The authors thank all study team members for their participation. We are especially grateful to the site managers of Gucheng and Pingguoyuan Community Health Centers for their supports.
Funding
This study was supported by a grant from the University of Michigan-Peking University Health Science Center (UM-PUHSC) joint institute for translational and clinical research (grant No: BMU20110177).
Availability of data and materials
We are sorry to inform you that we cannot accept the data sharing policy due to the lack of consent from other cooperating research partners.
Authors’contributions
MM participated in the design of the study, performed the statistical analysis, and drafted the manuscript. JJ participated in the epidemical survey, data management, and helped to draft the manuscript. JD participated in collecting blood samples and conducting the lipid testing. JL and YH participated in the study design and helped to draft the manuscript. DC participated in data management and helped with statistical analysis. FF participated in implementing the investigation, data analysis, and drafting the manuscript. YZ, who is principal investigator of this study, conceived of the study, and participated in its design and coordination, and helped to analyze data and draft the manuscript. All authors read and approved the final manuscript.
Competing interests
The authors declare that they have no competing interests.
Consent for publication
Not applicable.
Ethics approval and consent to participate
The proposal was approved by the ethics committee of Peking University and Peking University First Hospital, and all subjects signed informed consent before enrollment. We adhered to the principles of the Declaration of Helsinki. The procedures followed were in accordance with institutional guidelines.
Publisher’s Note
Springer Nature remains neutral with regard to jurisdictional claims in published maps and institutional affiliations.
Author details 1
Department of Cardiology, Peking University First Hospital, Beijing, China.
2Department of Epidemic & Biostatistics, School of Public Health, Peking
University Health Science Center, Beijing, China.3Department of
Endocrinology, Chinese People’s Liberation Army (PLA) General Hospital, Beijing, China.
Received: 10 August 2016 Accepted: 2 March 2017
References
1. Antoniades C, Antonopoulos AS, Tousoulis D, Marinou K, Stefanadis C. Homocysteine and coronary atherosclerosis: from folate fortification to the recent clinical trials. Eur Heart J. 2009;30(1):6–15.
2. Wierzbicki AS. Homocysteine and cardiovascular disease: a review of the evidence. Diab Vasc Dis Res. 2007;2007:143.
3. Obeid R, Herrmann W. Homocysteine and lipids: S-adenosyl methionine as a key intermediate. FEBS Lett. 2009;583(8):1215–25.
4. Xiao Y, Zhang Y, Lv X, et al. Relationship between lipid profiles and plasma total homocysteine, cysteine and the risk of coronary artery disease in coronary angiographic subjects. Lipids Health Dis. 2011;10:137.
5. Herrmann W, Obeid R, Hubner U, Jouma M, Geisel J. Homocysteine in relation to C-reactive protein and low-density lipoprotein cholesterol in assessment of cardiovascular risk. Cell Mol Biol (Noisy-le-grand). 2004;50(8):895–901.
6. Daly C, Fitzgerald AP, O’Callaghan P, Collins P, Cooney MT, Graham IM. Homocysteine increases the risk associated with hyperlipidaemia. Eur J Cardiovasc Prev Rehabil. 2009;16(2):150–5.
7. Barter PJ, Rye KA. Homocysteine and cardiovascular disease: is HDL the link? Circ Res. 2006;99(6):565–6.
8. Liao D, Tan H, Hui R, et al. Hyperhomocysteinemia decreases circulating high-density lipoprotein by inhibiting apolipoprotein A-I Protein synthesis and enhancing HDL cholesterol clearance. Circ Res. 2006;99(6):598–606.
10. Fan F, Qi L, Jia J, et al. Noninvasive Central Systolic Blood Pressure Is More Strongly Related to Kidney Function Decline Than Peripheral Systolic Blood Pressure in a Chinese Community-Based Population. Hypertension. 2016; 67(6):1166–72.
11. China Adult Dyslipidemia Prevention Guideline. Chin J Cardiol. 2007;35(05): 390–419.
12. Yang B, Fan S, Zhi X, et al. Prevalence of hyperhomocysteinemia in China: a systematic review and meta-analysis. Nutrients. 2015;7(1):74–90.
13. Wang X, Ye P, Cao R, et al. Triglycerides are a predictive factor for arterial stiffness: a community-based 4.8-year prospective study. Lipids Health Dis. 2016;15:97.
14. Song Q, Liu X, Wang A, et al. Associations between non-traditional lipid measures and risk for type 2 diabetes mellitus in a Chinese community population: a cross-sectional study. Lipids Health Dis. 2016;15:70. 15. Jiang B, Li B, Wang Y, et al. The nine-year changes of the incidence and
characteristics of metabolic syndrome in China: longitudinal comparisons of the two cross-sectional surveys in a newly formed urban community. Cardiovasc Diabetol. 2016;15(1):84.
16. Watanabe M, Osada J, Aratani Y, et al. Mice deficient in cystathionine beta-synthase: animal models for mild and severe homocyst(e)inemia. Proc Natl Acad Sci U S A. 1995;92(5):1585–9.
17. Namekata K, Enokido Y, Ishii I, Nagai Y, Harada T, Kimura H. Abnormal lipid metabolism in cystathionine beta-synthase-deficient mice, an animal model for hyperhomocysteinemia. J Biol Chem. 2004;279(51):52961–9.
18. Wang H, Jiang X, Yang F, et al. Hyperhomocysteinemia accelerates atherosclerosis in cystathionine beta-synthase and apolipoprotein E double knock-out mice with and without dietary perturbation. Blood.
2003;101(10):3901–7.
19. Mikael LG, Wang XL, Wu Q, Jiang H, Maclean KN, Rozen R.
Hyperhomocysteinemia is associated with hypertriglyceridemia in mice with methylenetetrahydrofolate reductase deficiency. Mol Genet Metab. 2009;98(1–2):187–94.
20. Frauscher G, Karnaukhova E, Muehl A, Hoeger H, Lubec B. Oral
administration of homocysteine leads to increased plasma triglycerides and homocysteic acid-additional mechanisms in homocysteine induced endothelial damage? Life Sci. 1995;57(8):813–7.
21. Qujeq D, Omran TS, Hosini L. Correlation between total homocysteine, low-density lipoprotein cholesterol and high-low-density lipoprotein cholesterol in the serum of patients with myocardial infarction. Clin Biochem. 2001;34(2):97–101. 22. Mahalle N, Kulkarni MV, Garg MK, Naik SS. Vitamin B12 deficiency and
hyperhomocysteinemia as correlates of cardiovascular risk factors in Indian subjects with coronary artery disease. J Cardiol. 2013;61(4):289–94. 23. Real JT, Martinez-Hervas S, Garcia-Garcia AB, et al. Association of C677T
polymorphism in MTHFR gene, high homocysteine and low HDL cholesterol plasma values in heterozygous familial hypercholesterolemia. J Atheroscler Thromb. 2009;16(6):815–20.
24. Anan F, Masaki T, Umeno Y, et al. Correlations between homocysteine levels and atherosclerosis in Japanese type 2 diabetic patients. Metabolism. 2007;56(10):1390–5.
25. Gueant-Rodriguez RM, Spada R, Moreno-Garcia M, et al. Homocysteine is a determinant of ApoA-I and both are associated with ankle brachial index, in an ambulatory elderly population. Atherosclerosis. 2011;214(2):480–5. 26. Huang L, Song XM, Zhu WL, Li Y. Plasma homocysteine and gene
polymorphisms associated with the risk of hyperlipidemia in northern Chinese subjects. Biomed Environ Sci. 2008;21(6):514–20.
27. Yadav AS, Bhagwat VR, Rathod IM. Relationship of plasma homocysteine with lipid profile parameters in ischemic heart disease. Indian J Clin Biochem. 2006;21(1):106–10.
28. de Luis DA, Fernandez N, Arranz ML, Aller R, Izaola O, Romero E. Total homocysteine levels relation with chronic complications of diabetes, body composition, and other cardiovascular risk factors in a population of patients with diabetes mellitus type 2. J Diabetes Complications. 2005;19(1):42–6.
29. Lupton JR, Quispe R, Kulkarni K, Martin SS, Jones SR. Serum homocysteine is not independently associated with an atherogenic lipid profile: The Very Large Database of Lipids (VLDL-21) study. Atherosclerosis. 2016;249:59–64. 30. Velez-Carrasco W, Merkel M, Twiss CO, Smith JD. Dietary methionine effects
on plasma homocysteine and HDL metabolism in mice. J Nutr Biochem. 2008;19(6):362–70.
31. Mikael LG, Genest Jr J, Rozen R. Elevated homocysteine reduces apolipoprotein A-I expression in hyperhomocysteinemic mice and in males with coronary artery disease. Circ Res. 2006;98(4):564–71.
32. Nishimaki-Mogami T, Suzuki K, Takahashi A. The role of
phosphatidylethanolamine methylation in the secretion of very low density lipoproteins by cultured rat hepatocytes: rapid inhibition of
phosphatidylethanolamine methylation by bezafibrate increases the density of apolipoprotein B48-containing lipoproteins. Biochim Biophys Acta. 1996;1304(1):21–31.
33. Nishimaki-Mogami T, Yao Z, Fujimori K. Inhibition of phosphatidylcholine synthesis via the phosphatidylethanolamine methylation pathway impairs incorporation of bulk lipids into VLDL in cultured rat hepatocytes. J Lipid Res. 2002;43(7):1035–45.
34. Werstuck GH, Lentz SR, Dayal S, et al. Homocysteine-induced endoplasmic reticulum stress causes dysregulation of the cholesterol and triglyceride biosynthetic pathways. J Clin Invest. 2001;107(10):1263–73.
35. Thampi P, Stewart BW, Joseph L, Melnyk SB, Hennings LJ, Nagarajan S. Dietary homocysteine promotes atherosclerosis in apoE-deficient mice by inducing scavenger receptors expression. Atherosclerosis. 2008;197(2):620–9. 36. Outinen PA, Sood SK, Pfeifer SI, et al. Homocysteine-induced endoplasmic
reticulum stress and growth arrest leads to specific changes in gene expression in human vascular endothelial cells. Blood. 1999;94(3):959–67. 37. Cox JS, Chapman RE, Walter P. The unfolded protein response coordinates
the production of endoplasmic reticulum protein and endoplasmic reticulum membrane. Mol Biol Cell. 1997;8(9):1805–14.
38. Doerrler WT, Lehrman MA. Regulation of the dolichol pathway in human fibroblasts by the endoplasmic reticulum unfolded protein response. Proc Natl Acad Sci U S A. 1999;96(23):13050–5.
39. Yideng J, Jianzhong Z, Ying H, et al. Homocysteine-mediated expression of SAHH, DNMTs, MBD2, and DNA hypomethylation potential pathogenic mechanism in VSMCs. DNA Cell Biol. 2007;26(8):603–11.
40. Tian L, Fu M. The relationship between high density lipoprotein subclass profile and plasma lipids concentrations. Lipids Health Dis. 2010;9:118.
• We accept pre-submission inquiries
• Our selector tool helps you to find the most relevant journal
• We provide round the clock customer support
• Convenient online submission
• Thorough peer review
• Inclusion in PubMed and all major indexing services • Maximum visibility for your research
Submit your manuscript at www.biomedcentral.com/submit