R E S E A R C H
Open Access
A ventilation intervention study in classrooms to
improve indoor air quality: the FRESH study
Jeannette TM Rosbach
1,2, Machiel Vonk
2*, Frans Duijm
2, Jan T van Ginkel
3, Ulrike Gehring
1and Bert Brunekreef
1,4Abstract
Background:Classroom ventilation rates often do not meet building standards, although it is considered to be important to improve indoor air quality. Poor indoor air quality is thought to influence both children’s health and performance. Poor ventilation in The Netherlands most often occurs in the heating season. To improve classroom ventilation a tailor made mechanical ventilation device was developed to improve outdoor air supply. This paper studies the effect of this intervention.
Methods:The FRESH study (Forced-ventilation Related Environmental School Health) was designed to investigate the effect of a CO2controlled mechanical ventilation intervention on classroom CO2levels using a longitudinal cross-over design. Target CO2concentrations were 800 and 1200 parts per million (ppm), respectively. The study included 18 classrooms from 17 schools from the north-eastern part of The Netherlands, 12 experimental classrooms and 6 control classrooms. Data on indoor levels of CO2, temperature and relative humidity were collected during three
consecutive weeks per school during the heating seasons of 2010–2012. Associations between the intervention
and weekly average indoor CO2 levels, classroom temperature and relative humidity were assessed by means of
mixed models with random school-effects.
Results:At baseline, mean CO2concentration for all schools was 1335 ppm (range: 763–2000 ppm). The intervention was able to significantly decrease CO2levels in the intervention classrooms (F (2,10) = 17.59, p < 0.001), with a mean decrease of 491 ppm. With the target set at 800 ppm, mean CO2was 841 ppm (range: 743–925 ppm); with the target set at 1200 ppm, mean CO2was 975 ppm (range: 887–1077 ppm).
Conclusions:Although the device was not capable of precisely achieving the two predefined levels of CO2, our study showed that classroom CO2levels can be reduced by intervening on classroom ventilation using a CO2controlled mechanical ventilation system.
Keywords:Ventilation, Schools, Carbon dioxide, Indoor air quality, Intervention
Background
Children spend much of their time in schools; it is the indoor environment where they spend most of their time besides in their home. It is therefore important that schools have a good indoor air quality (IAQ). Classroom ventilation was already recognised as an important determinant of indoor air quality in the beginning of the 20th century [1]; however, even recent studies showed that classroom ventilation rates do not meet building standards. Two studies performed in The Netherlands in 2007 showed that more than 80% of
the schools exceeded CO2levels of 1200 parts per million (ppm) during classroom occupation [2,3], which in The Netherlands is the advised maximum CO2concentration for classrooms [4,5].
Poor IAQ has found to be associated with a negative impact on health [6,7]. However, these reviews mainly focussed on office buildings and their occupants. Daisey et al. [8] reviewed the literature published until 1999 with a specific focus on schools. With respect to ventilation, most studies merely investigated the amount of ventilation and conclude that ventilation is inadequate in many classrooms, which may possibly lead to health related symptoms. As of 1999, Daisy et al. [8] found two studies that specifically looked at the relationship between * Correspondence:machiel.vonk@ggd.groningen.nl
2
Department of Environmental Health, Municipal Health Services Groningen, P.O. Box 584, 9700 AN, Groningen, The Netherlands
Full list of author information is available at the end of the article
ventilation and the prevalence of health related symptoms. However, the results of these two studies were incon-sistent and thus the authors stress the need of more studies looking into the relationship between IAQ in schools and health. The recent review of Sundell et al. [9] looked into the available literature until 2005 and discussed five articles that have studied the school environment. They concluded from these studies that low ventilation rates are associated with increased absenteeism and more respiratory symptoms in school children, but emphasise that there is too little data available to make firm conclusions. Furthermore, they also stressed the need for more studies on the relationship between ventilation and health, especially in buildings other than offices. Since 2005, more studies on the relationship between ventilation of schools and health have been published, for example two articles relating ventilation rates in schools to illness absenteeism of the students [10,11]. Both of these studies found that lower ventilation rates are associated with higher absenteeism. Another study, on the effect of the implementation of a new ventilation system in schools, found that after installation less asthmatic symptoms were reported and exposure to airborne pollutants decreased [12].
Apart from the effects of IAQ on health, research has also focussed on the effects of ventilation on human performance. Mendell and Heath [13] reviewed the lit-erature available until 2003 on the possible effects of poor IAQ on students’performance and concluded that there is suggestive evidence for an association between ventilation rates and the attention and performance of students, two prerequisites of an efficient learning process. Since this review, various papers have been published regarding this topic. An observational study reported an association between classroom ventilation rates and students’achievements on a standardised academic per-formance test. Based on their study the authors suggest a linear relationship between poorer classroom ventilation and lower academic achievement [14]. Four studies have used an experimental design [15-18]. Findings of these studies are inconsistent, but comparisons of the studies are difficult due to differences in study design and outcome parameters.
The levels of CO2 that exist indoor have long been thought to have no direct impact on occupant’s health or performance [19], but to be primarily an indicator of the level of ventilation. It has been hypothesised that the observed associations between ventilation levels and health or performance result from the fact that ventilation does not only affect the level of indoor CO2, but also levels of other pollutants in the indoor environment that are able to cause these adverse effects [20]. However, Satish et al. [20] conducted a laboratory experiment on the direct effects of CO2 at normally occurring indoor
concentrations on human decision making. Their study suggests that, compared to CO2concentrations of 600 ppm, at 1000 ppm and 2500 ppm a reduction in decision-making performance occurs. This may indicate the importance of considering CO2in itself as an air pollutant. However, they stress that confirmation of their findings is needed.
Since there is still a need for more experimental evidence with respect to the relationship of classroom ventilation and its effect on both respiratory health and cognitive performance, the FRESH study (Forced-ventilation Related Environmental School Health) was designed. The aim of this study is to investigate whether an intervention can be used to improve classroom IAQ by increasing classroom ventilation and whether this intervention affects children’s cognitive performance and/or respiratory health. In this paper, we focus on the performance of the ventilation system in terms of achieved classroom CO2concentrations.
Methods
Study design
The FRESH study has been designed as an intervention study with two experimental groups and one control group. Differences between the two experimental groups were created using a cross-over design. Data collection for this study took place at 17 primary schools during the heating seasons (October-April) of 2010–2011 and 2011–2012. In the first school year, ten schools participated, in the second year eight. One school participated in both the first and the second year, but with a different student population. With this exception, per school, one classroom was studied, with repeated measurements during three consecutive weeks. The first week served as baseline period, with measurements of normally existing CO2 levels and ventilation according to the teachers own preference. In the following two weeks, in the 12 intervention classrooms the concentrations of CO2 were maintained at pre-set levels of 800 and 1200 ppm, established with a mobile, custom-made mechanical ventilation device. During these weeks, the teachers were asked not to ventilate the classroom by opening doors or windows. In the six schools that acted as the control group, no intervention on ventilation took place. In these classrooms, CO2levels were monitored and teachers were allowed to ventilate as they preferred.
Participating schools
in the second year of the study, one school (but with a different student population) participated again. Schools were randomly selected, excluding those that were within 250 m of a busy road or highway. A total of 80 schools were asked to participate before the planned number of 18 classrooms was achieved (23% response). Many schools that did not participate in the study valued the FRESH study as important, but were too busy to take part in the (relatively invasive) FRESH study. Schools were randomly allocated to the three study arms, but were allocated to the control arm when for practical reasons it was not possible to install the ventilation system (4 schools). The exact size of the classrooms has not been measured, but classrooms in The Netherlands measure approximately 50 m2. The average number of students in the studied classrooms was 26, per classroom one teacher was present. All studied classrooms relied on natural ventila-tion through opening doors and windows to provide fresh air. Table 1 provides more information on the schools.
Intervention
In 12 schools we changed the classroom ventilation, using a specially designed and installed mechanical ventilation device. Based on a design of providing a stable ventilation flow with an adjustable outdoor air supply rate, this device consisted of an exterior constant flow fan (LAAHP12, Shandong LARK Central Air Condition Co., China) placed outdoors. Within the device outdoor air was mixed with indoor air derived from the classroom via the return system. The mixing ratio between indoor and
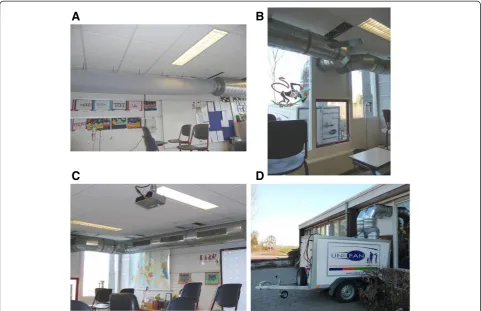
outdoor air was depended on the setting of the targeted CO2concentration and was adjusted by means of a valve in the inlet of the outdoor air supply system. The mixture of indoor and outdoor air was than heated before being introduced into the classroom with a flow of approximately 1400 m3/h. Simple ducting (diameter 355 mm) lead the air without filtering into the building through a tailor made window pane. In the classrooms, the air was distributed through a flexible, perforated fabric air sock. A non-flexible duct was used for air exhaust. Both the air sock and exhaust duct were attached to the ceiling of the classroom. In Figure 1 the ventilation device and the installation within a classroom are shown.
The device was CO2 controlled, using a real-time, self-calibrating CO2 sensor (Telair 6613 CO2 module, GE Measurement & Control, USA) to adjust the amount of outdoor air supplied, in order to achieve a target steady-state CO2concentration in the classroom. This CO2 sensor was located at one of the walls of the classroom, at approximately 1.5 m from the floor, where possible not close to windows and doors. By means of the recirculation and constant air flow blinding of students, teachers and field investigators to the level of outdoor air supply was established. As classrooms in The Netherlands have approximately the same size, one single ventilation flow was chosen (approximately 1400 m3/h) that was enough to realise the targeted CO2concentration without creating disturbingly high air flows within the classroom.
For this study, pre-set levels of 800 and 1200 ppm CO2were defined. The lower level represents the level
Table 1 School characteristics
School n students Study region Condition Study period
E1 31 Zwolle Intervention 1 (800–1200) Jan 2011
E2 27 Zwolle Intervention 1 (800–1200) March 2011
E3 22 Zwolle Intervention 1 (800–1200) Nov 2011
E4 30 Groningen Intervention 1 (800–1200) Jan 2011
E5 27 Groningen Intervention 1 (800–1200) Jan 2012
E6 25 Groningen Intervention 1 (800–1200) March 2012
E7 23 Zwolle Intervention 2 (1200–800) Feb 2012
E8 23 Zwolle Intervention 2 (1200–800) March 2012
E9 22 Zwolle Intervention 2 (1200–800) Jan 2012
E10 23 Groningen Intervention 2 (1200–800) Nov 2010
E11 29 Groningen Intervention 2 (1200–800) March 2011
E12 29 Groningen Intervention 2 (1200–800) Nov 2011
C1 36 Zwolle Control Oct 2010
C2 25 Zwolle Control Jan 2011
C3 22 Zwolle Control March 2011
C4 28 Groningen Control Jan 2011
C5 18 Groningen Control March 2011
advised by the joint Dutch Municipal Health Services. The upper level represents the basis on which Dutch Building Regulations have formulated the minimal achiev-able air flow for the design of new schools [4,5]. To main-tain a cross-over in the design, in half of the classrooms, we started ventilating at 800 ppm, the other six schools started with a setting of 1200 ppm. In the third week of the study, the ventilation regime changed.
To prevent thermal discomfort and create a more or less stable classroom temperature, the device was equipped with an air pump able to both heat and cool the outdoor air before it was introduced into the classrooms. Classroom temperature was set at 21°C, to minimize differences between the schools. Based on measurements of a real-time temperature sensor (located at the same position as the CO2 sensor) cooling or heating of the supplied air was adjusted according to the classroom temperature. As the experiment was carried out in winter seasons, class-room temperature was higher than outdoor temperature. Even though no measurements were performed of the exact temperature of supplied air, it is to be expected that this air was heated. When classroom temperature exceeded 21°C, colder air was supplied to lower the indoor temp-erature. Furthermore, the system was designed to maintain
system noise below 35 dB (A). This value has shown to be the threshold for annoyance and disturbance [21].
Indoor measurements
During the study weeks, each classroom was equipped with two data loggers (GRP-300 Pro (ATAL, The Netherlands) in study region 1 and ATV-IAQ set (ATAL, The Netherlands) in study region 2) for CO2, temperature and relative humidity. These data loggers were calibrated each year by the manufacturer. The loggers were positioned as much as possible at the height of the desks of the pupils and on the opposite sides of the classroom. Log interval was 4 minutes. From the two data loggers the average was taken to represent classroom CO2, temperature and relative humidity. All data reported in this paper are restricted to periods of actual classroom occupation excluding breaks and periods when students were elsewhere (e.g. gym).
Outdoor measurements
The selected schools were not located to obvious sources of CO2, therefore no continuous measurements of outdoor CO2concentrations were performed. To get an indication of outdoor CO2concentrations, short time frame measure-ments of approximately 5 minutes were performed just
A
B
C
D
outside the school building, using the same type of CO2 data loggers that were used for indoor measurements. Measurements took place at the beginning and end of each week. Data on 24 h-average outdoor temperature and relative humidity were obtained from the two weather stations (Eelde and Hoogeveen) of the Royal Netherlands Meteorological Institute closest to the study regions.
Ethical approval
The study design and protocols have approved by the ‘Central Committee on Research involving Human Sub-jects’(CCMO, The Hague) on February 23, 2010 and is registered under number 120620026.
Statistical analysis
The data were analysed using PASW Statistics 18 and SAS 9.2. Significance was tested against anα= 0.05. The effect of the intervention, as well as differences between the two settings of the intervention (800 ppm and 1200 ppm) were tested by means of mixed models with random school intercepts to take into account the dependency of the repeated measurements performed in the same classrooms.
Results
Mean indoor CO2concentrations, temperature and relative humidity during classroom occupation per school per week are presented in Tables 2, 3 and 4.
During the first week (baseline) mean classroom CO2 concentration was 1335 ppm (sd = 325) with a range of 763–2000 ppm. In the classrooms allocated to become intervention schools, mean CO2concentration was 1399 ppm (sd = 350), the control classrooms had an average CO2concentration of 1208 ppm (sd = 244). Only two classrooms (E10 and C5) had mean CO2 concentration lower than 800 ppm at baseline, and another five classrooms had mean CO2concentrations lower than 1200 ppm.
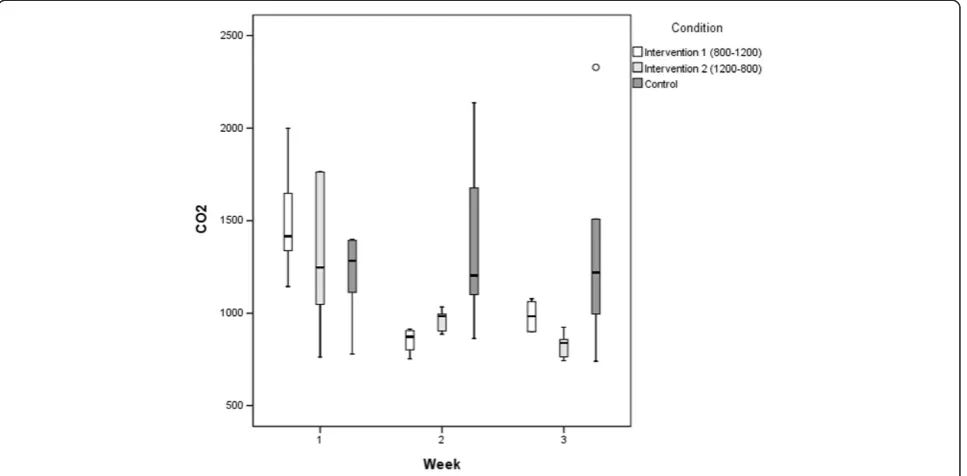
In the second week, we started the intervention in 12 classrooms. In those 12 classrooms, on average we decreased mean CO2with 491 ppm compared to baseline (sd = 324, range: -1085–124 ppm). With the setting of the ventilation set at 800 ppm, the average CO2concentration was 841 ppm (sd = 65) with a range of 743–925 ppm. When set at 1200 ppm, the average CO2 concentration was 975 ppm (sd = 73, range: 887–1077 ppm). In the control classrooms, during the second and third week, CO2concentrations ranged from 740 to 2328 ppm, with an average mean CO2concentration of 1350 ppm (sd = 486). Figure 2 displays the boxplot of CO2 concentrations per condition per week. The P98 results confirm that the ventilation device was able to maintain a maximum level of 1200 ppm CO2, whereas it was more difficult to keep CO2levels below 800 ppm (Table 2).
Table 5 provides the results from our mixed model analysis. From this analysis we can conclude that
Table 2 Mean indoor CO2concentration (ppm) per school per week
Week 1 Week 2 Week 3
School Condition n mean sd P98 n mean Sd P98 n mean sd P98
E1 Intervention 1 (800–1200) 344 1365 531 2991 344 902 85 1128 280 899 83 1051
E2 352 1337 460 2351 345 802 74 903 294 908 158 1126
E3 286 1143 398 2052 285 753 78 902 320 900 99 1085
E4 215 1648 353 2395 312 843 48 930 350 1059 99 1203
E5 347 1466 330 2322 295 906 147 1347 257 1063 134 1276
E6 255 2000 602 3321 270 915 44 993 297 1077 96 1195
E7 Intervention 2 (1200–800) 356 1323 291 1963 356 993 140 1221 356 820 85 937
E8 354 1049 158 1313 321 905 130 1124 353 743 87 887
E9 265 1763 423 2507 301 975 84 1159 336 764 51 853
E10 222 763 131 1153 272 887 119 1150 334 858 76 938
E11 367 1762 625 3064 352 995 151 1168 336 858 105 1018
E12 347 1171 213 1553 343 1034 108 1182 309 925 70 1045
C1 Control 380 1393 483 2446 379 2137 591 3179 379 2328 483 3197
C2 342 1176 289 1694 342 1100 255 1523 342 1249 347 1838
C3 351 1112 333 1789 335 1132 304 1827 327 996 240 1527
C4 350 1389 425 2264 340 1274 357 1982 340 1191 389 2362
C5 353 779 177 1166 328 864 159 1234 312 740 151 1098
Table 3 Mean indoor temperature (°C) per school per week
Week 1 Week 2 Week 3
School Condition n mean sd n mean sd n mean sd
E1 Intervention 1 (800–1200) 344 20.2 1.4 344 20.3 0.9 280 20.3 0.9
E2 352 21.1 1.1 345 19.1 0.8 294 19.1 0.8
E3 286 21.0 0.9 285 19.3 1.7 320 19.3 1.7
E4 215 19.2 1.1 312 18.5 1.2 350 18.5 1.2
E5 347 21.2 1.1 295 21.4 1.5 257 21.4 1.5
E6 255 20.4 1.0 270 20.2 0.5 297 20.2 0.5
E7 Intervention 2 (1200–800) 356 21.6 0.9 356 20.4 1.0 356 20.4 1.0
E8 354 19.2 0.8 321 19.7 1.2 353 19.7 1.2
E9 265 21.8 1.5 301 20.8 1.9 336 20.8 1.9
E10 222 23.0 0.8 272 23.3 0.9 334 23.3 0.9
E11 367 20.9 1.1 352 20.8 1.3 336 20.8 1.3
E12 347 22.0 1.3 343 21.1 0.8 309 21.1 0.8
C1 Control 380 22.6 1.2 379 20.6 1.5 379 20.6 1.5
C2 342 21.2 0.8 342 20.7 0.6 342 20.7 0.6
C3 351 19.8 1.3 335 20.1 1.6 327 20.1 1.6
C4 350 20.9 0.6 340 21.8 0.8 340 21.8 0.8
C5 353 20.4 1.2 328 22.3 0.6 312 22.3 0.6
C6 282 19.7 1.0 344 20.1 1.0 336 20.1 1.0
Table 4 Mean indoor relative humidity (%) per school per week
Week 1 Week 2 Week 3
School Condition n mean sd n mean sd n mean sd
E1 Intervention 1 (800–1200) 344 33.6 6.4 344 38.0 11.7 280 30.3 4.0
E2 352 30.4 6.2 345 28.3 10.4 294 44.9 6.8
E3 286 54.4 5.6 285 41.5 7.6 320 32.0 8.6
E4 215 45.5 7.8 312 35.3 6.8 350 37.3 4.2
E5 347 49.8 6.2 295 30.7 4.0 257 32.7 3.2
E6 255 48.2 3.4 270 40.2 3.4 297 42.1 4.4
E7 Intervention 2 (1200–800) 356 40.1 5.6 356 27.9 4.6 356 29.2 3.0
E8 354 42.7 3.9 321 42.4 3.7 353 40.4 3.0
E9 265 27.1 4.4 301 15.7 3.0 336 30.2 2.9
E10 222 48.7 4.0 272 31.4 2.9 334 32.6 1.6
E11 367 46.6 7.9 352 31.4 7.3 336 39.9 7.5
E12 347 53.8 4.7 343 41.9 4.8 309 33.0 5.9
C1 Control 380 62.3 2.9 379 54.6 4.5 379 55.0 2.2
C2 342 33.4 6.5 342 32.7 6.3 342 37.3 4.2
C3 351 42.3 4.3 335 43.7 6.5 327 47.0 6.3
C4 350 37.1 4.4 340 39.6 7.6 340 36.0 5.7
C5 353 35.9 4.1 328 35.8 6.9 312 40.1 5.3
classroom CO2 levels were statistically significantly decreased during the intervention (F (2,10) = 17.59, p < 0.001). Compared to baseline, the estimated mean decrease in CO2 with the setting at 800 ppm was 558 ppm (SE = 97.8). For the setting of 1200 ppm, the estimated mean decrease was 424 ppm (SE = 97.8). The mean difference in decrease compared to baseline between the two settings of the intervention was 134 ppm (SE = 29.3, t (10) = 4.57, p = 0.001).
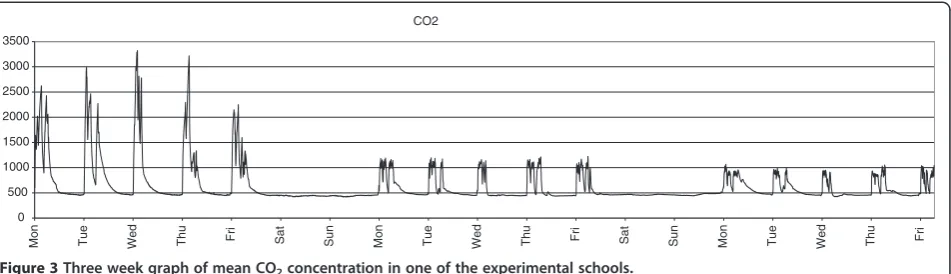
The result of implementation of the ventilation interven-tion and its effect on the CO2in a classroom is illustrated in Figure 3. This graph displays the CO2 concentration during the three weeks of the study in one of the experimental classrooms. The graph shows how in the first week, high CO2 peak concentrations exist, which no longer occur during the second and third week. Also, it shows how the CO2concentrations are much more stable in the two intervention weeks. Furthermore, the graph shows the (slight) difference in CO2concentration during the second (ventilation set at 1200 ppm) and third (800 ppm) week.
The intervention was designed in such way that class-room temperature did not decrease as a result of supplying
(cold) outdoor air. At baseline, average indoor temperature was 20.9°C (sd = 1.1, range: 19.2–23.0°C). In the interven-tion classrooms average temperature during weeks two and three was 20.6°C (sd = 1.0, range: 18.5–23.3°C), in the control classrooms average temperature was 20.9°C (sd = 1.2, range: 18.5–22.5°C). No significant effect of the intervention on classroom temperature was found (F (2,10) = 2.13, p = 0.170), nor on differences between the two intervention settings (Table 5).
Indoor relative humidity at baseline was 42.2% (sd = 9.9, range: 27.1–62.3%), in weeks two and three average relative humidity was 41.2% (sd = 8.0, range: 29.4–55.0%) in the control classrooms and 34.5% (sd = 6.6, range: 16.7–44.9%) in the intervention classrooms. This decrease in relative humidity due to the intervention appeared to be statistically significant (F (2,10) = 4.16, p = 0.049). No significant difference between the two intervention conditions was found (Table 5).
During the study, outdoor CO2 concentration was on average 471 ppm (sd = 53, range: 350–660 ppm), mean outdoor temperature was 4.7°C (sd = 5.1, range: -12.7– 16.9°C), and mean outdoor relative humidity was 87.1% (sd = 8.5, range: 54–100%).
Figure 2Boxplot of mean CO2concentration per condition per week.
Table 5 Mean decrease of CO2(ppm), temperature (°C) or relative humidity (%) compared to baseline measurements
CO2(ppm) T (°C) RH (%)
Setting mean decrease SE p mean decrease SE p mean decrease SE p
800 ppm 558 97.8 <0.001 0.56 0.35 0.144 8.5 2.4 0.005
1200 ppm 424 97.8 0.002 0.10 0.35 0.784 9.3 2.4 0.003
Discussion
This study showed that it is possible to use a portable, tailor made mechanical ventilation device to improve outdoor air supply in schools during the heating season. In the classrooms where we intervened we found an average decrease of 491 ppm CO2 with, however, little difference between the two experimental conditions. The target value of 1200 ppm was more than met, however the target value of 800 ppm proved to be more difficult to achieve. To what extent this is due to differences in CO2concentrations measured at the location of the system sensor and the location of our two data loggers we do not know as the system sensor was unable to log the CO2concentrations, nor was it equipped with a display enabling us to read measured CO2 concentrations by the system sensor. Another possible explanation could be that the ventilation device appeared to have not enough capacity to lower CO2concentration to 800 ppm during classroom occupation. Technical specifications suggest that this should not have been the case, however, we did not measure true air displacement of our instal-lation in the field as we focussed our study design on obtaining specific indoor CO2concentrations rather than on achieving specific ventilation rates.
In all but one classroom, the intervention was able to decrease CO2concentration. The level of decrease varied per classroom, as this is related to CO2 concentration measured at baseline. The highest decrease in CO2 concentration was observed in school E6, where we lowered mean CO2 concentration from 2000 ppm to 915 ppm. In one school CO2 levels slightly increased after implementation of the intervention (school E10), this however was due to the high ventilation rate in the baseline week which produced low CO2concentrations that we did not need to lower further. In seven schools we found baseline CO2concentrations lower than 1200 ppm, in two schools the average CO2 concentration in the first week was lower than 800 ppm. This number is higher that we had expected based on the studies from 2007 [2,3]. It is plausible that since 2007 ventilation
behaviour in schools has improved. The study by Versteeg [2] resulted in media-attention and a political debate in the Dutch government. Moreover, it could well be that the participation in the FRESH study directly influenced the teachers’(and pupils’) awareness of the importance of proper classroom ventilation, resulting in relatively low baseline CO2 concentrations. The decreased relative humidity indoors during the intervention period may be explained by differences in outdoor and indoor temperature between baseline and intervention periods. Especially in cold climates, low indoor relative humidity is associated with increased ventilation rates [7].
Recently various other classroom ventilation intervention studies have been published, most of them predefined a contrast aimed to be achieved by the intervention. One of these studies, by Twardella et al. [16] adjusted the mechanical ventilation within 20 classrooms of six schools. They either up- or down-regulated the ventilation to achieve CO2 levels of < 1000 ppm (‘better than usual’) or CO2 concentrations of 2000 to 2500 ppm (‘worse than usual’). Each condition was implemented for 2 days. They report that it was difficult to regulate the ventilation in such way that the targeted CO2 levels were achieved: only on half of the days of the ‘worse than usual’ condition CO2 concentrations were higher than 2000 ppm and on 22 (of the 40) days of the‘better than usual’ condition CO2 concentrations were below 1000 ppm. Wargocki and Wyon [22] performed three experiments in which they also adjusted the existing outdoor air supply of the mechanical ventilation of schools by altering the fan capacity. They aimed on increasing ventilation rates from approximately 3 to 10 L/s per person. Using a general mass balance equation from measured CO2concentrations, they were able to estimate the actual effective ventilation rates. In the first experiment estimated mean effective ventilation rates were 4 L/s and 8.5 L/s per person, in the second experiment these ventilation rates were 3 L/s and 6.5 L/s per person and in the third experiment 5 L/s and 9.5 L/s per person. This shows that while they aimed for a threefold increase 0 500 1000 1500 2000 2500 3000 3500 Mo n Tu e We d Th u Fr i Sa t Su n Mo n Tu e We d Th u Fr i Sa t Su n Mo n Tu e We d Th u Fr i CO2
of the ventilation rates, the estimated actual effective ventilation rates were doubled. Bakó-Biró et al. [15] intervened upon classroom ventilation using an instal-lation similar to the one we used in the FRESH study. The biggest difference with our study is that they did not adjust ventilation to achieve predefined levels of CO2, but used the installation to either supply fresh air or recirculate the indoor air in a blinded fashion. As this study aimed at comparing high and low levels of outdoor air supply, with their intervention set at recirculation, they were able to achieve big differences in CO2concentration between the two experimental conditions. In their study, Smedje and Norbäck were able to study the change in indoor air quality in schools that renewed their ventilation system [12]. They observed that air exchange rates im-proved, and that associated CO2concentrations decreased on average by 270 ppm due to a new ventilation system. Furthermore, they also reported a significant decrease in relative humidity in schools with a new ventilation system (-10%), compared to schools that did not change their ventilation system (-2%).
Conclusions
Various studies, including our own, show that intervening on classroom ventilation is effective if one wants to change indoor CO2 concentrations. Furthermore, both our own study and the studies of Twardella et al. [16] and Wargocki and Wyon [22] show that field experiments are not comparable with laboratory experiments and that it can be challenging to execute the study as designed. Altogether, our study has shown that classrooms CO2 levels can be significantly reduced by installing a CO2controlled mechanical ventilation system.
Abbreviations
IAQ:Indoor air quality; ppm: Parts per million; FRESH: Forced-ventilation related environmental school health (acronym for the study); m3/h: Cubic meters per hour; dB(A): A-weighted decibels; L/s: Liters per second; sd: Standard deviation; SE: Standard error.
Competing interests
The authors declare that they have no competing interests.
Author’s contributions
JTMR supported in the design of the study, led and participated in field work in one of the study regions, conducted data processing, analysis, and interpretation and drafted the manuscript. MV contributed to the study and intervention design, participated in data collection in one of the study regions and managed the overall project. MV furthermore helped draft the manuscript. JTvG contributed to the intervention design, participated in data collection in one of the study regions and reviewed the finalised manuscript. UG contributed to the statistical analysis and interpretation of the data and critically reviewed the manuscript. FD and BB conceived of and managed the project and helped prepare and critically review the draft. All authors have read and approved the final manuscript.
Acknowledgements
The authors would like to thank all schools, and especially the teachers and students of our 18 classes, for their participation in the FRESH study. Furthermore, they thank all colleagues from the Municipal Health Services of Groningen and IJsselland for their support and their contributions to the
field work. Gratitude is also expressed to the colleagues of Utrecht University. Financial support for this study was granted by The Netherlands
Organisation for Health Research and Development (ZonMw).
Author details 1
Institute for Risk Assessment Sciences, Utrecht University, P.O. Box 80178, 3508 TD, Utrecht, The Netherlands.2Department of Environmental Health,
Municipal Health Services Groningen, P.O. Box 584, 9700 AN, Groningen, The Netherlands.3Department of Environmental Health, Municipal Health
Services IJsselland, P.O. Box 1453, 8001 BL, Zwolle, The Netherlands.4Julius Center for Health Sciences and Primary Care, University Medical Center Utrecht, P.O. Box 85500, 3508 GA, Utrecht, The Netherlands.
Received: 2 September 2013 Accepted: 12 December 2013 Published: 17 December 2013
References
1. Duffield TJ:School ventilation. Its effect on the health of the pupil.Am J Public Health1927,17:1226–1229.
2. Versteeg H:Onderzoek naar de kwaliteit van het binnenmilieu in basisscholen.
The Hague: Ministerie voor Volkshuisvesting, Ruimtelijke ordening en Milieu; 2007. report 8055.
3. Meijer G, Duijm F:Binnenmilieu van de openbare scholen in Groningen.
Groningen: GGD Groningen; 2009.
4. Health Council of The Netherlands:Indoor air quality in primary schools.The Hague: Health Council of The Netherlands; 2010.
5. Habets T, Van Ass M, Duijm F, Geelen L, Haans L, Van Brederode N: GGD-richtlijn Beoordeling van ventilatie in scholen.Utrecht: GGD Nederland; 2008. 6. Mendell MJ:Non-specific symptoms in office workers: a review and
summary of the epidemiologic literature.Indoor Air1993,3:227–236. 7. Seppanen OA, Fisk WJ, Mendell MJ:Association of ventilation rates and
CO2 concentrations with health and other responses in commercial and institutional buildings.Indoor Air1999,9:226–252.
8. Daisey JM, Angell WJ, Apte MG:Indoor air quality, ventilation and health symptoms in schools: an analysis of existing information.Indoor Air2003,
13:53–64.
9. Sundell J, Levin H, Nazaroff WW, Cain WS, Fisk WJ, Grimsrud DT, Gyntelberg F, Li Y, Persily AK, Pickering AC, Samet JM, Spengler JD, Taylor ST, Weschler CJ:
Ventilation rates and health: multidisciplinary review of the scientific literature.Indoor Air2011,21:191–204.
10. Simons E, Hwang S, Fitzgerald EF, Kielb C, Lin S:The impact of school building conditions on student absenteeism in upstate New York.
Am J Public Health2010,100:1679–1686.
11. Mendell MJ, Eliseeva EA, Davies MM, Spears M, Lobscheid A, Fisk WJ, Apte MG:Association of classroom ventilation with reduced illness absence: a prospective study in California elementary schools.Indoor Air
2013,23:515–528.
12. Smedje G, Norbäck D:New ventilation systems at select schools in Sweden-effects on asthma and exposure.Arch Environ Health2000,55:18–25. 13. Mendell MJ, Heath GA:Do indoor pollutants and thermal conditions in
schools influence student performance? A critical review of the literature.Indoor Air2005,15:27–52.
14. Haverinen-Shaughnessy U, Moschandreas DJ, Shaughnessy RJ:Association between substandard classroom ventilation rates and students' academic achievement.Indoor Air2011,21:121–131.
15. Bakó-Biró Z, Clements-Croome D, Kochhar N, Awbi H, Williams M:Ventilation rates in schools and pupils’performance.Build Environ2012,48:215–223. 16. Twardella D, Matzen W, Lahrz T, Burghardt R, Spegel H, Hendrowarsito L,
Frenzel A, Fromme H:Effect of classroom air quality on students’ concentration: results of a cluster-randomized cross‐over experimental study.Indoor Air2012,22:378–387.
17. Wargocki P, Wyon DP:The effects of moderately raised classroom temperatures and classroom ventilation rate on the performance of schoolwork by children (RP-1257).HVAC & R Res2007,13:193–220. 18. Wargocki P, Wyon DP:The effects of outdoor air supply rate and supply
air filter condition in classrooms on the performance of schoolwork by children (RP-1257).HVAC & R Res2007,13:165–191.
19. Seppanen OA, Fisk WJ:Summary of human responses to ventilation.
Indoor Air2004,14(Suppl 7):102–118.
concentrations on human decision-making performance.Environ Health Perspect2012,120:1671–1677.
21. Acoustical Society of America:Classroom Acoustics II: acoustical barriers to learning.Melville, NY: Acoustical Society of America; 2002.
22. Wargocki P, Wyon DP:Providing better thermal and air quality conditions in school classrooms would be cost-effective.Build Environ2013,59:581–589.
doi:10.1186/1476-069X-12-110
Cite this article as:Rosbachet al.:A ventilation intervention study in classrooms to improve indoor air quality: the FRESH study.
Environmental Health201312:110.
Submit your next manuscript to BioMed Central and take full advantage of:
• Convenient online submission
• Thorough peer review
• No space constraints or color figure charges
• Immediate publication on acceptance
• Inclusion in PubMed, CAS, Scopus and Google Scholar
• Research which is freely available for redistribution