R E S E A R C H
Open Access
Associations between non-traditional lipid
measures and risk for type 2 diabetes
mellitus in a Chinese community
population: a cross-sectional study
Qiaofeng Song
1†, Xiaoxue Liu
1†, Anxin Wang
2,3, Youxin Wang
4, Yong Zhou
3, Wenhua Zhou
1and Xizhu Wang
1*Abstract
Background:This study investigated associations between type 2 diabetes mellitus and non-traditional lipid measures (total cholesterol (TC)/high-density lipoprotein cholesterol (HDL-C), triglycerides (TG)/HDL-C, and non-HDL-C).
Methods:We conducted a community-based, cross-sectional study of 9 078 participants aged 18 years or older (4 768 men and 4 310 women) who lived in the Jidong community, Tangshan, China. The adjusted odds ratios for type 2 diabetes were calculated for every standard deviation change in TC, log-transformed TG, HDL-C, LDL-C, non-HDL-C, TC/HDL-C, and log-transformed TG/HDL-C using multivariate logistic regression analysis. Receiver operating characteristic (ROC) curve analysis was used to define the points of maximum sum of sensitivity and specificity for each lipid measure as a predictor for type 2 diabetes.
Results: Prevalence of type 2 diabetes was 6.29 %. Higher TC, TG, LDL-C, non-HDL-C, TC/HDL-C, and TG/HDL-C, and lower HDL-C levels were individually associated with type 2 diabetes in multivariate analyses (allP <0.05). TC/HDL-C was superior at discriminating between participants with and without type 2 diabetes compared with LDL-C (comparing ROC:P< 0.001), HDL-C (P< 0.001), TG (P= 0.012), TC (P< 0.001), non-HDL-C (P= 0.001), and TG/HDL-C (P= 0.03). The cutoff point for TC/HDL-C was 1.30 mmol/L in this population from the Jidong community. Sensitivity and specificity values for TC/HDL-C were 0.77 and 0.53, respectively.
Conclusions:TC/HDL-C is associated with type 2 diabetes and is superior to LDL-C and HDL-C as a risk marker in this population.
Keywords:Lipids, Non-HDL cholesterol, type 2 diabetes
Background
The prevalence of type 2 diabetes mellitus is increasing globally. In the United States, approximately 18.8 million people were diagnosed with diabetes mellitus in 2010 [1]. The China National Diabetes and Metabolic Disorders Study reported that there were 92.4 million adults with diabetes from June 2007 to May 2008 in China [2]. However, there was also about 148.2 million adults with
prediabetes, defined as impaired fasting glucose and/or impaired glucose tolerance. Identification of risk factors for the development of type 2 diabetes is urgently needed to better understand and prevent this public health epidemic in China.
Previous studies have confirmed that type 2 diabetes can be prevented by identifying and intervening in the development of risk factors [3–5]. Studies have shown that dyslipidemia is one of the known risk factors for type 2 diabetes [6, 7]. Traditional lipid measures, including total cholesterol (TC), low-density lipoprotein cholesterol (LDL-C), and triglycerides (TG), are well documented in their association with the incidence of type 2 diabetes [6, 8]. Additionally, evidence indicates that
non-high-* Correspondence:tsrmyy_wxz@126.com
Qiaofeng Song and Xiaoxue Liu share the first authorship.
†Equal contributors
1Department of Cardiology, Tangshan People’s Hospital, North China
University of Science and Technology, No.65 Shengli Road, Lunan District, Tangshan 063000, China
Full list of author information is available at the end of the article
density lipoprotein cholesterol (non-HDL-C) is a super-ior marker for the development of vascular disease compared with LDL-C, the traditional lipid measure [9–12]. Other studies have reported that lipid ratios, such as TC/HDL-C, have shown a predictive value for cardiovascular disease [13, 14].
Ley et al. reported that non-HDL-C was associated with the incidence of type 2 diabetes and was superior to LDL-C as a risk predictor in 606 diabetes-free partici-pants [15]. Another prospective study reported that lipid ratios (TG/HDL-C and TC/HDL-C) were associated with the incidence of type 2 diabetes among Iranians [16]. There is a lack of data on associations between non-traditional lipid measures (TC/HDL-C, TG/HDL-C, and non-HDL-C) and type 2 diabetes in China. The current study investigated the association between non-traditional lipid measures with type 2 diabetes and compared their predictive significance to those of traditional lipid vari-ables, including TC, LDL-C, and TG, in a population from the Jidong community, China. We hypothesized that non-traditional lipid measures (TC/HDL-C, TG/HDL-C, and non-HDL-C) are associated with type 2 diabetes and are superior to LDL-C and HDL-C as risk markers in this population.
Methods
Study design and population
From July 2013 to August 2014, 9 078 residents of the Jidong community aged 18 years and older were invited to participate in the study. The community is geographic-ally located in Tangshan, which is a modern industrial city located in the central section of the circulating Bohai Sea Gulf region of China and mainly comprises employees of Jidong Oilfield Inc. After excluding participants with in-complete information on type 2 diabetes and lipid meas-urement data, 8 829 participants were included in the study. At baseline, physical examinations and surveys were conducted by trained medical professionals from medical centers of Jidong Oil Field Inc.
The study was approved by the Ethics Committee of Jidong Oilfield Inc. Medical Centers, and signed informed consent was obtained from all participants.
Assessment of potential covariates
A questionnaire was used to obtain data on age, sex, marital status, personal monthly income, smoking, drink-ing, physical activity, education level, and history of diseases (hypertension, type 2 diabetes, stroke, cancer, myocardial infarction). Questionnaires were administered in person by research doctors.
Anthropometric measurements, including height, weight, body mass index (BMI), and blood pressure, were mea-sured by three trained doctors and nurses. Height was measured to the nearest 0.1 cm using a tape measure.
Weight was measured to the nearest 0.1 kg using cali-brated platform scales. BMI was calculated as body weight (kg) divided by the square of height (m2). Blood pressure was measured using a mercury sphygmomanometer. Two readings for systolic blood pressure and diastolic blood pressure were taken at 5-min intervals with participants resting in a chair during between measurements. The average of the two readings was used for analyses. If the two measurements differed by more than 5 mmHg, an additional reading was taken, and the average of the three readings was used [17]. Hypertension was defined based on a personal history of hypertension, systolic blood pres-sure≥140 mmHg, diastolic blood pressure≥90 mmHg, or currently taking antihypertensive medication prescribed by a physician [18].
Biochemical index
Blood samples were drawn by trained phlebotomists from participants after an overnight fast for 8–12 h. Venous blood samples in tubes containing ethylenedi-aminetetraacetic acid trisodium salt hydrate were imme-diately placed on ice after antecubital venipuncture. Fasting blood glucose (FBG) was measured using the hexokinase/ glucose-6-phosphate dehydrogenase method [19]. TC was measured using the endpoint test method [20]. HDL-C and LDL-C levels were measured using the direct test method [21], and TG was measured using the GPO method [22] (inter-assay coefficient of variation: <10 %; Mind Bioengin-eering Co. Ltd, Shanghai, China). All biochemical variables were measured using an auto analyzer (Olympus AU400; Olympus, Tokyo, Japan) at the central laboratory at Jidong Oilfield Hospital. Non-HDL-C levels were determined by subtracting serum HDL-C levels from TC [11, 15, 16].
Diagnostic criteria for type 2 diabetes
Type 2 diabetes was diagnosed if the participant was undergoing treatment with insulin or oral hypoglycemic agents, if FBG levels were≥7.0 mmol/L, or if the participant had a personal history of type 2 diabetes [2].
Statistical analysis
Statistical analyses were performed using SAS software, version 9.4 (SAS Institute, Cary, NC, USA). Data are pre-sented as mean ± standard deviation (SD) for continuous variables and as frequencies and percentages for categor-ical variables. Because TG and TG/HDL-C had a skewed distribution, they are presented as medians (interquartile ranges). The Student’s t-test was used for non-paired samples for comparisons of normally distributed parame-ters, and the Wilcoxon test was used for comparisons of non-parametric variables. The chi-squared test was used for comparisons of categorical variables.
diabetes. The adjusted odds ratio (OR) per 1 SD increase in the corresponding lipid variable and 95 % confidence intervals (CI) were calculated. The area under the receiver operating characteristic (ROC) curve (95 % CI) was used to compare the ability of different lipid variables in dis-criminating participants with or without type 2 diabetes.
To determinate appropriate cutoff values of each lipid measure for predicting type 2 diabetes, ROC curve ana-lysis was also used to estimate the variable’s sensitivity and specificity. The cutoff point of each lipid variable was assessed by the minimum value of√(1-sensitivity)2+ (1-specificity)2, which represent the maximum sum of sensitivity and specificity [23].
All statistical tests were two-sided. A P-value <0.05 was considered statistically significant.
Results
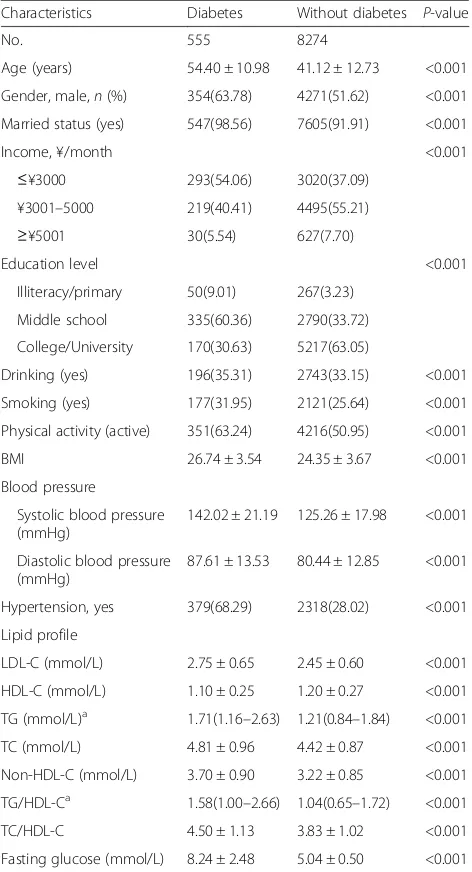
Of the 8 829 participants (4 625 men and 4 204 women; mean age of 42 years), 555 (6.29 %) were diagnosed with type 2 diabetes. Compared with those without type 2 diabetes, patients with type 2 diabetes had higher TC/ HDL-C, TG/HDL-C, non-HDL-C, TC, TG, LDL-C, BMI, and FBG, and were more likely to have hyperten-sion at baseline (allP <0.001) (Table 1).
OR of 1 SD change in each lipid marker or index are listed in Table 2. In the fully adjusted model, there were positive correlations between TC, TG, non-HDL-C, TG/ HDL-C, and TC/HDL-C with type 2 diabetes, and 1 SD increase in each of these lipids increased risk for type 2 diabetes by 13 %, 38 %, 23 %, 45 %, and 42 %, respect-ively (Table 2). The positive correlations between each lipid marker with type 2 diabetes persisted when partici-pants with hypertension were further excluded in the sensitivity analyses (Table 2).
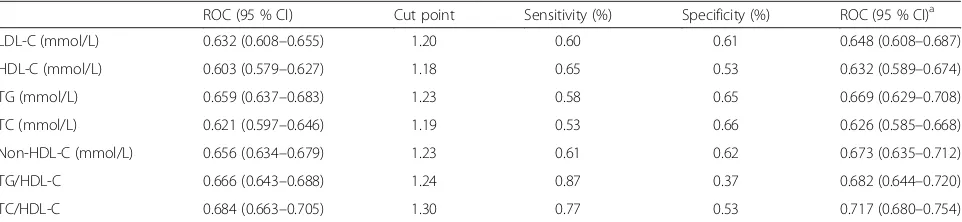
Table 3 shows the ROC curve and cutoff points for lipid measures for the prediction of type 2 diabetes with their corresponding specificity and sensitivity. Cutoff points for LDL-C, HDL-C, TG, non-HDL-C, TG/HDL-C, and TC/HDL-C to predict type 2 diabetes were 1.20, 1.18, 1.23, 1.19, 1.24, and 1.30 mmol/L, respectively.
Comparing ROC curves, TC/HDL-C was a more su-perior discriminant of participants with and without type 2 diabetes than LDL-C (comparing ROC: P< 0.001), HDL-C (P< 0.001), TG (P= 0.012), TC (P< 0.001), non-HDL-C (P= 0.001), and TG/HDL-C (P= 0.03).
The significant positive association between each lipid marker with type 2 diabetes and the trend seen by com-paring ROC curves for each lipid marker persisted when participants with hypertension were further excluded in the sensitivity analyses (Table 3).
Discussion
In this study, TC/HDL-C was found to be associated with type 2 diabetes, and was a superior marker or index
for discriminating individuals with and without type 2 diabetes compared with LDL-C, HDL-C, or non-HDL-C in this population from the Jidong community, China.
Although the association between lipid ratios and inci-dent vascular disease is well documented [10, 13, 14], data on associations between TC/HDL-C and TG/HDL-C with type 2 diabetes are limited. Our study suggests that higher TC/HDL-C or TG/HDL-C is associated with an increased risk for type 2 diabetes. TC/HDL-C is an indir-ect estimate of LDL-C particle number, and the LDL-C particle number is closely related to atherosclerosis and
Table 1Baseline characteristics of study participants with and without type 2 diabetes
Characteristics Diabetes Without diabetes P-value No. 555 8274
Age (years) 54.40 ± 10.98 41.12 ± 12.73 <0.001 Gender, male,n(%) 354(63.78) 4271(51.62) <0.001 Married status (yes) 547(98.56) 7605(91.91) <0.001 Income, ¥/month <0.001
≤¥3000 293(54.06) 3020(37.09) ¥3001–5000 219(40.41) 4495(55.21)
≥¥5001 30(5.54) 627(7.70)
Education level <0.001 Illiteracy/primary 50(9.01) 267(3.23)
Middle school 335(60.36) 2790(33.72) College/University 170(30.63) 5217(63.05)
Drinking (yes) 196(35.31) 2743(33.15) <0.001 Smoking (yes) 177(31.95) 2121(25.64) <0.001 Physical activity (active) 351(63.24) 4216(50.95) <0.001 BMI 26.74 ± 3.54 24.35 ± 3.67 <0.001 Blood pressure
Systolic blood pressure (mmHg)
142.02 ± 21.19 125.26 ± 17.98 <0.001 Diastolic blood pressure
(mmHg)
87.61 ± 13.53 80.44 ± 12.85 <0.001 Hypertension, yes 379(68.29) 2318(28.02) <0.001 Lipid profile
LDL-C (mmol/L) 2.75 ± 0.65 2.45 ± 0.60 <0.001 HDL-C (mmol/L) 1.10 ± 0.25 1.20 ± 0.27 <0.001 TG (mmol/L)a 1.71(1.16–2.63) 1.21(0.84–1.84) <0.001
TC (mmol/L) 4.81 ± 0.96 4.42 ± 0.87 <0.001 Non-HDL-C (mmol/L) 3.70 ± 0.90 3.22 ± 0.85 <0.001 TG/HDL-Ca 1.58(1.00–2.66) 1.04(0.65–1.72) <0.001
TC/HDL-C 4.50 ± 1.13 3.83 ± 1.02 <0.001 Fasting glucose (mmol/L) 8.24 ± 2.48 5.04 ± 0.50 <0.001
BMIbody mass index,HDL-Chigh-density lipoprotein cholesterol,LDL-Clow-density lipoprotein cholesterol,Non-HDL-Cnon-high-density lipoprotein cholesterol,TCtotal cholesterol,TGtriglycerides
a
cardiometabolic risk compared with LDL-C [9]. Similar to the findings of the current study, a previous prospective study reported that adjusted TC/HDL-C is associated with the incidence of type 2 diabetes among Iranian men (OR: 1.44; 95 % CI: 1.22–1.69) and women (OR: 1.37; 95 % CI: 1.21–1.55) [16], and adjusted TG/HDL-C is associated with the incidence of type 2 diabetes among Iranian men (OR: 1.44; 95 % CI: 1.25–1.65) and women (OR: 1.78; 95 % CI: 1.53–2.06) [16]. Ley et al. also reported that TC/ HDL-C is associated with the incidence of type 2 diabetes in non-Aboriginal populations [15]. Kimm et al. reported that lipid ratios, including TC/HDL-C and TG/HDL-C, are associated with insulin resistance and might be used as integrated lipid values [24].
In the current study, areas under ROC curves for each lipid measure (LDL-C, HDL-C, TG, TC, non-HDL-C, TG/HDL-C, and TC/HDL-C) were 0.632, 0.603, 0.659, 0.621, 0.656, 0.666, and 0.684, respectively, suggesting that TC/HDL-C might be a superior predictor of type 2
diabetes compared with LDL-C. As mentioned, Hadaegh et al. [16] also reported lipid ratios were superior in their association with type 2 diabetes in Iranian men and women. However, in another prospective study carried out by Ley et al. [15], the researchers reported that non-HDL-C was associated with the incidence of type 2 diabetes and was superior to LDL-C as a risk predictor in that population. The differences may arise from dif-ferences in ethnicities of the studied populations. Par-ticipants in the current study are mainly Han-ethnic Chinese (97.2 %), probably having different diverse so-cioeconomic factors and lifestyles compared with other ethnic populations.
In the data analysis in the current study, ROC analysis was used to calculate the cutoff points of lipid variables based equally on weighted sensitivity and specificity, hence these cutoff points have low sensitivity for predicting dia-betes in clinical practice. Additionally, these points may not be the optimal cutoffs in clinical settings because
Table 2Logistic regression analysis of associations between lipids and type 2 diabetes
Odds ratio (OR) (95 % CI) Sensitivity analysesd SD Model 1a Model 2b Model 3c Odds ratio (95 % CI) LDL-C (mmol/L) 0.6086 1.57(1.45–1.70) 1.21(1.10–1.33) 1.14(1.04–1.25) 1.21(1.03–1.43) HDL-C (mmol/L) 0.2696 0.68(0.61–0.75) 0.68(0.61–0.76) 0.74(0.66–0.83) 0.66(0.54–0.81) TG (mmol/L)e 0.5976 1.68(1.56–1.82) 1.49(1.36–1.63) 1.38(1.25–1.53) 1.55(1.31–1.84)
TC (mmol/L) 0.8792 1.50(1.39–1.63) 1.18(1.08–1.29) 1.13(1.03–1.24) 1.18(1.00–1.38) Non-HDL-C (mmol/L) 0.8595 1.66(1.54–1.80) 1.31(1.20–1.44) 1.23(1.12–1.35) 1.32(1.12–1.55) TG/HDL-Cf 0.7256 1.71(1.58–1.85) 1.56(1.42–1.72) 1.45(1.31–1.60) 1.64(1.38–1.96)
TC/HDL-C 1.0356 1.70(1.57–1.83) 1.52(1.39–1.66) 1.42(1.30–1.57) 1.59(1.37–1.85)
Odds ratio (OR) (95 % CI) per 1 SD change.HDL-Chigh-density lipoprotein cholesterol,LDL-Clow-density lipoprotein cholesterol,Non-HDL-Cnon-high-density lipoprotein cholesterol,SDstandard deviation,TCtotal cholesterol,TGtriglycerides
a
Unadjusted
b
Adjusted for age, sex, marital status, personal monthly income level, education level, smoking, drinking, physical activity, and hypertension
c
Additionally adjusted for BMI
d
Adjusted for model 3 and further excluded individuals with hypertension
e
Log-transformed TG used
f
Log-transformed TG/HDL-C used
Table 3ROC curve for predicting diabetes and cutoff points for maximum sum of sensitivity and specificity
ROC (95 % CI) Cut point Sensitivity (%) Specificity (%) ROC (95 % CI)a
LDL-C (mmol/L) 0.632 (0.608–0.655) 1.20 0.60 0.61 0.648 (0.608–0.687) HDL-C (mmol/L) 0.603 (0.579–0.627) 1.18 0.65 0.53 0.632 (0.589–0.674) TG (mmol/L) 0.659 (0.637–0.683) 1.23 0.58 0.65 0.669 (0.629–0.708) TC (mmol/L) 0.621 (0.597–0.646) 1.19 0.53 0.66 0.626 (0.585–0.668) Non-HDL-C (mmol/L) 0.656 (0.634–0.679) 1.23 0.61 0.62 0.673 (0.635–0.712) TG/HDL-C 0.666 (0.643–0.688) 1.24 0.87 0.37 0.682 (0.644–0.720) TC/HDL-C 0.684 (0.663–0.705) 1.30 0.77 0.53 0.717 (0.680–0.754)
HDL-Chigh-density lipoprotein cholesterol,LDL-Clow-density lipoprotein cholesterol,Non-HDL-Cnon-high-density lipoprotein cholesterol,TCtotal cholesterol,
TG, triglycerides. Cut points are presented as mmol/L
TC/HDL-C was a better predictor than LDL-C (comparing ROC:P< 0.001), HDL-C (P< 0.001), TG (P= 0.012), TC (P< 0.001), non-HDL-C (P= 0.001), and TG/HDL-C (P= 0.03)
a
sensitivity vs. specificity should be weighed against many other factors, such as the seriousness of the illness, how invasive or feasible it might be, the test used for first evaluation, and finally how often the test should be performed [25].
Several limitations should be considered when inter-preting the results of the current study. First, type 2 diabetes was diagnosed based on a single FBG level without an oral glucose tolerance test [15] for further diagnosis. It is therefore possible that patients with type 2 diabetes might have been missed. This would result in the impact between increased lipid ratios and type 2 dia-betes being underestimated. However, the same method for diagnosing type 2 diabetes with a single FBG meas-urement was used in previous epidemiological studies (the Framingham Heart Study [26] and the Kailuan study [19]). Second, inclusion of individuals who had a higher proportion of hypertension at baseline might influence the results of the association. However, with sensitivity ana-lyses, these people were further excluded, and the signifi-cant positive associations between type 2 diabetes with each lipid marker and the trend seen when comparing the C-statistics for each lipid marker were consistent. Third, all participants are from the Jidong community, and have a relatively higher income status and have attained higher education compared with the general Chinese population. Therefore, generalizations about the entire Chinese popu-lation cannot be drawn from the results. Finally, this study was a cross-sectional study, which limits the ability to conclude a cause-effect association between lipid ratios and type 2 diabetes.
Conclusions
The results of the current study suggest that TC/HDL-C strongly correlates with type 2 diabetes, and together with established independent lipid measures such as HDL-C and LDL-C in this population. The predicative significance of TC/HDL-C for type 2 diabetes is better than LDL-C or HDL-C in this Chinese population. The results support using TC/HDL-C information, which is becoming more readily available in clinical settings, for communicating the increased risk for cardiometabolic disease progression at an early stage, before the onset of diabetes. It is sug-gested that further studies are required to establish the utility of TC/HDL-C in more populations before it can be incorporated into clinical decision making for the preven-tion of type 2 diabetes.
Ethics approval and consent to participate
The study was approved by the Ethics Committee of Jidong Oilfield Inc. Medical Centers, and signed informed consent was obtained from all participants.
Abbreviations
BMI:body mass index; CI: confidence interval; FBG: fasting blood glucose; HDL-C: high-density lipoprotein cholesterol; LDL-C: low-density lipoprotein cholesterol; OR: odds ratio; ROC: receiver operating characteristic; SD: standard deviation; TC: total cholesterol; TG: triglycerides.
Competing interests
The authors declare that they have no competing interests.
Authors’contributions
QS, XL, AW, and XW conceived and designed the study. XL and AW directed data analysis. QS and XL wrote the paper. XL, QS, AW, and WZ prepared the database and reviewed the paper. XW, QS, XL, and WZ conducted quality assurance, and reviewed and edited the paper. All authors read and approved the final manuscript.
Acknowledgments
We appreciate the help and support from all participants and their relatives who took part in the study and the members of the survey teams from the Jidong community.
Funding
This study was supported by research grants from the National 12th Five-Year Major Projects of China (Grant No. 2012BAI37B03) and the Recovery Medical Science Foundation.
Author details 1
Department of Cardiology, Tangshan People’s Hospital, North China University of Science and Technology, No.65 Shengli Road, Lunan District, Tangshan 063000, China.2Department of Epidemiology and Health Statistics, School of Public Health, Capital Medical University, Beijing, China.
3
Department of Neurology, Beijing Tiantan Hospital, Capital Medical University, Beijing, China.4Beijing Municipal Key Laboratory of Clinical
Epidemiology, School of Public Health, Capital Medical University, Beijing 100050, China.
Received: 9 January 2016 Accepted: 30 March 2016
References
1. Centers for Disease Control and Prevention. National Diabetes Fact Sheet: National Estimates and General Information on Diabetes and Prediabetes in the United States, 2011. Atlanta, GA: US Department of Health and Human Services (CDC); 2011.
2. Yang W, Lu J, Weng J, Jia W, Ji L, Xiao J, Shan Z, Liu J, Tian H, Ji Q, et al. Prevalence of diabetes among men and women in China. N Engl J Med. 2010; 362:1090–101.
3. Tuomilehto J, Lindstrom J, Eriksson JG, Valle TT, Hamalainen H, Ilanne-Parikka P, Keinanen-Kiukaanniemi S, Laakso M, Louheranta A, Rastas M, et al. Prevention of type 2 diabetes mellitus by changes in lifestyle among subjects with impaired glucose tolerance. N Engl J Med. 2001;344:1343–50.
4. Knowler WC, Barrett-Connor E, Fowler SE, Hamman RF, Lachin JM, Walker EA, Nathan DM. Reduction in the incidence of type 2 diabetes with lifestyle intervention or metformin. N Engl J Med. 2002;346:393–403.
5. Stumvoll M, Goldstein BJ, van Haeften TW. Type 2 diabetes: principles of pathogenesis and therapy. Lancet. 2005;365:1333–46.
6. Wilson PW, Meigs JB, Sullivan L, Fox CS, Nathan DM, D'Agostino Sr RB. Prediction of incident diabetes mellitus in middle-aged adults: the Framingham Offspring Study. Arch Intern Med. 2007;167:1068–74. 7. Expert Panel on Detection, Evaluation, and Treatment of High Blood
Cholesterol in Adults. Executive Summary of the Third Report of the National Cholesterol Education Program (NCEP) Expert Panel on Detection, Evaluation, and Treatment of High Blood Cholesterol In Adults (Adult Treatment Panel III). JAMA. 2001;285:2486–97.
8. Ley SH, Harris SB, Mamakeesick M, Noon T, Fiddler E, Gittelsohn J, Wolever TM, Connelly PW, Hegele RA, Zinman B, Hanley AJ. Metabolic syndrome and its components as predictors of incident type 2 diabetes mellitus in an Aboriginal community. CMAJ. 2009;180:617–24.
artery disease in apparently healthy men and women: the EPIC-Norfolk Prospective Population Study. J Am Coll Cardiol. 2007;49:547–53. 10. Ridker PM, Rifai N, Cook NR, Bradwin G, Buring JE. Non-HDL cholesterol,
apolipoproteins A-I and B100, standard lipid measures, lipid ratios, and CRP as risk factors for cardiovascular disease in women. JAMA. 2005;294:326–33. 11. Jiang R, Schulze MB, Li T, Rifai N, Stampfer MJ, Rimm EB, Hu FB. Non-HDL
cholesterol and apolipoprotein B predict cardiovascular disease events among men with type 2 diabetes. Diabetes Care. 2004;27:1991–7. 12. Shai I, Rimm EB, Hankinson SE, Curhan G, Manson JE, Rifai N, Stampfer MJ,
Ma J. Multivariate assessment of lipid parameters as predictors of coronary heart disease among postmenopausal women: potential implications for clinical guidelines. Circulation. 2004;110:2824–30.
13. Nair D, Carrigan TP, Curtin RJ, Popovic ZB, Kuzmiak S, Schoenhagen P, Flamm SD, Desai MY. Association of total cholesterol/high-density lipoprotein cholesterol ratio with proximal coronary atherosclerosis detected by multislice computed tomography. Prev Cardiol. 2009;12:19–26. 14. Chien KL, Hsu HC, Su TC, Chen MF, Lee YT, Hu FB. Apolipoprotein B and
non-high density lipoprotein cholesterol and the risk of coronary heart disease in Chinese. J Lipid Res. 2007;48:2499–505.
15. Ley SH, Harris SB, Connelly PW, Mamakeesick M, Gittelsohn J, Wolever TM, Hegele RA, Zinman B, Hanley AJ. Utility of non-high-density lipoprotein cholesterol in assessing incident type 2 diabetes risk. Diabetes Obes Metab. 2012;14:821–5.
16. Hadaegh F, Hatami M, Tohidi M, Sarbakhsh P, Saadat N, Azizi F. Lipid ratios and appropriate cut off values for prediction of diabetes: a cohort of Iranian men and women. Lipids Health Dis. 2010;9:85.
17. Li Z, Yang X, Wang A, Qiu J, Wang W, Song Q, Wang X. Association between ideal cardiovascular health metrics and depression in Chinese population: a cross-sectional study. Sci Rep. 2015;5:11564.
18. Colangelo LA, Vu TH, Szklo M, Burke GL, Sibley C, Liu K. Is the association of hypertension with cardiovascular events stronger among the lean and normal weight than among the overweight and obese? The multi-ethnic study of atherosclerosis. Hypertension. 2015;66:286–93.
19. Wang L, Cui L, Wang Y, Vaidya A, Chen S, Zhang C, Zhu Y, Li D, Hu FB, Wu S, Gao X. Resting heart rate and the risk of developing impaired fasting glucose and diabetes: the Kailuan prospective study. Int J Epidemiol. 2015;44:689–99.
20. Satoh M, Ohkubo T, Asayama K, Murakami Y, Sakurai M, Nakagawa H, Iso H, Okayama A, Miura K, Imai Y, et al. Combined effect of blood pressure and total cholesterol levels on long-term risks of subtypes of cardiovascular death: evidence for cardiovascular prevention from observational cohorts in Japan. Hypertension. 2015;65:517–24.
21. Bachorik PS, Ross JW. National Cholesterol Education Program
recommendations for measurement of low-density lipoprotein cholesterol: executive summary. The National Cholesterol Education Program Working Group on Lipoprotein Measurement. Clin Chem. 1995;41:1414–20. 22. Bucolo G, David H. Quantitative determination of serum triglycerides by the
use of enzymes. Clin Chem. 1973;19:476–82.
23. Perkins NJ, Schisterman EF. The inconsistency of "optimal" cutpoints obtained using two criteria based on the receiver operating characteristic curve. Am J Epidemiol. 2006;163:670–5.
24. Kimm H, Lee SW, Lee HS, Shim KW, Cho CY, Yun JE, Jee SH. Associations between lipid measures and metabolic syndrome, insulin resistance and adiponectin. - Usefulness of lipid ratios in Korean men and women. Circ J. 2010;74:931–7.
25. Glumer C, Carstensen B, Sandbaek A, Lauritzen T, Jorgensen T, Borch-Johnsen K. A Danish diabetes risk score for targeted screening: the Inter99 study. Diabetes Care. 2004;27:727–33.
26. Fox CS, Pencina MJ, Meigs JB, Vasan RS, Levitzky YS, D'Agostino Sr RB. Trends in the incidence of type 2 diabetes mellitus from the 1970s to the 1990s: the Framingham Heart Study. Circulation. 2006;113:2914–8.
• We accept pre-submission inquiries
• Our selector tool helps you to find the most relevant journal • We provide round the clock customer support
• Convenient online submission • Thorough peer review
• Inclusion in PubMed and all major indexing services • Maximum visibility for your research
Submit your manuscript at www.biomedcentral.com/submit