R E S E A R C H A R T I C L E
Open Access
Value-based healthcare in ischemic stroke
care: case-mix adjustment models for
clinical and patient-reported outcomes
Arvind Oemrawsingh
1*, Nikki van Leeuwen
1, Esmee Venema
1,2, Martien Limburg
3,4, Frank-Erik de Leeuw
5,
Markus P. Wijffels
6, Aafke J. de Groot
7, Pieter H. E. Hilkens
8, Jan A. Hazelzet
1, Diederik W. J. Dippel
2, Carla H. Bakker
9,
Helene R. Voogdt-Pruis
4,10and Hester F. Lingsma
1Abstract
Background:Patient-Reported Outcome Measures (PROMs) have been proposed for benchmarking health care
quality across hospitals, which requires extensive case-mix adjustment. The current study’s aim was to develop and compare case-mix models for mortality, a functional outcome, and a patient-reported outcome measure (PROM) in ischemic stroke care.
Methods:Data from ischemic stroke patients, admitted to four stroke centers in the Netherlands between 2014 and 2016 with available outcome information (N= 1022), was analyzed. Case-mix adjustment models were developed for mortality, modified Rankin Scale (mRS) scores and EQ-5D index scores with respectively binary logistic, proportional odds and linear regression models with stepwise backward selection. Predictive ability of these models was determined with R-squared (R2) and area-under-the-receiver-operating-characteristic-curve (AUC) statistics.
Results:Age, NIHSS score on admission, and heart failure were the only common predictors across all three case-mix adjustment models. Specific predictors for the EQ-5D index score were sex (β= 0.041), socio-economic status (β=−0.019) and nationality (β=−0.074). R2-values for the regression models for mortality (5 predictors), mRS score (9 predictors) and EQ-5D utility score (12 predictors), were respectively R2= 0.44, R2= 0.42 and R2= 0.37.
Conclusions:The set of case-mix adjustment variables for the EQ-5D at three months differed considerably from the set for clinical outcomes in stroke care. The case-mix adjustment variables that were specific to this PROM were sex, socio-economic status and nationality. These variables should be considered in future attempts to risk-adjust for PROMs during benchmarking of hospitals.
Keywords:Ischemic stroke, Case-mix, Risk adjustment model, Patient-reported outcome measure, Value-based
healthcare
Background
The growing trend to benchmark certain health care performance indicators –to assess the health care qual-ity between institutions– requires careful consideration of the methodology that is being used [1, 2]. Healthcare is evolving towards a value-based healthcare framework
with more emphasis on Patient-Reported Outcome Mea-sures (PROMs), that will not only facilitate opportunities for performance improvement at an individual patient level when these measures are used in clinical practice, but may also be useful for benchmarking across pro-viders [3–5]. PROMs can be defined as feedback directly from the individual patient on their own health condi-tion (e.g. symptoms and health-related quality of life), thus without external interpretation [6]. PROMs can be either disease-specific (e.g. Neuro-QOL [7]) or generic (e.g. EQ-5D [8]).
© The Author(s). 2019Open AccessThis article is distributed under the terms of the Creative Commons Attribution 4.0 International License (http://creativecommons.org/licenses/by/4.0/), which permits unrestricted use, distribution, and reproduction in any medium, provided you give appropriate credit to the original author(s) and the source, provide a link to the Creative Commons license, and indicate if changes were made. The Creative Commons Public Domain Dedication waiver (http://creativecommons.org/publicdomain/zero/1.0/) applies to the data made available in this article, unless otherwise stated.
* Correspondence:a.oemrawsingh@erasmusmc.nl
1Center for Medical Decision Making, Department of Public Health, Erasmus
An important consideration for meaningful compari-sons across hospitals is the case-mix adjustment of the patient populations for each health care provider [9,10]. By adjusting for the heterogeneity of patient characteris-tics in inter-hospital comparisons, a larger part of the es-timated variation between hospital performances will be attributable to the quality of care provided to patients rather than factors outside of the healthcare providers’ control.
In stroke, the most commonly used clinical outcome measures are mortality and the modified Rankin Scale (mRS). There has been considerable research conducted on prognostic models for these clinical outcomes, which also encompass variables for case-mix adjustment [11]. Although there is a strong trend to use PROMs for benchmarking purposes [12], there still remains a lack of case-mix models to predict patient-reported outcomes as compared to clinical outcomes [11]. The aim of this study was to identify the specific variables for case-mix adjustment for a generic PROM (EQ-5D) and compare them to case-mix variables for clinical outcomes in acute ischemic stroke.
Methods
Patient population and data collection
A core set of baseline patient characteristics, perform-ance indicators and outcome measures were registered from March 2014 till August 2016 of four stroke care centers in the Netherlands, of which 1 was a university and 3 were district-based hospitals. The original data-base contained consecutive acutely admitted ischemic stroke patients of which demographic, process indicators and outcome measures were registered.
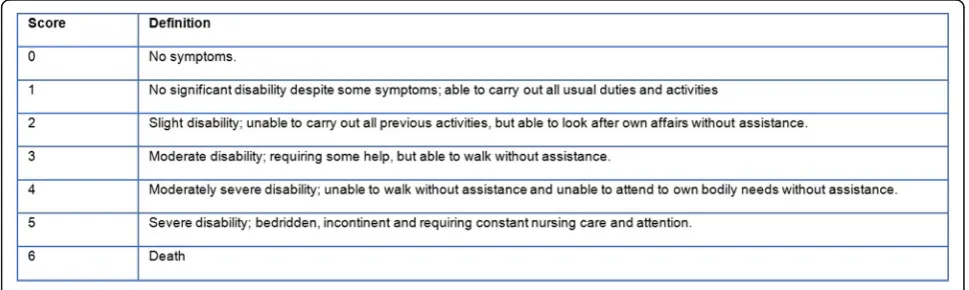
The three outcome measures were mortality at 3 months, modified Rankin Scale (mRS) score at 3 months and EuroQol-5D index score at 3 months. The mRS is a commonly used clinician-reported scale, which measures the degree of disability after a stroke, with scores ranging from 0 to 6 (Fig. 1) [13]. The mRS score at 3 months
post-discharge was generally recorded by trained nurses, either by phone or at the outpatient clinic. The EQ-6D, a generic health-related quality of life (HRQOL) instru-ment, is based on the EQ-5D (dimensions: usual activ-ities, self-care or autonomy, mobility, pain/discomfort, and anxiety/ depression) with an additional question on cognitive functioning. The survey has been translated into Dutch and validated in previously published litera-ture [8,14,15]. The post-discharge EQ-6D data was cap-tured through either face-to-face or telephone interviews with patients themselves or their proxies. Due to the lack of a validated EQ-6D index tariff, the utility score was derived and transformed through the EQ-5D index tariff, by ignoring the “cognitive” dimension of the EQ-6D [16–18]. This EQ-5D tariff is an algorithm for attaching values to all 3125 health states often used in economic evaluations. This utility score can be used to compare to population norms or to calculate quality-adjusted life years (QALY’s) [16, 17, 19]. The authors will, for the remainder of this article, solely mention
“EQ-5D index score”as the patient-reported outcome of interest to avoid any confusion. This EQ-5D index score ranged from 0 (death) to 1 (perfect health) and signified the patient’s perspective on his/ her own health. Because there still is no consensus on the minimal clinically im-portant difference on the EQ-5D utility score in stroke populations [20], it was decided to keep the EQ-5D util-ity score as a continuous outcome rather than modify it to an ordinal outcome based on arbitrary cut-offs.
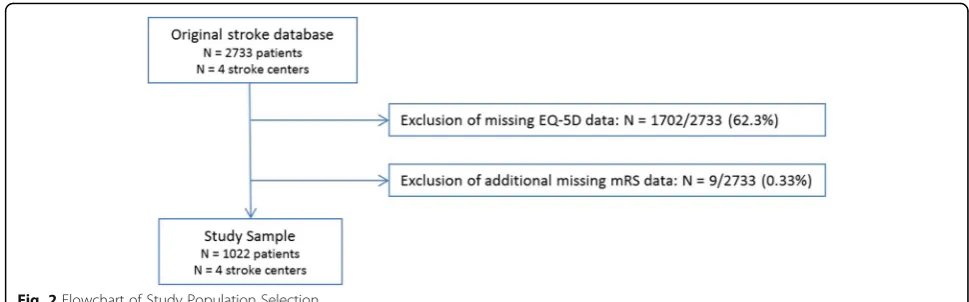
Missing baseline patient characteristics (among which case-mix variables) were imputed 10 times using multiple imputation in the original database (N= 2733 patients of 4 stroke centers), assuming missingness at random. Pre-dictors (including stroke center) and outcomes also served as indicators for the imputation model [21]. Figure 2
showcases the substantial proportion of missing mRS and EQ-5D data that were filtered out before the three case-mix adjustment models were developed. Thus, all three regression models were developed using an imputed
(10 iterations) dataset also containing the “original” 1022 patients. Potential reasons for missing patient-reported outcome data were patients being too sick to fill questionnaires out, and loss-to-follow at 3 months (patients being unreachable due to staying at a nursing home/ rehabilitation center, or because of their tremen-dous recovery).
Case-mix models
Patient characteristics that could differ between hospitals and could be predictive of outcomes were considered potential candidate case-mix variables and were identi-fied based on clinical experience and past literature. Those included: age, sex, nationality, socio-economic status (SES), smoking, cardiovascular comorbidity (e.g. hypertension, hyperlipidemia), stroke in past history, diabetes, cancer, connective tissue disease, Charlson co-morbidity index (CCI), stroke onset-door time, initial National Institutes of Health Stroke Scale (NIHSS) score and the presence of a caregiver. The SES was generated by the ranking of status scores (based on neighbor-hoods/ zip codes) that have been calculated and pub-lished by Social and Cultural Planning Office (SCP), a Dutch governmental institution [22,23].
Statistical analysis
Descriptive statistics were presented as counts (percent-ages) or median ± inter-quartile range (IQR). Nonpara-metric tests were used where appropriate to determine (unadjusted) differences in patient populations between the four healthcare providers, using the Pearson chi-squared statistic for categorical variables and the Kruskal-Wallis test for continuous variables. Ap-value < 0.05 was considered significant. To assess the adjusted effect of the potential case-mix independent variables, the models were developed using logistic, ordinal and linear regression models respectively for mortality, mRS score and EQ-5D index score with stepwise backward selection. This step-wise (regression-based) method initially tests all the
predictors in a regression model and subsequently elimi-nates the least significant variables in a stepwise approach with a certain cut-offp-value [21]. In this study, the AIC (Akaike information criterion) [24], equivalent to p < 0.157, was used as a criterion.
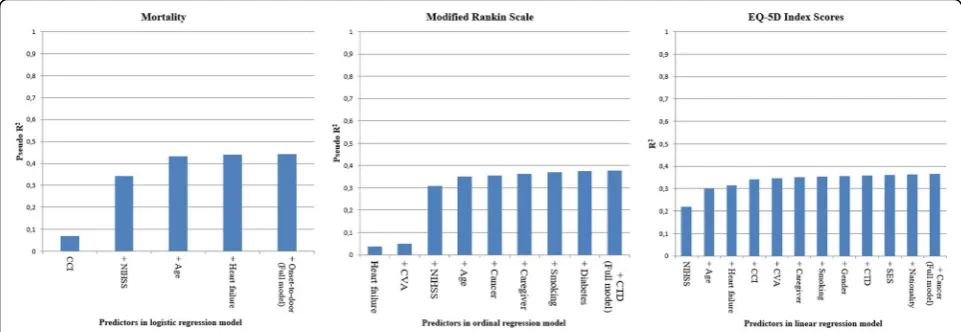
For the logistic and ordinal regression models, the odds ratios (ORs) with 95% confidence intervals (CI) were calculated per predictor. Beta’s (ß’s) and 95% CI were calculated for predictors in the linear regression model. The ß coefficient indicates the change in out-come (units on the EQ-5D index score scale) for one unit change in the predictor variable. The ability of the case-mix models to explain the variability (‘ goodness-of-fit’) of these 3 outcomes was expressed by calculating the R2 (R-squared) statistics [25]. The predictors for each model were added in consecutive order based on the p-values (lowest to highest p-value) and coefficients. The explained variance of each additional predictor was demonstrated till each model was completed.
Because the R2 measure is not immediately compar-able between different regression models (logistic vs. ordinal vs. linear), the AUC (area-under-the receiver-operating-characteristic-curve) statistic was also in-cluded to get a sense of the comparability between the three risk-adjustment models. For this additional ana-lysis, both mRS (0–2 vs. 3–6) and EQ-5D (< 0. 65 vs. ≥ 0.65) were transformed to a binary outcome variable in order to compare the three logistic regression models. The EQ-5D index score of 0.65 was chosen as a cut-off value, as it was the estimated median score in this study sample. The statistical analysis was carried out by using IBM SPSS Statistics 21 & RStudio version 1.0.153.0-© 2009–2016 RStudio, Inc. software.
Results
Patient characteristics
men (Table 1). The unadjusted median age was signifi-cantly different (range 70–78 years,p= 0.001) across the four stroke care centers. Most patients (87%) were native Dutch inhabitants. Both the Charlson Comorbidity Index and the stroke rate in patient history were similar across the 4 stroke patient cohorts. There was a signifi-cant unadjusted difference (range 113–275 min, p = 0.002) in the onset-to-door time between the patient populations of the four stroke care centers.
The 3-month mortality was 24.5% (Table 2). The un-adjusted difference in 3-month mortality rates between the four stroke centers was significant (p < 0.001). 581 (57%) of all patients had a favorable degree of disability (mRS < 3). There was also a significant unadjusted differ-ence in mRS scale scores between the four stroke cen-ters. The median EQ-5D index score at 3 months for all patients was 0.65 (inter-quartile range 0.10–0.83), and
the unadjusted difference across the four stroke centers was also significant (p < 0.001). Missing mRS outcomes were 1205/2733 (44.1%) in the original database, with most missing mRS data being observed in stroke center IV (192/238 = 80.7%) (data not shown).
Case-mix models
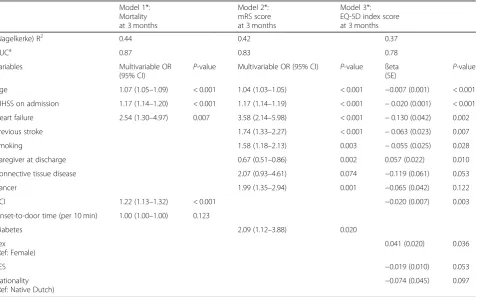
Table3shows the remaining predictors in the regression models after backward selection for mortality, mRS and EQ-5D utility scores. The“strongest”(based on lowest p-values) independent variables in the model for mortality were age (OR = 1.07), NIHSS score on admission (OR = 1.17) and the Charlson’s comorbidity index (OR = 1.22). The strongest predictors for mRS at 3 months were age (OR = 1.04), NIHSS score at admission (OR = 1.17), heart failure (OR = 3.58) and previous stroke (OR = 1.74). There were only three overlapping predictors for the three
Table 1Characteristics of all Ischemic Stroke Patients (N= 1022) and per Dutch Stroke Center, Admitted from March 2014–August 2016 in Four Dutch Stroke Hospitals
Patient characteristics All patients (N= 1022)
Stroke Center I, University (N= 222)
Stroke Center II, District-based (N= 555)
Stroke Center III, District-based (N= 216)
Stroke Center IV, District-based (N= 29)
P-value Missing data, N (%)
Male, N (%) 578 (57) 139 (63) 315 (57) 109 (50) 15 (52) 0.076
Age, median (IQR) 74 (64–82) 70 (59–80) 76 (66–83) 72 (63–82) 78 (72–85) 0.001
Nationality 0.351 84 (8)
Native Dutch 888 (87) 171 (77) 517 (93) 174 (81) 26 (90)
Foreigner 50 (5) 9 (4) 34 (6) 5 (2) 2 (7)
Smoking, N (%) 225 (22) 51 (23) 131 (24) 37 (17) 6 (21) 0.604 72 (7)
SES, N (%) < 0.001 8 (1)
Low 335 (33) 101 (45) 131 (24) 81 (38) 22 (76)
Middle 427 (42) 94 (42) 214 (39) 119 (55) 0 (0)
High 252 (25) 25 (11) 207 (37) 15 (7) 5 (17)
NIHSS on admission, median (IQR) 4 (2–12) 5 (2–9) 4 (2–14) 3 (1–8) 3 (2–14) 0.028 75 (7)
CCI, median (IQR) 1 (0–2) 1 (0–2) 1 (0–2) 1 (0–2) 1 (0–3) 0.133 89 (9)
Comorbidities, N (%)
Hypertension 546 (53) 123 (55) 332 (60) 74 (34) 17 (59) < 0.001 9 (1)
Myocardial infarction 103 (10) 15 (7) 71 (13) 17 (8) 0 (0) 0.012 15 (2)
Heart failure 66 (7) 2 (1) 52 (9) 8 (4) 4 (15) < 0.001 22 (2)
Previous stroke/TIA 274 (27) 58 (26) 156 (28) 54 (25) 6 (21) 0.745 10 (1)
Carotid stenosis 64 (6) 11 (5) 44 (8) 8 (4) 1 (3) 0.093 50 (5)
PAOD 80 (8) 13 (6) 46 (8) 17 (8) 4 (14) 0.374 14 (1)
Diabetes mellitus 39 (4) 9 (4) 25 (5) 4 (2) 1 (3) 0.409 15 (2)
Connective tissue disease 26 (3) 0 (0) 13 (2) 13 (6) 0 (0) < 0.001 24 (2)
Cancer 112 (11) 32 (14) 44 (8) 34 (16) 2 (7) 0.004 6 (1)
Metastasis 24 (2) 8 (4) 10 (2) 5 (2) 1 (3) 0.514 27 (3)
Caregiver post-discharge, N (%) 563 (55) 140 (63) 292 (53) 121 (56) 10 (34) 0.066 150 (15)
Onset-to-door time, median minutes (IQR)
213 (80–672) 275 (72–959) 215 (93–641) 149 (63–384) 113 (41–368) 0.002 153 (15)
different outcomes: age, NIHSS score on admission and heart failure. Exclusive predictors for the EQ-5D index score were sex (β= 0.041), socio-economic status (β=− 0.019), and nationality (β=−0.074).
The binary logistic regression model for mortality had an R2 = 0.44 (Table 3), compared to the ordinal
regression model for the mRS which had an R2 = 0.42, and the linear regression model for the EQ-5D utility score with a R2 = 0.37. The largest increase in R2 was after the addition of NIHSS to the models for mortality and mRS, and age to the EQ-5D index score model (Fig. 3). After mRS and EQ-5D index scores were both
Table 2Outcome Measures of Ischemic Stroke Patients (N= 1022)
Outcome variables All patients (N= 1022)
Stroke Center I, University (N= 222)
Stroke Center II, District-based (N= 555)
Stroke Center III, District-based (N= 216)
Stroke Center IV, District-based (N= 29)
P-value
mRS at 3 months, N (%) < 0.001
0 89 (8.7) 37 (16.7) 25 (4.5) 27 (12.5) 0
1 262 (25.6) 62 (27.9) 143 (25.8) 53 (24.5) 4 (13.8)
2 230 (22.5) 37 (16.7) 130 (23.4) 58 (26.9) 5 (17.2)
3 108 (10.6) 23 (10.4) 67 (12.1) 15 (6.9) 3 (10.3)
4 68 (6.7) 24 (10.8) 32 (5.8) 11 (5.1) 1 (3.4)
5 15 (1.5) 2 (0.9) 11 (2.0) 2 (0.9) 0
6 250 (24.5) 37 (16.7) 147 (26.5) 50 (23.1) 16 (55.2)
EQ-5D index score at 3 months, median (IQR)
0.65 (0.1–0.83) 0.781 (0.45–1.00) 0.61 (0–0.78) 0.65 (0.28–0.83) 0 (0–0.60) < 0.001
mRSModified Rankin Scale scores,EQ-5DEuroQol 5-Dimension,IQRInter-quartile range
Table 3Case-Mix Risk Adjustment Models for Mortality, mRS and EQ-5D Model 1*:
Mortality at 3 months
Model 2*: mRS score at 3 months
Model 3*: EQ-5D index score at 3 months
(Nagelkerke) R2 0.44 0.42 0.37
AUCa 0.87 0.83 0.78
Variables Multivariable OR
(95% CI)
P-value Multivariable OR (95% CI) P-value ßeta (SE)
P-value
Age 1.07 (1.05–1.09) < 0.001 1.04 (1.03–1.05) < 0.001 −0.007 (0.001) < 0.001
NIHSS on admission 1.17 (1.14–1.20) < 0.001 1.17 (1.14–1.19) < 0.001 −0.020 (0.001) < 0.001
Heart failure 2.54 (1.30–4.97) 0.007 3.58 (2.14–5.98) < 0.001 −0.130 (0.042) 0.002
Previous stroke 1.74 (1.33–2.27) < 0.001 −0.063 (0.023) 0.007
Smoking 1.58 (1.18–2.13) 0.003 −0.055 (0.025) 0.028
Caregiver at discharge 0.67 (0.51–0.86) 0.002 0.057 (0.022) 0.010
Connective tissue disease 2.07 (0.93–4.61) 0.074 −0.119 (0.061) 0.053
Cancer 1.99 (1.35–2.94) 0.001 −0.065 (0.042) 0.122
CCI 1.22 (1.13–1.32) < 0.001 −0.020 (0.007) 0.003
Onset-to-door time (per 10 min) 1.00 (1.00–1.00) 0.123
Diabetes 2.09 (1.12–3.88) 0.020
Sex (Ref: Female)
0.041 (0.020) 0.036
SES −0.019 (0.010) 0.053
Nationality (Ref: Native Dutch)
−0.074 (0.045) 0.097
SESSocio-economic status, derived from neighborhood-based ranking,NIHSSNational Institute of Health Stroke Scal,CCICharlson comorbidity index,R2 R-squared,95% CI95% confidence interval,SEStandard error
*The case-mix models was using backward selection with the Akaike information criterion (AIC) as a cut-off for thep-value. The imputed dataset (10 imputations of original dataN= 1022) was used for the development of all three case-mix model development
a
transformed to a dichotomous outcome, AUC’s were compared between all three binary logistic regression models: AUC = 0.87 (mortality) vs. AUC = 0.83 (mRS≥ 3) vs. AUC = 0.78 (EQ-5D index score≥0. 65). As op-posed to the models for mortality and mRS, it took more predictors in the model for EQ-5D index scores for the predictive ability to reach a plateau.
Discussion
The objective of this study was to construct and com-pare case-mix adjustment models for three different out-comes, of which two were clinical (mortality and modified Rankin Scale at 3 months) and one patient-reported (EQ-5D utility score at 3 months). The three case-mix models had several predictors in common: age, NIHSS score at hospital admission, and heart failure. However, the most important difference in the case-mix adjustment models was that sex, nationality, and socio-economic status remained significant case-mix variables specifically for the PROM in contrast to the models for the clinical outcomes. It has to be stated that even if a predictor is significantly associated with the outcome, it doesn’t necessarily have to be included as a case-mix variable, if the prevalence distribution of the variable and its effect on the outcome of interest is similar across hospitals. The R-squared (R2) statistics of the model for the patient-reported outcome measure (PROM) was somewhat lower in comparison to the R2 statistics for mortality and the modified Rankin Scale (mRS), but con-tained more variables.
There have been multiple models previously developed and validated to predict clinical outcomes after stroke [11]. Bray et al. [26] developed and externally validated two case-mix models with 30-day post-stroke mortality as an outcome. The predictors included in the final models were similar to the findings of the current study: age, NIHSS on admission and atrial fibrillation. On the
other hand, there has not been much research con-ducted on the development of case-mix factors for patient-reported outcomes (e.g. EQ-5D) in stroke care [27]. There was some overlap in the remaining case-mix variables in this study and those identified in previously published articles [28]. A review by Carod-Artal et al. [29] identified age, sex, stroke severity, physical impair-ment, functional status, and mental impairment as pre-dictors for the health-related quality of life (HRQOL) after stroke. Mar et al. [30] also found the male gender and the NIHSS to be significantly associated with better EQ-5D values. The negative association between (history of) cancer and a lower quality of life (lower EQ-5D scores) in this study confirms previously published literature [23,31,32].
A striking observation is the caregiver presence post-discharge as a statistically significant predictor variable for mRS score at 3 months with an OR = 0.67 (95% CI 0.51–0.86; p = 0.002) and for the EQ-5D utility score at 3 months with a ßeta = 0.057 (SE 0.022). This observa-tion of caregiver presence at hospital discharge being as-sociated with a lower mRS score (better clinical outcome) and a higher EQ-5D utility score (better qual-ity of life) at 3 months, highlights the potential benefits that a caregiver could offer (e.g. patient motivation, fa-cilitating rehabilitative care) leading to improved func-tional status and quality of life. However, definite conclusions cannot be drawn about this association, be-cause the definition of “caregiver” and “caregiver pres-ence”was not similar across the multiple stroke centers; it was unclear if the absence of a caregiver implied no indication (e.g. low mRS score) or no need (admittance to a revalidation center or nursing home).
Strengths and limitations
adjustments for PROMs in order to make inter-hospital performance comparisons. The case-mix variables for a PROM do not imply additional registration burden for recording data in quality registries because general (rele-vant) demographic variables (e.g. age, gender and socio-economic status) are already captured in standardized fashion. This is a major strength of the study.
An important limitation of this study is the notably large amount of missing outcome (mRS and EQ-5D) data in the original database. This problem is not un-common in registries that are routinely acquired for the purpose of quality of care assessment, and it was the main reason this study solely focused on the develop-ment of case-mix risk adjustdevelop-ment models rather than benchmarking the included stroke centers. Although the estimated regression coefficients of all three case-mix models might be somewhat biased due to the substantial missingness, it is less important in this context and more about the differences in case-mix variables between the models. The missing data issue was partially countered by the use of multiple imputation for the predictor variables. The distribution of patient characteristics was compared between missing and non-missing mRS and EQ-5D groups (data not shown). These analyses showed signifi-cant differences in distribution in NIHSS score, SES rank (low, middle, high), nationality, and some cardiovascular comorbidities (hypertension, heart failure, hyperlipidemia) between missing and non-missing mRS and EQ-5D data. This observation implies that the generalizability of the final set of case-mix variables, observed in this study, should be corroborated in future research.
Another limitation is the loss-to-follow-up bias in this stroke registry: if missing 3-month mRS and EQ-5D data could be attributed to either patients’ full re-covery or an extended stay in a rehabilitation center/ nursery home, it is quite possible that known out-come data could be skewed (both directionalities pos-sible), seeing it was mostly recorded at outpatient clinics. Other stroke registries (e.g. European Safe Im-plementation of Thrombolysis in Stroke-Monitoring Study (SITS-MOST) [33] and UK Sentinel Stroke Na-tional Audit Program (SSNAP) [34]) have also incor-porated patient-reported outcomes, which are typically collected at 3–6 months post-discharge through diverse methods like face-to-face interviews, telephone interviews or mailed questionnaires [35]. As the collection of PROMs at these time points can be challenging due to varying post-discharge patient tra-jectories and/ or substantial resource requirements (personnel and costs), future research should focus on efficient methods to optimally capture PROM data as part of value-based stroke care. This is an essential step that should to be taken before (case-mix) risk adjustment models are further developed.
In this study, R2 values were compared to pseudo-R2 values although they are not directly comparable. How-ever, the objective of this study was to showcase the dif-ferences in predictors between the three models. It has to be noted that some potentially relevant psychological case-mix variables (e.g. depression, anxiety, EQ-5D scores at baseline) were not recorded in the database, even though they could influence PROM responses and thus ultimately impact the case-mix adjustment model. This paper suggests that the specific predictors for the EQ-5D, based on this data, have not been found yet.
Conclusions
In conclusion, this study shows that other predictors (e.g. psychological and social factors) should be consid-ered as potential case-mix variables for patient-reported outcome measures (PROMs) than for clinical outcomes in ischemic stroke patients. It is important that these specific case-mix variables should be included in order to benchmark hospitals legitimately on PROMs. One of the principles of value-based healthcare is to benchmark clinical outcomes and PROMs across different diseases and healthcare providers/ institutions to ensure quality improvement and competition [36]. This study identified a low (er) socio-economic status to be specifically associ-ated with lower EQ-5D index scores. Future research should focus on finding other important predictors spe-cific to PROMs in acute ischemic stroke to be able to further develop valid case-mix models.
Abbreviations
EQ-5D:EuroQol-5 Dimension Questionnaire; mRS: Modified Rankin Scale; PROM: Patient-Reported Outcome Measure
Acknowledgements
The authors would like to thank Marjan Meulink (Zilveren Kruis) for her valuable contribution to this project. Marjan has meant a lot to this project until she passed away in November 2015. The authors would also like to acknowledge all members of the project organization for their participation: [1] the nurse specialists on stroke care (C. Puppels, K. Kanselaar, Y Nawijn en J. Bruining) for coordinating the data collection, [2] the advisory committee (A Visser-Meily, P. Nederkoorn, R. van Balen, E van Gorp, A. Verburg) and other members of the project organization (F. van Duuren, N. de Neeling, I. Middelkoop, E. Eddes).
Authors’contributions
Authors AO, NL, JH, and HL were involved in the study conception. Authors AO and NL were involved in extraction, imputation, analysis, interpretation of the stroke registry data, and drafting the manuscript. Authors EV, DD, CB, HV and HL interpreted the study results and were major contributors in revising the manuscript. Authors ML, FL, MW, AG, PH were involved in study conception and revising the manuscript. All authors read and approved the final manuscript.
Funding
Availability of data and materials
The data that support the findings of this study are available from Hester Lingsma, PhD but restrictions apply to the availability of these data, which were used under license for the current study, and so are not publicly available. Data are however available from the authors upon reasonable request and with permission of Hester Lingsma, PhD.
Ethics approval and consent to participate
Formal ethical approval was not required as primary data were already collected and part of a quality registry. An‘opt-out’procedure was put in place, in which patients were informed about the quality registry and had the option to refuse their data being used.
Consent for publication
Not applicable.
Competing interests
- Authors AO and JH are supported by a grant from the Federation of Dutch University Medical Centers (NFU).
- Author DD reports grants and other from Stryker European Operations BV, grants from Penumbra Inc., grants from Medtronic, grants from Dutch Heart Foundation, grants from Brain Foundation Netherlands, grants from ZON MW () and grants from Thrombolytic Science, LLC, outside the submitted work.
- Remaining authors declare no competing interests.
- This study was a cooperation of 8 parties: Stroke Knowledge Network Netherlands, Achmea Holding N.V., Netherlands Federation of University Medical Centres (NFU), Dutch Association for Neurology (NVN), Netherlands Society of Rehabilitation Medicine (VRA), Dutch Association of Elderly Care Physicians and Social Geriatricians (Verenso), The Dutch College of General Practitioners (NHG), Dutch Institute for Clinical Auditing (DICA), National Health Care Institute (ZN).
Author details
1Center for Medical Decision Making, Department of Public Health, Erasmus
University Medical Center, PO Box 2040, 3000 CA Rotterdam, the
Netherlands.2Department of Neurology, Erasmus University Medical Center,
Rotterdam, the Netherlands.3Department of Neurology, Flevoziekenhuis,
Almere, the Netherlands.4Stroke Knowledge Network Netherlands, Utrecht,
the Netherlands.5Department of Neurology, Donders Institute for Brain
Cognition and Behaviour, Radboud University Medical Center, Nijmegen, the Netherlands.6Department of Neurorehabilitation, Rijndam Rehabilitation,
Rotterdam, the Netherlands.7Department of General Practice and Elderly
Care Medicine, Amsterdam University Medical Center, Amsterdam, the Netherlands / Vivium Naarderheem, Naarden, the Netherlands.8Department
of Neurology, St. Antonius Hospital, Nieuwegein, the Netherlands.9Expert
Centre Quality Registries, Leiden University Medical Center, Leiden, the Netherlands.10EnCorps, Hilversum, the Netherlands.
Received: 31 May 2019 Accepted: 8 November 2019
References
1. Lovaglio PG. Benchmarking strategies for measuring the quality of healthcare: problems and prospects. ScientificWorldJournal. 2012. 2. Kuhrij LS, Wouters MW, van den Berg-Vos RM, de Leeuw FE, Nederkoorn PJ.
The Dutch Acute Stroke Audit: Benchmarking acute stroke care in the Netherlands. Eur Stroke J. 2018;3(4):361–8.
3. Fayanju OM, Mayo TL, Spinks TE, Lee S, Barcenas CH, Smith BD, et al. Value-based breast Cancer care: a multidisciplinary approach for defining patient-centered outcomes. Ann Surg Oncol. 2016;23(8):2385–90.
4. Katzan IL, Spertus J, Bettger JP, Bravata DM, Reeves MJ, Smith EE, et al. Risk adjustment of ischemic stroke outcomes for comparing hospital performance: a statement for healthcare professionals from the American Heart Association/American Stroke Association. Stroke. 2014;45(3):918–44. 5. Kotronoulas G, Kearney N, Maguire R, Harrow A, Di Domenico D, Croy S,
et al. What is the value of the routine use of patient-reported outcome measures toward improvement of patient outcomes, processes of care, and health service outcomes in cancer care? A systematic review of controlled trials. J Clin Oncol. 2014;32(14):1480–501.
6. Bredart A, Marrel A, Abetz-Webb L, Lasch K, Acquadro C. Interviewing to develop patient-reported outcome (PRO) measures for clinical research: eliciting patients' experience. Health Qual Life Outcomes. 2014;12:15. 7. Cella D, Lai JS, Nowinski CJ, Victorson D, Peterman A, Miller D, et al.
Neureo-QOL. Brief measures of health-related quality of life for clinical research in neurology. Neurology. 2012;78(23):1860–7.
8. EuroQol Group. EuroQol--a new facility for the measurement of health-related quality of life. Health policy. 1990;16(3):199–208.
9. Goldstein H, Spiegelhalter DJ. League tables and their limitations: statistical issues in comparisons of institutional performance. J Royal Stat Society Series A (Statistics in Society). 1996;159(3):385–443.
10. van Dishoeck AM, Lingsma HF, Mackenbach JP, Steyerberg EW. Random variation and rankability of hospitals using outcome indicators. BMJ Qual Saf. 2011;20(10):869–74.
11. Teale EA, Forster A, Munyombwe T, Young JB. A systematic review of case-mix adjustment models for stroke. Clin Rehabil. 2012;26(9):771–86. 12. Appleby J, Devlin N, Parkin D. Using patient reported outcomes to improve
health care. Chichester: Wiley; 2015.
13. Wilson JT, Hareendran A, Grant M, Baird T, Schulz UG, Muir KW, et al. Improving the assessment of outcomes in stroke: use of a structured interview to assign grades on the modified Rankin scale. Stroke. 2002;33(9):2243–6.
14. Lamers LM, Stalmeier PF, McDonnell J, Krabbe PF, van Busschbach JJ. Measuring the quality of life in economic evaluations: the Dutch EQ-5D tariff. Ned Tijdschr Geneeskd. 2005;149(28):1574–8.
15. van Agt HM, Essink-Bot ML, Krabbe PF, Bonsel GJ. Test-retest reliability of health state valuations collected with the EuroQol questionnaire. Soc Sci Med. 1994;39(11):1537–44.
16. Shaw JW, Johnson JA, Coons SJ. US valuation of the EQ-5D health states: development and testing of the D1 valuation model. Med Care. 2005;43(3):203–20.
17. Dolan P. Modeling valuations for EuroQol health states. Med Care. 1997; 35(11):1095–108.
18. MV M, MV K, MAAE S, de Wit GA, Prenger R, AS E. Dutch tariff for the five-level version of EQ-5D. Value Health. 2016;19(4):343–52.
19. Cella D, Hahn EA, Jensen SE, Butt Z, Nowinski CJ, Rothrock N, et al. Patient-Reported Outcomes in Performance Measurement. Research Triangle Park (NC): RTI Press (c) 2015 Research Triangle Institute. All rights reserved. This book is protected by copyright. Credit must be provided to the author and source of the book when the content is quoted. No part of this book may be reproduced in any form by any electronic or mechanical means (including photocopying, recording, or information storage and retrieval) without permission in writing from the publisher.; 2015.
20. Chen P, Lin K-C, Liing R-J, Wu C-Y, Chen C-L, Chang K-C. Validity, responsiveness, and minimal clinically important difference of EQ-5D-5L in stroke patients undergoing rehabilitation. Qual Life Res. 2016;25(6):1585–96. 21. Steyerberg EW. Clinical prediction models : a practical approach to
development, validation and updating. New York: Springer; 2010. 22. Schaake K, Burgers J, Mulder CH. Ethnicity at the individual and
neighborhood level as an explanation for moving out of the neighborhood. Popul Res Policy Rev. 2010;29(4):593–608.
23. Taphoorn MJ, Sizoo EM, Bottomley A. Review on quality of life issues in patients with primary brain tumors. Oncologist. 2010;15(6):618–26. 24. Akaike H. Information theory and an extension of the maximum likelihood
principle. In: Parzen E, Tanabe K, Kitagawa G, editors. Selected papers of Hirotugu Akaike. New York, NY: Springer New York; 1998. p. 199–213. 25. Colin Cameron A, Windmeijer FAG. An R-squared measure of goodness
of fit for some common nonlinear regression models. J Econ. 1997; 77(2):329–42.
26. Bray BD, Campbell J, Cloud GC, Hoffman A, James M, Tyrrell PJ, et al. Derivation and external validation of a case mix model for the standardized reporting of 30-day stroke mortality rates. Stroke. 2014;45(11):3374–80. 27. Teale E, Young J, Dennis M, Sheldon T. Predicting patient-reported stroke
outcomes: a validation of the six simple variable prognostic model. Cerebrovasc Dis Extra. 2013;3(1):97–102.
28. Wang R, Langhammer B. Predictors of quality of life for chronic stroke survivors in relation to cultural differences: a literature review. Scand J Caring Sci. 2018;32(2):502–14.
29. Carod-Artal FJ, Egido JA. Quality of Life after Stroke: The Importance of a Good Recovery. Cerebrovasc Dis. 2009;27(suppl 1):204–14.
autonomy in the first year in stroke units in Spain. Health Qual Life Outcomes. 2015;13:36.
31. Reyes-Gibby CC, Anderson KO, Morrow PK, Shete S, Hassan S. Depressive symptoms and health-related quality of life in breast cancer survivors. J Women's Health (Larchmt). 2012;21(3):311–8.
32. Wenzel L, DeAlba I, Habbal R, Kluhsman BC, Fairclough D, Krebs LU, et al. Quality of life in long-term cervical cancer survivors. Gynecol Oncol. 2005; 97(2):310–7.
33. Toni D, Lorenzano S, Puca E, Prencipe M. The SITS-MOST registry. Neurol Sci. 2006;27(3):s260–s2.
34. Sentinel Stroke National Audit Programme (SSNAP).https://www.rcplondon. ac.uk/projects/outputs/sentinel-stroke-national-audit-programme-ssnap. Accessed September 24, 2019.
35. Bernhardt J, Zorowitz RD, Becker KJ, Keller E, Saposnik G, Strbian D, et al. Advances in stroke 2017. Stroke. 2018;49(5):e174–e99.
36. Porter ME, Teisberg EO. Redefining health care: creating value-based competition on results: Harvard business press; 2006.
Publisher’s Note