R E S E A R C H
Open Access
Label-free quantitative mass spectrometry
analysis of differential protein expression in
the developing cochlear sensory epithelium
Lancia N. F. Darville
*and Bernd H. A. Sokolowski
Abstract
Background:The sensory epithelium of the inner ear converts the mechanical energy of sound to electro-chemical energy recognized by the central nervous system. This process is mediated by receptor cells known as hair cells that express proteins in a timely fashion with the onset of hearing.
Methods:The proteomes of 3, 14, and 30 day-old mice cochlear sensory epithelia were revealed, using label-free quantitative mass spectrometry (LTQ-Orbitrap). Statistical analysis using a one-way ANOVA followed by Bonferroni’s post-hoctest was used to show significant differences in protein expression. Ingenuity Pathway Analysis was used to observe networks of differentially expressed proteins, their biological processes, and associated diseases, while Cytoscape software was used to determine putative interactions with select biomarker proteins. These candidate biomarkers were further verified using Western blotting, while coimmunoprecipitation was used to verify putative partners determined using bioinformatics.
Results:We show that a comparison across all three proteomes shows that there are 447 differentially expressed proteins, with 387 differentially expressed between postnatal day 3 and 30. Ingenuity Pathway Analysis revealed ~ 62% of postnatal day 3 downregulated proteins are involved in neurological diseases. Several proteins are expressed exclusively on P3, including Parvinα, Drebrin1 (Drb1), Secreted protein acidic and cysteine rich (SPARC), Transmembrane emp24 domain-containing protein 10 (Tmed10). Coimmunoprecipitations showed that Parvin and SPARC interact with integrin-linked protein kinase and the large conductance calcium-activated potassium channel, respectively.
Conclusions:Quantitative mass spectrometry revealed the identification of numerous differentially regulated proteins over three days of postnatal development. These data provide insights into functional pathways regulating normal sensory and supporting cell development in the cochlea that include potential biomarkers. Interacting partners of two of these markers suggest the importance of these complexes in regulating cellular structure and synapse development.
Keywords:Cochlea, Development, Networks, Quantitative mass spectrometry, Proteomics, Sensory epithelium, Hair cells
* Correspondence:[email protected]
Morsani College of Medicine, Department of Otolaryngology-HNS, University of South Florida, 12901 Bruce B. Downs Blvd, Tampa, FL 33612, USA
Background
The cochlear sensory epithelium contains specialized re-ceptors known as hair cells, which are responsible for transducing incoming mechanical signals for processing by the brain [1]. Damage to hair cells can lead to hearing loss or impairment in both humans and mouse [2]. The perception and processing of sound are dependent on the expression of many proteins of which many are reg-ulated during the onset of hearing. As structural and functional development continues, hearing sensitivity in-creases on postnatal days 12–14 (P12-P14) [3]. A num-ber of studies have investigated gene expression in the inner ear and its age-related changes [4–7]. There have been far fewer studies of the inner ear performed at the proteome level [8–14], and even fewer that have ex-plored protein pathways [15,16].
Proteomics can provide insights into understanding complex biological systems by analyzing expression, function, modifications, and interactions. To determine the relative differences in protein expression in a cell or tissue, at a given time or under a particular condition, one can use quantitative MS-based proteomics that uses labeled or label-free proteins [17]. Commonly used label-ing techniques include isobaric tags for relative and ab-solute quantitation (iTRAQ) [18], isotope-coded affinity tags (ICAT) [19], tandem mass tags (TMT) [20] and stable isotope labeling by amino acids in cell culture (SILAC) [21]. These techniques are relatively accurate but have limitations, since they are costly, limited by the number of samples that can be analyzed per experiment, and have incomplete labeling efficiencies [17, 22]. In label-free quantitation, two approaches can be used, (i) measurement of the chromatographic elution peak area [23] or (ii) spectral counting [24]. Measurement of peak area involves calculating and comparing the mean inten-sity of peak areas for all peptides from each protein in the biological sample [25]. In contrast, spectral counting is based on the number of MS/MS spectra generated from a protein. The more abundant the protein in the biological sample, the more peptides will be selected for fragmentation [17]. Both techniques are useful for quan-tifying differences between proteins, especially for pro-teins of low abundance [26].
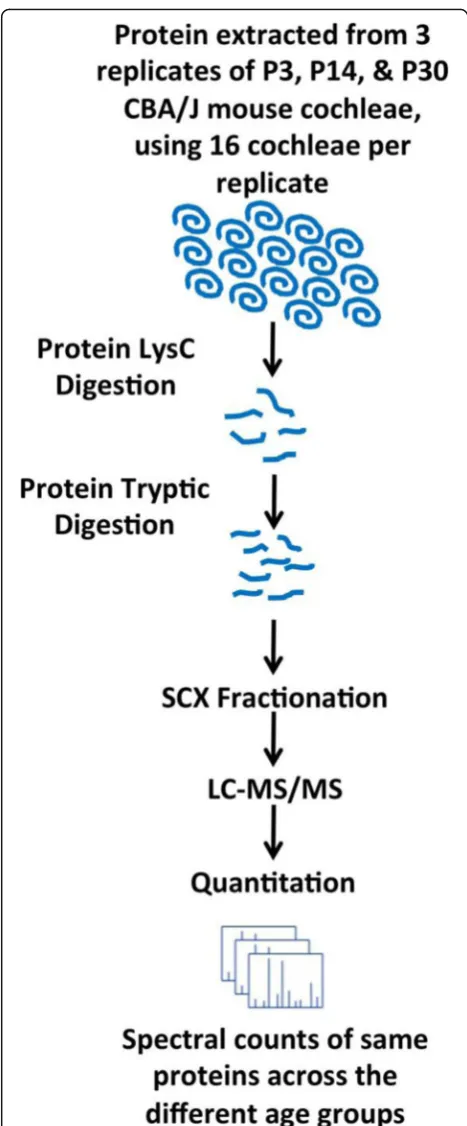
In the present study, we used label-free quantitative proteomics to identify proteins that are differentially expressed in the cochlear sensory epithelium of the mouse between three different ages. We collected pro-tein samples from the cochlear sensory epithelia of P3, P14, and P30 mice, performed multi-digestion proce-dures, separated peptides using SCX chromatography and analyzed peptides with nano RP-LC-MS/MS. Differ-ential protein expression was determined using spectral counting and an ANOVA was used to determine signifi-cant differences in protein expression. Functions for
differentially expressed proteins and putative protein partners for select biomarkers were explored using bio-informatics. For verification, select proteins that were differentially expressed were analyzed using immuno-blotting and putative partners, determined via bioinfor-matics, were verified using coIP. This is the first study to identify regulated proteins from the mouse cochlear sen-sory epithelia before, during, and after the onset of hearing.
Methods
Protein extraction from sensory epithelia
The experiments described herein were approved by the University of South Florida Institutional Animal Care and Use Committee, as set forth under the guidelines of the National Institutes of Health. To obtain enough pro-tein for analysis, cochleae were isolated from 16 P3, P14, and P30 CBA/J mice. In addition, three biological repli-cates were prepared for each age group. All dissections were accomplished in cooled PBS, while maintaining the dissecting dish on ice. To extract a cochlea, the tym-panic bulla was excised after which the bone, ligament, and stria vascularis was removed, isolating the sensory epithelium along with the modiolus. The modiolus was kept intact, initially, since this method provided an intact extraction of the sensory epithelium. Three biological replicates from each age group were prepared for LC-MS/MS analysis. In each experiment, the cochlear sensory epithelium was washed gently 3× in 1X PBS, centrifuged for 3 min at 1000g, and the supernatant re-moved. These washes allowed for the removal of the modiolus prior to detergent treatment. Cochlear sensory epithelia were sonicated in lysis buffer containing 4% (w/ v) SDS, 100 mM Tris-HCl, pH 8.0, 120 mM NaCl, 50 mM NaF, 5 mM EDTA, 500 μg/mL AEBSF, 10 μg/ mL leupeptin, 100 μg/mL pepstatin, 2μg/mL aprotinin, and 1 mg/mL microcystin using a sonic dismembrator (Model 100; Thermo Fisher). The extract was incubated on ice for 30 min, then heated at 95 °C for 4 min, followed by centrifugation at 16000gat 4 °C for 15 min. The supernatant was removed and the pellet extracted in lysis buffer. Both lysates were combined, then centri-fuged at 20800 g at 4 °C for 60 min. The supernatant was retained for digestion and analysis.
Multi-FASP digestion
centrifugation at 14000gfor 10 min. To the concentrate on the filter, 100μL of urea solution was added and cen-trifuged at 14000 gfor 15 min then repeated 2X. There was 100μL of 100 mM ABC solution added to the spin filter and centrifuged at 14000 g for 10 min then re-peated 2X. Then, 0.1 μg/μL of LysC was added 1:100 and incubated O/N at 30 °C. Following incubation, 40 μL of 100 mM ABC solution was added and centri-fuged at 14000gfor 10 min and repeated 1X to increase peptide yield. Finally, 50μL of 0.5 M NaCl solution was added to the spin filter and centrifuged at 14000 x g for 10 min.
Following the first digestion, spin filters were washed with 40μL of urea followed with 2X washes of 40μL of ddH2O, then, 3X washes with 100 μL of 50 mM ABC solution, followed by adding 0.1 μg/μL of trypsin in 1:100 and incubating at 37 °C O/N. Peptides were eluted, acidified with trifluoroacetic acid (TFA), and desalted on a C18 MacroSpin column (The Nest Group, Southboro, MA). The concentration of the peptides was determined using a microplate colorimetric assay (BioRad).
Cation exchange chromatography
Peptides were separated off-line on a 200 × 2.1 mm, 5 μm SCX column (Polysulfoethyl A, The Nest Group) using a gradient of 2–40% B over 50 min with a flow rate of 250 μL/min. Solvent A was 5 mM ammonium formate, pH 3.0 in 25% acetonitrile and 75% ddH2O. Solvent B was 500 mM ammonium formate, pH 6.0 in 25% acetonitrile and 75% ddH2O. The separation was monitored at 280 nm followed by collecting fractions every 4 min. Fractions were dried using a vacuum centri-fuge and resuspended in 15 μL of 0.1% FA for MS analysis.
LC-MS/MS
Each SCX fraction was analyzed by nano LC-MS/MS. Prior to separation, 5 μL of each peptide fraction was injected onto a 100μm × 25 mm sample trap (New Ob-jective, Woburn, MA) to remove salts and contaminants. Peptide separation was performed on a 75 μm × 10 cm C18column (New Objective, Woburn, MA) using a gra-dient from 98% solvent A (95% ddH2O and 5% aceto-nitrile containing 0.1% FA) and 2% solvent B (80% acetonitrile and 20% ddH2O containing 0.1% FA) to 40% solvent B over 180 min with a flow rate of 300 nL/min on an Eksigent nanoLC (Thermo Scientific Inc.). Mass spectrometry data were collected using an LTQ Orbitrap mass spectrometer (Thermo Scientific Inc.). A DDA “top 10”method was used with an isolation window of 3 around the precursor and 35 normalized collision energy value (NCE). Full MS scans were acquired in the Orbi-trap mass analyzer over the m/z 300–1800 range with
resolution 60,000 and MS/MS resolution was 7, 500 with a minimal signal of 2.00E + 03. The MS proteomics data are deposited in the ProteomeXchange Consortium (http://proteomecentral.proteomexchange.org) via the PRIDE partner repository [27] with the dataset identifier PXD001973.
Data analysis
Sequences were assigned using the MASCOT search en-gine version 2.3 (Matrix Science) against the UniProt database (2012.01) selected for Mus musculus (108,308 entries). The parent and fragment ion maximum precur-sors were set to ±8 ppm and ± 1.2 Da, respectively. The search included a fixed modification of carbamidomethyl of cysteine and variable modifications of oxidation of methionine and protein N-terminal acetylation. A max-imum of two missed cleavages were allowed. Scaffold (Version 4.3.2, Proteome Software) was used to validate peptide and protein identifications. Peptide and protein identifications were accepted if they were greater than 95 and 99% probability, respectively, and contained two or more identified peptides. Peptide assignments were also manually verified by inspection of the tandem mass spectra. In addition, a false discovery rate (i.e. false posi-tives) was determined using Scaffold using the empirical method by counting the number of reverse or randomized hits and dividing by the number of forward hits [28, 29]. Proteins were eliminated when identified as a contamin-ant, such as keratin. Proteins identified in all three repli-cates were reported. In Scaffold, spectral counts were normalized to the sum of all spectral counts prior to stat-istical analysis to observe significance. The data were exported from Scaffold and analyzed using a one-way ANOVA followed by the Bonferonni test using Statistica software (Version 12, StatSoft, Inc.). Proteins between age groups were considered significantly different when p≤ 0.05. Spectral counts correlate with protein abundance [24]. Therefore, the mean normalized spectral counts were used to determine fold changes between age groups.
for each network. The score is derived from a p-value and scores of 2 or higher have at least a 99% confidence of not being generated by random chance alone. IPA identifies the most significant diseases and biological functions of the differentially expressed proteins and the top five are categorized and reported based on their p-values.
Cytoscape software [32] was used to discover potential interacting proteins for specific protein markers discovered using MS. The databases used include IntAct, Molecular INTeraction database (MINT), Database of Interacting Proteins (DIP), UniProt, BHF-UCL, MatrixDB, and (Interologous Interaction Database (I2D-IMEx). All interacting proteins were filtered to show only mouse proteins in the interactome.
Western blot analysis of proteins differentially expressed on P3 and P30
Lysates were prepared from 16 P3 and P30 CBA/J mice cochleae sensory epithelia, as described above. Protein concentrations were determined by DC Protein assay (Bio-Rad) and equal amounts of proteins (3μg/lane) from P3 and P30 tissues were resolved on Criterion 4–15% Tris-HCl SDS-PAGE gels (Bio-Rad) and transferred onto a nitrocellulose membrane (Amersham Biosciences). Blots were blocked at RT for 1 h in Tris-buffered saline/Tween 20 [50 mM Tris-HCl, pH 7.5, 120 mM NaCl, 0.05% Tween 20] with 4.5% milk and then probed with respect-ive primary antibodies including, anti-Dbn1 at 1:500, anti-Parvin at 1:800, anti-SPARC at 1:1000, and anti-Tmed10 at 1:1000 (all from Proteintech Group) with rocking O/N at 4 °C. Beta-actin was used as a protein loading control using anti-β actin rabbit polyclonal anti-body (Abcam) for detection. Before adding secondary antibody, blots were washed 1X with TBS and 2X with 0.05% Tween/TBS. Membranes were then incubated with a donkey anti-rabbit horseradish peroxidase-conjugated secondary antibody at 1:5000 with rocking at RT for 1 h. Secondary antibody was removed and blots washed 1X with TBS, 2X with 0.05% Tween/TBS, and a final wash with TBS. Immunoreactive bands were developed using ECL (Amersham Biosciences) and Magic Mark XP (Invitrogen) was used as the protein standard to estimate relative mobilities.
Coimmunoprecipitation
Lysates were prepared from 16 P3 CBA/J mice cochleae sensory epithelia. The lysate for each experiment was di-vided equally into three tubes and diluted ~ 2 fold with lysis buffer containing 20 mM Tris-HCl, pH 7.5, 120 mM NaCl, 1 mM NaF, 2 mM EDTA, 1 mM EGTA, 500μg/mL AEBSF, 10 μg/mL leupeptin, 100 μg/mL pepstatin, 2 μg/mL aprotinin, and 1 mg/mL microcystin. One tube was used for an IP of the protein itself (positive control),
the second was used to coprecipitate a partner, while the third tube was used as a negative control. IPs were per-formed using the immunocomplex capture method by first adding 5 μg of either Kcnma1 polyclonal anti-body (Chemicon; aa 1184–1200 of mouse Kcnma1) or anti-integrin-linked protein kinase polyclonal antibody (Proteintech Group) to two of three tubes containing lys-ate and then incubating by rocking for 1 h at 4 °C. Nega-tive controls consisted of incubating lysate in the third tube with ChromPure rabbit IgG (Jackson Laboratories). ThirtyμL of rec-Protein G Sepharose 4B Beads (Invitro-gen) were then added to the three samples and incubated for 1 h at 4 °C. Immunocomplexed beads were washed 1X in PBS, 3X in PBS/0.1% Triton x-100, 1X in PBS, and immunocomplexes recovered by heating at 95 °C for 5 min in Laemmli sample buffer (Sigma-Aldrich). Samples were fractionated on a 7.5% Tris-HCl gel (Bio-Rad) and transferred to a nitrocellulose membrane (Amersham Bio-sciences). Blots were blocked at RT for 1 h in Tris-buffered saline/Tween 20 [50 mM Tris-HCl, pH 7.5, 120 mM NaCl, 0.05% Tween 20] with 4.5% milk and probed with either anti-SPARC polyclonal antibody at 1:1000 (Proteintech Group) or Parvin polyclonal anti-body at 1:800 (Proteintech Group) with rocking O/N at 4 °C to determine the Kcnma1 and Ilk coprecipitates, re-spectively. The secondary antibody for both consisted of a mouse anti-rabbit light chain at 1:15,000 with rocking at RT for 1 h. Bands were developed using ECL (Amersham Biosciences) and Magic Mark XP (Invitrogen) was used as the standard.
Reciprocal coimmunoprecipitation
Reciprocal coIPs were performed as described previously in the coIP section, except antibodies to the coprecipi-tates, SPARC and Parvin were used to coprecipitate Kcnma1 and Ilk, respectively, from P3 lysate. Antibodies and techniques used in the immunocomplex capture method were as before. Blots were probed with BKα poly-clonal antibody at 1:400 (Chemicon) and Ilk-polypoly-clonal antibody at 1:500 (Proteintech Group) with rocking O/N at 4 °C, followed with donkey anti-rabbit horseradish peroxidase-conjugated secondary antibody at 1:7500 or with mouse anti-rabbit light chain at 1:15,000 with rock-ing at RT for 1 h, respectively. Negative controls were as before and positive controls consisted of lysate probed with SPARC and Parvin. Immunoreactive bands were de-veloped as described previously.
Results
Protein identification and differential expression
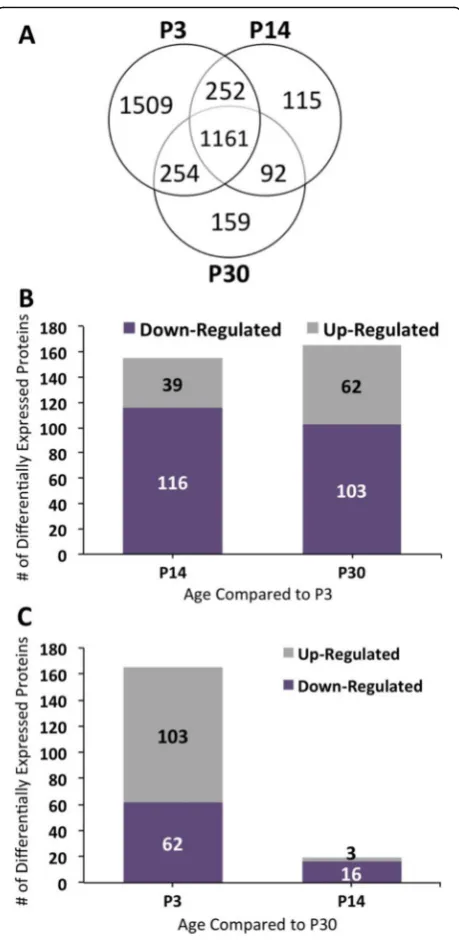
Each digest was separated into 14 fractions using SCX and analyzed by nano LC-MS/MS. Spectral counts were used to quantitatively differentiate between proteins among different ages (Fig. 1). A total of 3176, 1620, and 1666 protein were identified on P3, P14, and P30, re-spectively. All proteins identified from each age group are listed in Additional file 1: Table S1. The results in Fig. 2a show that P3 relative to the other ages has the largest number of proteins unique to its age, while there are 1197 proteins common between the three age groups. A one-way ANOVA was conducted to determine differential expression protein candidates on P3, P14, and P30 cochlear sensory epithelium. There was a statis-tically significant effect of age on protein expression (df = 15, p< 0.05; F-values are reported in Additional file2: Table S2). A Bonferonni post-hoc test revealed that 447 proteins were significantly different in abundance be-tween the three age groups (p < 0.05). There were 25 proteins differentially expressed between P14 and P30 as compared to 359 and 389 differentially expressed pro-teins between P3 and P14 and between P3 and P30, re-spectively (Additional file 2: Table S2). Among the differentially expressed proteins, from P3 compared to P14 and P30, were 307 that were common between these groups.
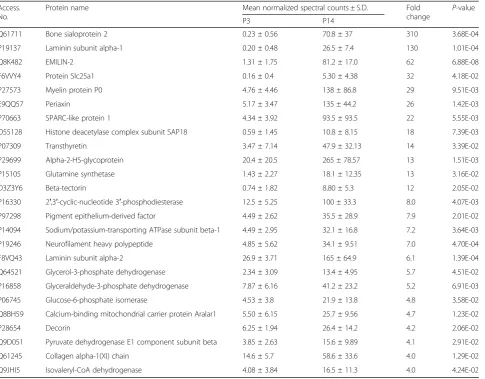
Figure2band cshow the total number of proteins ei-ther up- or downregulated per two age group compari-sons. Proteins only present at a particular age were observed separately. We compared the mean normalized spectral counts to identify proteins that were upregu-lated during development. The data show there are 359 proteins differentially expressed between P3 and P14, and of these, 116 and 39 proteins are up- and downregu-lated on P3, respectively, with a greater than two-fold change. In comparison, of the 389 proteins differentially expressed between P3 and P30, 103 and 62 are up- and downregulated on P3, respectively, with a greater than two-fold change. The 25 proteins with the largest fold change between P3 and 14 and between P3 and P30 are listed in Tables 1 and 2, respectively. A complete list is in Additional file3:Table S3.
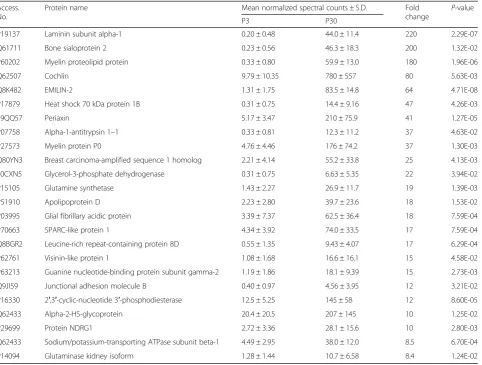
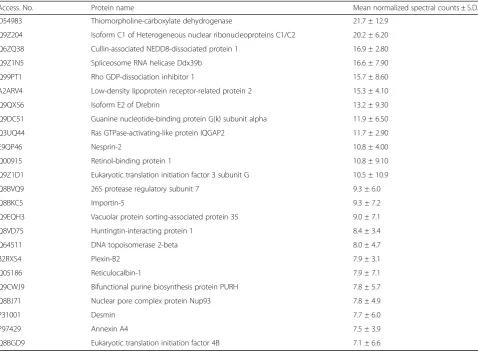
Based on the two-fold change between P3 and P30, laminin subunit alpha-1, bone sialoprotein 2, and myelin proteolipid are the most highly expressed proteins on P30. In contrast, vimentin, myosin-9, and protein disulfide-isomerase A3 are the most highly expressed proteins on P3. When comparing P3 to P14, there are 4 proteins exclusively expressed on P14, including alpha-2-macroglobulin-P, coagulation factor X, pro-thrombin, and elongation factor 1-alpha 2. Conversely, there are 200 proteins exclusively expressed on P3. Table 3 lists the top 25 proteins with the largest mean normalized spectral counts for this age, while a complete list is found in Additional file 3: Table S3. When
comparing P3 to P30, there are nine proteins that exclu-sively expressed on P30 (Table 4) and 215 proteins ex-clusively expressed on P3 (Additional file3:Table S3).
GO analysis of differentially expressed proteins
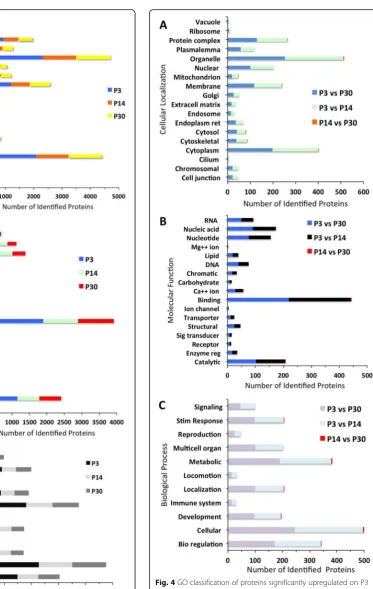
The total proteome for P3, P14, and P30 was analyzed using the Gene Ontology database to determine biological
processes, cellular localization, and molecular function. All categories were counted non-exclusively, when a pro-tein has more than one category for biological process, cellular localization, and molecular function. Cellular localization analysis of these three proteomes shows a sig-nificant number of proteins found in the cytoplasm, or-ganelle, and membrane (Fig.3a). On P3, P14, and P30, 66, 70, and 71% of proteins are in the cytoplasm, respectively, 73, 74, and 72% of proteins are in organelles, respectively, whereas 38, 41, and 43% of proteins are localized in the membrane, respectively. In contrast, the least number of proteins are localized in the cilium and vacuole. GO shows that on P3, P14, and P30 1, 2, and 2% of proteins are in the cilium, respectively and 2, 3, and 3% of proteins are localized in the vacuole, respectively. Molecular func-tion analysis shows that the most highly expressed pro-teins on P3, P14, and P30 include binding propro-teins (60, 62, and 61%, respectively), specifically nucleotide (21, 22, and 22%, respectively) and nucleic acid (18, 18, and 15%, re-spectively) binding proteins as well as proteins involved in catalytic activity (36, 38, and 38%, respectively) (Fig.3b). The GO analysis for biological processes shows that the most highly expressed proteins on P3, P14, and P30 are involved in cellular processes (72, 76, and 76%, respect-ively), metabolic processes (57, 60, and 58%, respectrespect-ively), and biological regulation (47, 48, and 47%, respectively) (Fig.3c).
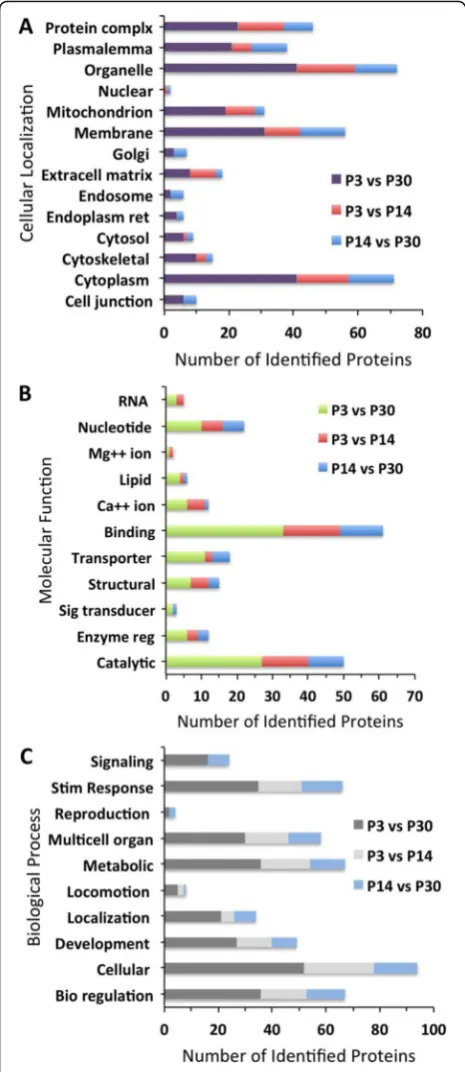
From the 447 differentially expressed proteins, the GO annotations for cellular localization (Fig. 4a), molecular function (Fig.4b), and biological process (Fig.4c) of up-regulated proteins on P3 relative to P14 and P30 show similar trends. Proteins located in organelles (72 and 65%, respectively), cytoplasm (56 and 51%, respectively), and membrane (34 and 30%, respectively) are the most highly expressed, whereas, as before, cilium (1 and 1%, respectively), vacuole (1 and 1%, respectively), and ribo-some (2 and 2%, respectively) are the most lowly expressed. When observing up and downregulated pro-teins on P3 relative to P14 and P30, these propro-teins fol-low a similar trend of expression relative to cellular localization (Fig. 5a), molecular function (Fig. 5b), and biological process (Fig. 5c). In addition, there are no downregulated proteins on P3 relative to P14 involved in signaling or reproduction. The GO analysis for cellular localization, molecular function, and biological process of proteins up- and downregulated on P14 relative to P30 follows a similar trend when compared to the other age groups. However, GO analysis shows that downregu-lated proteins for cellular localization, molecular func-tion, and biological process are significantly higher on P14 relative to P30. When observing molecular function of the most highly expressed proteins, 48% are involved in binding, 40% catalytic activity and 20% transporter ac-tivity. Among the downregulated proteins between all Fig. 2Total proteome and differentially expressed proteins in each
age groups, there are no proteins involved in immune system processes.
Functional analysis of P3 vs P14 and P3 vs P30
To determine whether there were any significant changes between P3 and P14 developing sensory epithe-lia, we used IPA to gain insights into function. All IPA analyses are found in Additional file 4: Tables S4-S11. An analysis of proteins upregulated on P3 (Additional file 4:Table S4) found that, within the physiological sys-tem development and function category, 22% associate with tissue development, while 35% associate with or-ganismal survival. Within the disease and disorders function category, many of the proteins associate with hereditary and developmental disorders. A similar IPA analysis of P3 downregulated proteins (Additional file4: Table S5) shows that a majority associate again with tis-sue development, whereas 62% associate with neuro-logical disease in the disease and disorders category. IPA
analyses determining the function of proteins exclusively expressed on P3 and P14 (Additional file 4: Tables S6 and S7) show that survival and embryonic/nervous sys-tem development proteins (35 and 33%, respectively) are important on P3. Similarly, 75 and 100% of proteins ex-clusively expressed on P14 associate with tissue morph-ology and tissue development, respectively.
IPA was utilized also to understand the functions of exclu-sively and differentially expressed proteins between P3 and P30 sensory epithelia. Analyses show that 27% of proteins upregulated on P3 associate with hereditary disorders (Additional file4:Table S8). In contrast, proteins downregu-lated on P3, are significantly involved in tissue morphology, nervous system and tissue development, while 65% of P3 downregulated proteins associate with neurological diseases (Additional file 4: Table S9). Of additional interest were proteins exclusively expressed in the respective proteomes of P3 and P30 (Additional file4:Tables S10, S11). There were 11 and 24% of proteins exclusively expressed on P3 Table 1The 25 selected proteins with upregulated expression on P14 relative to P3. The differentially expressed proteins exhibited the largest fold change
Access. No.
Protein name Mean normalized spectral counts ± S.D. Fold
change
P-value
P3 P14
Q61711 Bone sialoprotein 2 0.23 ± 0.56 70.8 ± 37 310 3.68E-04
P19137 Laminin subunit alpha-1 0.20 ± 0.48 26.5 ± 7.4 130 1.01E-04
Q8K482 EMILIN-2 1.31 ± 1.75 81.2 ± 17.0 62 6.88E-08
F6VVY4 Protein Slc25a1 0.16 ± 0.4 5.30 ± 4.38 32 4.18E-02
P27573 Myelin protein P0 4.76 ± 4.46 138 ± 86.8 29 9.51E-03
E9QQ57 Periaxin 5.17 ± 3.47 135 ± 44.2 26 1.42E-03
P70663 SPARC-like protein 1 4.34 ± 3.92 93.5 ± 93.5 22 5.55E-03
O55128 Histone deacetylase complex subunit SAP18 0.59 ± 1.45 10.8 ± 8.15 18 7.39E-03
P07309 Transthyretin 3.47 ± 7.14 47.9 ± 32.13 14 3.39E-02
P29699 Alpha-2-HS-glycoprotein 20.4 ± 20.5 265 ± 78.57 13 1.51E-03
P15105 Glutamine synthetase 1.43 ± 2.27 18.1 ± 12.35 13 3.16E-02
D3Z3Y6 Beta-tectorin 0.74 ± 1.82 8.80 ± 5.3 12 2.05E-02
P16330 2′,3′-cyclic-nucleotide 3′-phosphodiesterase 12.5 ± 5.25 100 ± 33.3 8.0 4.07E-03
P97298 Pigment epithelium-derived factor 4.49 ± 2.62 35.5 ± 28.9 7.9 2.01E-02
P14094 Sodium/potassium-transporting ATPase subunit beta-1 4.49 ± 2.95 32.1 ± 16.8 7.2 3.64E-03
P19246 Neurofilament heavy polypeptide 4.85 ± 5.62 34.1 ± 9.51 7.0 4.70E-04
F8VQ43 Laminin subunit alpha-2 26.9 ± 3.71 165 ± 64.9 6.1 1.39E-04
Q64521 Glycerol-3-phosphate dehydrogenase 2.34 ± 3.09 13.4 ± 4.95 5.7 4.51E-02
P16858 Glyceraldehyde-3-phosphate dehydrogenase 7.87 ± 6.16 41.2 ± 23.2 5.2 6.91E-03
P06745 Glucose-6-phosphate isomerase 4.53 ± 3.8 21.9 ± 13.8 4.8 3.58E-02
Q8BH59 Calcium-binding mitochondrial carrier protein Aralar1 5.50 ± 6.15 25.7 ± 9.56 4.7 1.23E-02
P28654 Decorin 6.25 ± 1.94 26.4 ± 14.2 4.2 2.06E-02
Q9D051 Pyruvate dehydrogenase E1 component subunit beta 3.85 ± 2.63 15.6 ± 9.89 4.1 2.91E-02
Q61245 Collagen alpha-1(XI) chain 14.6 ± 5.7 58.6 ± 33.6 4.0 1.29E-02
that are relevant to tissue morphology and renal and uro-logical disease, respectively. On P30, proteins predominate that are relevant to tissue morphology and development. Proteins exclusively expressed on P30 associate with neurological disease and hereditary disorder.
Validation of potential candidate protein markers by western blot, coIP, and reciprocal coIP
Western blots were used to validate the expression of se-lected proteins detected by MS. Candidate proteins were selected based on their exclusive expression between age groups (e.g., P3 relative to P14 and/or P30) as well as by their different functions and newly identified expression in the cochlea. Four potential protein markers identified by MS analysis as exclusively expressed on P3, Parvin, Dbn1, Tmed10, and SPARC, were chosen for verification by com-paring expression at P3 to P30. Equal amounts of protein lysate were used from P3 and P30. The results verify the MS findings, since the panels show exclusive expression of Dbn1 (100 & 120 kDa), Parvin (42 kDa), Tmed (21 kDa),
and SPARC (43 kDa) on P3 but not on P30 (Fig.6), except for Parvin. A lowly expressed peptide species of ~ 50 kDa was found, suggesting a modified form of Parvin.
Cytoscape analysis of two potential biomarker proteins that were exclusively expressed on P3, Parvin and SPARC, revealed potential binding partners relevant to their function (data not shown). Parvin was found to pu-tatively interact with Ilk, whereas SPARC was found to associate with the Kcnma1, also known as the large con-ductance calcium-activated potassium channel, or BK. CoIP and reciprocal coIP was used to verify these puta-tive protein-protein interactions. The immunocomplex capture method was used for the coIP and reciprocal coIP of Parvin with Ilk and SPARC with Kcnma1. Kcnma1 coprecipitated SPARC as demonstrated by a peptide species of 50 kDa and SPARC coprecipitated BK as demonstrated by a peptide species of 135 kDa (Fig.7aand b). Ilk coprecipitated Parvin as demonstrated by a peptide species of 42 kDa and Parvin coprecipitated the lowly expressed Ilk, as demonstrated by a peptide Table 2The 25 selected proteins with upregulated expression on P30 relative to P3. These differentially expressed proteins
exhibited the largest fold change Access.
No.
Protein name Mean normalized spectral counts ± S.D. Fold
change
P-value
P3 P30
P19137 Laminin subunit alpha-1 0.20 ± 0.48 44.0 ± 11.4 220 2.29E-07
Q61711 Bone sialoprotein 2 0.23 ± 0.56 46.3 ± 18.3 200 1.32E-02
P60202 Myelin proteolipid protein 0.33 ± 0.80 59.9 ± 13.0 180 1.96E-06
Q62507 Cochlin 9.79 ± 10.35 780 ± 557 80 5.63E-03
Q8K482 EMILIN-2 1.31 ± 1.75 83.5 ± 14.8 64 4.71E-08
P17879 Heat shock 70 kDa protein 1B 0.31 ± 0.75 14.4 ± 9.16 47 4.26E-03
E9QQ57 Periaxin 5.17 ± 3.47 210 ± 75.9 41 1.27E-05
P07758 Alpha-1-antitrypsin 1–1 0.33 ± 0.81 12.3 ± 11.2 37 4.63E-02
P27573 Myelin protein P0 4.76 ± 4.46 176 ± 74.2 37 1.30E-03
Q80YN3 Breast carcinoma-amplified sequence 1 homolog 2.21 ± 4.14 55.2 ± 33.8 25 4.13E-03
E0CXN5 Glycerol-3-phosphate dehydrogenase 0.31 ± 0.75 6.63 ± 5.35 22 3.94E-02
P15105 Glutamine synthetase 1.43 ± 2.27 26.9 ± 11.7 19 1.39E-03
P51910 Apolipoprotein D 2.23 ± 2.80 39.7 ± 23.6 18 1.53E-02
P03995 Glial fibrillary acidic protein 3.39 ± 7.37 62.5 ± 36.4 18 7.59E-04
P70663 SPARC-like protein 1 4.34 ± 3.92 74.0 ± 33.5 17 7.59E-04
Q8BGR2 Leucine-rich repeat-containing protein 8D 0.55 ± 1.35 9.43 ± 4.07 17 6.29E-04
P62761 Visinin-like protein 1 1.08 ± 1.68 16.6 ± 16.1 15 4.58E-02
P63213 Guanine nucleotide-binding protein subunit gamma-2 1.19 ± 1.86 18.1 ± 9.39 15 2.73E-03
Q9JI59 Junctional adhesion molecule B 0.40 ± 0.97 4.56 ± 3.95 12 3.21E-02
P16330 2′,3′-cyclic-nucleotide 3′-phosphodiesterase 12.5 ± 5.25 145 ± 58 12 8.60E-05
Q62433 Alpha-2-HS-glycoprotein 20.4 ± 20.5 207 ± 145 10 1.25E-02
P29699 Protein NDRG1 2.72 ± 3.36 28.1 ± 15.6 10 2.80E-03
Q62433 Sodium/potassium-transporting ATPase subunit beta-1 4.49 ± 2.95 38.0 ± 12.0 8.5 6.70E-04
species of ~ 51 kDa (Fig.7candd). Negative controls con-sisted of lysate mixed with IgG-coated beads, resulting in no immunoreactive band. Positive controls consisted of an IP of the protein itself.
Discussion
The application of MS-based label-free quantitative pro-teomics resulted in the identification of 447 differentially
expressed proteins in the developing mouse cochlear sensory epithelium at P3, P14, and P30. Proteins such as SPARC and unconventional myosin-VI (Myo6), known to be associated with cochlear development, hearing, and deafness, were identified among these proteins. In addition, newly identified proteins recently reported to be associated with the cochlea, such as Parvin [8], exhib-ited differential protein expression.
Table 3The 25 selected proteins exclusively expressed on P3 relative to P14. These proteins exhibited the highest mean normalized spectral count
Access. No. Protein name Mean normalized spectral counts ± S.D.
O54983 Thiomorpholine-carboxylate dehydrogenase 21.7 ± 12.9
Q9Z204 Isoform C1 of Heterogeneous nuclear ribonucleoproteins C1/C2 20.2 ± 6.20
Q6ZQ38 Cullin-associated NEDD8-dissociated protein 1 16.9 ± 2.80
Q9Z1N5 Spliceosome RNA helicase Ddx39b 16.6 ± 7.90
Q99PT1 Rho GDP-dissociation inhibitor 1 15.7 ± 8.60
A2ARV4 Low-density lipoprotein receptor-related protein 2 15.3 ± 4.10
Q9QXS6 Isoform E2 of Drebrin 13.2 ± 9.30
Q9DC51 Guanine nucleotide-binding protein G(k) subunit alpha 11.9 ± 6.50
Q3UQ44 Ras GTPase-activating-like protein IQGAP2 11.7 ± 2.90
E9QP46 Nesprin-2 10.8 ± 4.00
Q00915 Retinol-binding protein 1 10.8 ± 9.10
Q9Z1D1 Eukaryotic translation initiation factor 3 subunit G 10.5 ± 10.9
Q8BVQ9 26S protease regulatory subunit 7 9.3 ± 6.0
Q8BKC5 Importin-5 9.3 ± 7.2
Q9EQH3 Vacuolar protein sorting-associated protein 35 9.0 ± 7.1
Q8VD75 Huntingtin-interacting protein 1 8.4 ± 3.4
Q64511 DNA topoisomerase 2-beta 8.0 ± 4.7
B2RXS4 Plexin-B2 7.9 ± 3.1
Q05186 Reticulocalbin-1 7.9 ± 7.1
Q9CWJ9 Bifunctional purine biosynthesis protein PURH 7.8 ± 5.7
Q8BJ71 Nuclear pore complex protein Nup93 7.8 ± 4.9
P31001 Desmin 7.7 ± 6.0
P97429 Annexin A4 7.5 ± 3.9
Q8BGD9 Eukaryotic translation initiation factor 4B 7.1 ± 6.6
Table 4Proteins exclusively expressed on P30 relative to P3
Access. No. Protein name Mean normalized spectral counts ± S.D.
P62631 Elongation factor 1-alpha 2 20.7 ± 9.79
Q6GQT1 Alpha-2-macroglobulin-P 11.5 ± 4.54
P19221 Prothrombin 10.7 ± 6.05
P17809 Acyl-CoA synthetase long-chain family member 6 9.40 ± 8.54
Q5ICG5 Solute carrier family 2, facilitated glucose transporter member 1 8.40 ± 8.77
P22599 Alpha-1-antitrypsin 1–2 5.80 ± 4.88
Q99K67 Alpha-aminoadipic semialdehyde synthase 4.50 ± 3.79
P00920 Carbonic anhydrase 2 4.30 ± 3.82
Fig. 3GO classification of proteins identified from P3, P14, and P30 sensory epithelia. Histograms represent (a) cellular components, (b) molecular function, and (c) biological process
Differential protein expression
The number of up- and downregulated proteins signifi-cantly decreased with age when comparing protein ex-pression across the three age groups. These results
indicate that there are several structural and functional changes that occur in the P3 mouse cochlear sensory epi-thelium. These results are consistent with previous reports of structural changes in the aging cochlea [33,34]. When compared to P3, the number of upregulated proteins sig-nificantly increases with age, whereas downregulated pro-teins show a small decrease. The increase in upregulated protein expression with increased age suggests that many proteins may be involved in physiological and morpho-logical changes that lead to and maintain function. To bet-ter understand the significance of these differentially expressed proteins, those related to the development and Fig. 5GO classification of proteins significantly downregulated on
P3 compared to P14 or P30 and P14 compared to P30. Histograms represent (a) cellular components, (b) molecular function, and (c) biological process
function of the inner ear were further analyzed using GO and IPA.
Previously, we reported many newly identified pro-teins in the cochlea [8]. In the present study, we ob-served that Parvin α and Dbn1, are exclusively expressed on P3 relative to P14, whereas Tmd10 is exclusively expressed on P3 relative to P30. Parvin α is a member of the parvin family of actin-binding proteins and is involved in the reorganization of the actin cytoskeleton, formation of lamellipodia and ciliogenesis [35, 36]. Dbn1 is an actin-binding protein found in the central nervous system that regulates the dendritic spine shape of neurons. This protein plays an important role in the structure-based plasti-city of synapses [37], and may thus contribute to early synapse formation, a critical component in con-trolling the tonotopic organization of these spontan-eously active cells [38, 39]. Tmed10 is a member of the p24 family of type I integral-membrane proteins, which are found in the endoplasmic reticulum (ER), the intermediate compartment, and the Golgi appar-atus. They are involved in membrane trafficking be-tween the ER and Golgi complex [40]. Hence, this protein may play a role in trafficking membrane pro-teins to and from stereocilia, thereby maintaining their structure and organization [41].
Differential expression - inner ear development
Several proteins were expressed differentially that play a role in inner ear development and morphogenesis. These proteins include cadherin-1 (Cdh1), collagen alpha-1 (XI) chain (Col11a1), inactive tyrosine-protein
kinase 7 (Ptk7), SPARC, and unconventional myosin-VI (Myo6). SPARC, which is a calcium binding glycoprotein, was exclusively expressed on P3. Interestingly, through bioinformatics and coIP, we found that SPARC interacts with the BK channel. SPARC’s attributes include acting as a trigger for synapse elimination [42], potentially by de-creasing the number of docked vesicles in presynaptic ac-tive zones [43] through a protein complex that includes integrin [44]. Moreover, integrins can regulate ion chan-nels [45], so that an Integrin/BK/SPARC complex might contribute to the formation of synapses at active zones, since BK is found at both synaptic and extrasynaptic sites [46]. In comparison, Ptk7 was upregulated on P3 relative to P14 and exclusively present on P3 relative to P30. Ptk7 plays a role in cell-cell adhesion, cell migration, cell polar-ity, proliferation, actin cytoskeleton reorganization, apop-tosis, and epithelial tissue organization [47]. Its expression levels on P3, relative to P14 and P30, strongly suggest in-volvement in development prior to the onset of hearing. In contrast, Cdh1 was present exclusively on P30 relative to P14, and plays a role in cell-cell adhesions, mobility and proliferation of epithelial cells [48]. Additional proteins exclusively expressed on P3 relative to P14 include reticulocalbin-1, plexin-B2, and low-density lipoprotein receptor-related protein 2, which are involved in the de-velopment of sensory organs [49] and nervous system [50, 51] and thus may contribute to the development of the cochlear sensory epithelium.
Differential expression - hearing
A number of hearing-related proteins were expressed dif-ferentially, such as collagen alpha-1 (XI) chain, thiomorpholine-carboxylate dehydrogenase,β-tectorin, un-conventional myosin-VI, Cdh1, excitatory amino acid trans-porter 1 (Slc1a3), cochlin, and thiomorpholine-carboxylate dehydrogenase. Thiomorpholine-carboxylate dehydrogen-ase an oxidoreductdehydrogen-ase was expressed exclusively on P3, whereas Slc1a3 was expressed exclusively on P30. Proteins that were significantly upregulated on P14 and P30 and exclusively expressed on P30 relative to P3 are of interest, because they may be involved in more mature functions. Laminin subunit alpha-1 and bone sialoprotein 2 (Bsp2) showed the greatest in-crease on P14 and P30 relative to P3. Laminin, a major component of the basement membrane, is an important regulator of basement membrane assembly and is also involved in cell adhesion, migration, and growth [52]. Increased laminin expression suggests a greater involvement in basement membrane mainten-ance on P30. Previous work on this structure, using immunohistochemistry, confirms these observations [53]. Bsp2 is a key protein in mineralizing connective tissues [54] The basilar membrane of the inner ear consists of connective tissue composed of cellular and Fig. 7CoIP of putative partners to two proteins exclusively expressed
extracellular components [55]. Hence, Bsp2 may play an important role in connective tissue development in the cochlear basilar membrane.
We also identified plasmalemma proteins, such as carbonic anhydrase 2 (CA2) and solute carrier family 2 facilitated glucose transporter member 1 (Slc2a1). These proteins are exclusively expressed on P30 and contribute to auditory function. Carbonic anhydrases are thought to regulate potassium homeostasis and the endocochlear potential in the mammalian cochlea. Previous evidence, using in situ hybridization, showed that CA2 expression within mature mouse inner ear overlapped with Na-K-ATPase in type II and IV otic fibrocytes, suggesting functional relationships [56]. The glucose transporter proteins are members of the major facilitator superfamily of membrane trans-porters [57]. Neurotransmission between the inner hair cells and their afferent neurons is mediated by glutamate receptors [58]. Glutamate, at low levels, is essential to ensure a high signal-to-noise ratio for af-ferent neurotransmission and preventing excitotoxic damage to the afferent neurons [59]. High-affinity glutamate transporters are required to rapidly clear synaptic glutamate [60].
Functional analysis
A number of proteins upregulated, on P3 relative to P14 and P30, associate with hereditary disorders, sug-gesting these proteins may play a role in genetic hear-ing loss. These proteins included 14–3-3 epsilon (Ywhae), myosin heavy chain 9 (Myh9), myosin VI (Myo6), and structural maintenance of chromosomes protein 3 (Smc3). The 14–3-3 proteins are a family of regulatory proteins that impact various neurological functions, including neural signaling and develop-ment, and neuroprotection [61]. These proteins also play significant regulatory roles in apoptosis, metabol-ism control, and signal transduction [62] and are as-sociated with many neurodegenerative diseases [61]. Myh9 and Myo6 mutations underlie deafness [63, 64]. Myh9 is expressed in the inner and outer hair cells, spiral ligament and Reissner’s membrane [65]. Myo6 is important for stereocilia development, morpho-logical and functional maturation of the inner hair cell ribbon synapses, and in anchoring the apical hair cell membrane to the cuticular plate [66].
The biological functions predicted for proteins downregulated on P3 relative P14 and P30, as well as proteins exclusively expressed on P14 and P30 relative to P3, are associated with neurological disease as well as tissue development and morphology. This result suggests that these proteins may function in sensori-neural hearing loss and that some development and maintenance continues after the onset of hearing.
There were three proteins associated with neurological dis-ease as well as tissue development, including ADP/ATP translocase 2 (Slc25a5), 2′,3′-cyclic-nucleotide 3′ -phospho-diesterase (Cnp), and sodium/potassium-transporting ATPase subunit beta-1 (Atp1b1). Slc25a5 plays a role in ion transport and Cnp is a membrane-bound pro-tein that serves as a regulator of tubulin polymerization and microtubule distribution [67]. Atp1b1 is a key protein for maintaining cochlear homeostasis. In contrast, the Na+, K + -ATPases take up K+ with high affinity and drive further uptake of K+ via the Na +–2Cl−–K+ cotransporter, thereby maintaining cochlear homeostasis and function [68].
A recently identified protein in the inner ear, acto-paxin (parvin α) [8] is associated with organ morph-ology. This protein is found exclusively on P3 relative to P14 and interacts with Ilk in the P3 cochlea, as con-firmed by our coIPs. Interestingly, a recent study sug-gests that the integrin/pinch1/parvin (IPP) protein complex regulates apico-basal polarity of mammary cells [69]. Hence, parvin’s early expression may contribute to regulating actin organization at the apical and basal poles of cochlear sensory cells.
Conclusion
Additional Files
Additional file 1:Table S1.A complete list of proteins from P3, P14, and P30 proteome. (XLSX 193 kb)
Additional file 2:Table S2.Statistical analysis results of differentially expressed proteins using a one-way ANOVA and post-hoc test. (XLS 162 kb)
Additional file 3:Table S3.A complete list of differentially expressed proteins on P3, P14, and P30. (XLSX 88 kb)
Additional file 4:Table S4.Summary of IPA of proteins upregulated on P3 relative P14.Table S5.Summary of IPA of proteins downregulated on P3 relative P14.Table S6.Summary of IPA of proteins exclusively expressed on P3 relative P14.Table S7.Summary of IPA of proteins exclusively expressed on P14 relative to P3.Table S8.Summary of IPA of proteins upregulated on P3 relative P30.Table S9.Summary of IPA of proteins downregulated on P3 relative P30.Table S10.Summary of IPA of exclusively expressed on P3 relative to P30.Table S11.Summary of IPA of proteins exclusively expressed on P30 relative to P3. (XLSX 25 kb)
Abbreviations
ABC:Ammonium bicarbonate; AEBSF: 4-benzenesulfonyl fluoride hydrochloride; ANOVA: Analysis of variance; CNS: Central nervous system; coIP: Coimmunoprecipitation; DTT: Dithiothreitol; ER: Endoplasmic reticulum; FA: Formic acid; FASP: Filter aided sample preparation; GO: Gene Ontology; IAA: Iodoacetamide; ICAT: Isotope-coded affinity tags;
IP: Immunoprecipitation; IPA: Ingenuity Pathway Analysis; IPA: Ingenuity Pathway Analysis; iTRAQ: Isobaric tags for relative and absolute quantitation; LysC: Endoproteinase Lys-C; MS: Mass spectrometry; MS/MS: Tandem mass spectrometry; nano LC-MS/MS: Nano liquid chromatography-tandem mass spectrometry; O/N: Overnight; P3: Postnatal day 3; PBS: Phosphate buffered saline; RP: Reversed-phase; S.D.: Standard Deviation; SCX: Strong cation exchange; SDS: Sodium dodecyl sulfate; SILAC: Stable isotope labeling by amino acids in cell culture; TFA: Trifluoroacetic acid
Acknowledgments
The authors thank Dr. Kent Seeley, Director of the Center for Drug Discovery and Innovation (CDDI) Proteomics Core Facility at University of South Florida for the use of the mass spectrometers in this facility. We also thank Margaret Harvey for the cochleae dissections.
Funding
This work was supported by NIH/NIDCD grant R01 DC004295 to BHAS.
Availability of data and materials
The datasets used and/or analyzed during the current study are available from the corresponding author on reasonable request.
Author’s contributions
LD and BS planned the experiments and wrote the manuscript. LD did the analyses and interpreted the results with BS. Both authors contributed to the research and read and approved the final version of the manuscript.
Ethics approval and consent to participate Not applicable.
Consent for publication Not applicable.
Competing interests
The authors declare that they have no competing interests.
Publisher’s Note
Springer Nature remains neutral with regard to jurisdictional claims in published maps and institutional affiliations.
Received: 5 December 2017 Accepted: 26 July 2018
References
1. Fettiplace R, Hackney CM. The sensory and motor roles of auditory hair cells. Nat Rev Neurosci. 2006;7:19–29.
2. Petit C, Levilliers J, Hardelin JP. Molecular genetics of hearing loss. Annu Rev Genet. 2001;35:589–646.
3. Sonntag M, Englitz B, Typlt M, Rubsamen R. The calyx of held develops adult-like dynamics and reliability by hearing onset in the mouse in vivo. J Neurosci. 2011;31:6699–709.
4. Chatterjee S, Kraus P, Lufkin T. A symphony of inner ear developmental control genes. BMC Genet 2010; doi:https://doi.org/10.1186/1471-2156-11-68. 5. Chen ZY, Corey DP. Understanding inner ear development with gene
expression profiling. J Neurobiol. 2002;53:276–85.
6. Hildebrand MS, de Silva MG, Klockars T, Campbell CA, Smith RJ, Dahl HH. Gene expression profiling analysis of the inner ear. Hear Res. 2007;225:1–10. 7. Groves AK, Zhang KD, Fekete DM. The genetics of hair cell development
and regeneration. Annu Rev Neurosci. 2013;36:361–81.
8. Darville LN, Sokolowski BH. In-depth proteomic analysis of mouse cochlear sensory epithelium by mass spectrometry. J Proteome Res. 2013;12:3620–30. 9. Darville LN, Sokolowski BH. Bottom-up and shotgun proteomics to identify
a comprehensive cochlear proteome. J Vis Exp 2014; doi:https://doi.org/10. 3791/51186.
10. Elkan-Miller T, Ulitsky I, Hertzano R, Rudnicki A, Dror AA, Lenz DR, Elkon R, Irmler M, Beckers J, Shamir R, Avraham KB. Integration of transcriptomics, proteomics, and microRNA analyses reveals novel microRNA regulation of targets in the mammalian inner ear. PLoS One 2011; doi:https://doi.org/10. 1371/journal.pone.0018195.
11. Herget M, Scheibinger M, Guo Z, Jan TA, Adams CM, Cheng, AG, Heller S. A simple method for purification of vestibular hair cells and non-sensory cells, and application for proteomic analysis. PLoS One. 2013; doi:https://doi.org/ 10.1371/journal.pone.0066026.
12. Peng H, Liu M, Pecka J, Beisel KW, Ding SJ. Proteomic analysis of the organ of corti using nanoscale liquid chromatography coupled with tandem mass spectrometry. Int J Mol Sci. 2012;13:8171–88.
13. Thalmann I, Hughes I, Tong BD, Ornitz DM, Thalmann R. Microscale analysis of proteins in inner ear tissues and fluids with emphasis on endolymphatic sac, otoconia, and organ of Corti. Electrophoresis. 2006;27:1598–608. 14. Hickox AE, Wong AC, Pak K, Strojny C, Ramirez M, Yates JR 3rd, Ryan AF,
Savas JN. Global analysis of protein expression of inner ear hair cells. J Neurosci. 2017;37:1320–39.
15. Kathiresan T, Harvey M, Orchard S, Sakai Y, Sokolowski B. A protein interaction network for the large conductance ca(2+)-activated K(+) channel in the mouse cochlea. Mol Cell Proteomics. 2009;8:1972–87.
16. Sokolowski B, Orchard S, Harvey M, Sridhar S, Sakai Y. Conserved BK channel-protein interactions reveal signals relevant to cell death and survival. PLoS One. 2011;6:e28532.
17. Bantscheff M, Lemeer S, Savitski MM, Kuster B. Quantitative mass spectrometry in proteomics: critical review update from 2007 to the present. Anal Bioanal Chem. 2012;404:939–65.
18. Ross PL, Huang YN, Marchese JN, Williamson B, Parker K, Hattan S, et al. Multiplexed protein quantitation in Saccharomyces cerevisiae using amine-reactive isobaric tagging reagents. Mol Cell Proteomics. 2004;3: 1154–69.
19. Gygi SP, Rist B, Gerber SA, Turecek F, Gelb MH, Aebersold R. Quantitative analysis of complex protein mixtures using isotope-coded affinity tags. Nat Biotechnol. 1999;17:994–9.
20. Moulder R, Bhosale SD, Goodlett DR, Lahesmaa R. Analysis of the plasma proteome using iTRAQ and TMT-based Isobaric labeling. Mass Spectrom Rev. 2017;1–24
21. Ong SE, Mann M. Stable isotope labeling by amino acids in cell culture for quantitative proteomics. Methods Mol Biol. 2007;359:37–52.
22. Sun N, Pan C, Nickell S, Mann M, Baumeister W, Nagy I. Quantitative proteome and transcriptome analysis of the archaeon Thermoplasma acidophilum cultured under aerobic and anaerobic conditions. J Proteome Res. 2010;9:4839–50.
24. Liu H, Sadygov RG, Yates JR 3rd. A model for random sampling and estimation of relative protein abundance in shotgun proteomics. Anal Chem. 2004;76:4193–201.
25. Sun C, Xu G, Yang N. Differential label-free quantitative proteomic analysis of avian eggshell matrix and uterine fluid proteins associated with eggshell mechanical property. Proteomics. 2013;13:3523–36.
26. Dowle AA, Wilson J, Thomas JR. Comparing the diagnostic classification accuracy of iTRAQ, peak-area, spectral-counting, and emPAI methods for relative quantification in expression proteomics. J Proteome Res. 2016;5: 3550–62.
27. Vizcaino JA, Cote RG, Csordas A, Dianes JA, Fabregat A, Foster JM, et al. The PRoteomics IDEntifications (PRIDE) database and associated tools: status in 2013. Nucleic Acids Res. 2013;41:D1063–9.
28. Peng J, Elias JE, Thoreen CC, Licklider LJ, Gygi SP. Evaluation of multidimensional chromatography coupled with tandem mass spectrometry (LC/LC-MS/MS) for large-scale protein analysis: the yeast proteome. J Proteome Res. 2003;2:43–50.
29. Elias JE, Haas W, Faherty BK, Gygi SP. Comparative evaluation of mass spectrometry platforms used in large-scale proteomics investigations. Nat Methods. 2005;2:667–75.
30. Consortium TU. Reorganizing the protein space at the universal protein resource (UniProt). Nucleic Acids Res. 2012;40:D71–5.
31. Camon E, Magrane M, Barrell D, Lee V, Dimmer E, Maslen J, et al. The gene ontology annotation (GOA) database: sharing knowledge in Uniprot with gene ontology. Nucleic Acids Res. 2004;32:D262–6.
32. Cline MS, Smoot M, Cerami E, Kuchinsky A, Landys N, Workman C, et al. Integration of biological networks and gene expression data using Cytoscape. Nat Protoc. 2007;2:2366–82.
33. Jorgensen MB. Changes of aging in the inner ear. Histological studies. Arch Otolaryngol. 1961;74:164–70.
34. Frisina RD, Walton JP. Age-related structural and functional changes in the cochlear nucleus. Hear Res. 2006;216–217:216–23.
35. Olski TM, Noegel AA, Korenbaum E. Parvin, a 42 kDa focal adhesion protein, related to the alpha-actinin superfamily. J Cell Sci. 2001;114:525–38. 36. Nikolopoulos SN, Turner CE. Actopaxin, a new focal adhesion protein that
binds paxillin LD motifs and actin and regulates cell adhesion. J Cell Biol. 2000;151:1435–48.
37. Jin M, Tanaka S, Sekino Y, Ren Y, Yamazaki H, Kawai-Hirai R, et al. A novel, brain-specific mouse drebrin: cDNA cloning, chromosomal mapping, genomic structure, expression, and functional characterization. Genomics. 2002;79:686–92.
38. Sendin G, Bourien J, Rassendren F, Puel JL, Nouvian R. Spatiotemporal pattern of action potential firing in developing inner hair cells of the mouse cochlea. Proc Natl Acad Sci U S A. 2014;111:1999–2004.
39. Kros CJ, Ruppersberg JP, Rusch A. Expression of a potassium current in inner hair cells during development of hearing in mice. Nature. 1998;394:281–4. 40. Denzel A, Otto F, Girod A, Pepperkok R, Watson R, Rosewell I, et al. The p24
family member p23 is required for early embryonic development. Curr Biol. 2000;10:55–8.
41. Grati M, Schneider ME, Lipkow K, Strehler EE, Wenthold RJ, Kachar B. Rapid turnover of stereocilia membrane proteins: evidence from the trafficking and mobility of plasma membrane ca(2+)-ATPase 2. J Neurosci. 2006;26: 6386–95.
42. López-Murcia FJ, Terni B, Llobet A. SPARC triggers a cell-autonomous program of synapse elimination. Proc Natl Acad Sci U S A. 2015;112:13366–71. 43. Albrecht D, López-Murcia FJ, Pérez-González AP, Lichtner G, Solsona C,
Llobet A. SPARC prevents maturation of cholinergic presynaptic terminals. Mol Cell Neurosci. 2012;49:364–74.
44. Carlson SS, Valdez G, Sanes JR. Presynaptic calcium channels andα 3-integrins are complexed with synaptic cleft laminins, cytoskeletal elements and active zone components. J Neurochem. 2010;115:654–66.
45. Davis MJ, Wu X, Nukiewicz TR, Kawasaki J, Gui P, Hill MA, Wilson E. Regulatio of ion channels by integrins. Cell Biochem Biophys. 2002;36:41–66. 46. Hafidi A, Beurg M, Dulon D. Localization and developmental expression of BK
channels in mammalian cochlear hair cells. Neuroscience. 2005;130:475–84. 47. Peradziryi H, Tolwinski NS, Borchers A. The many roles of PTK7: a versatile
regulator of cell-cell communication. Arch Biochem Biophys. 2012;524:71–6. 48. Togashi H. Differential and cooperative cell adhesion regulates cellular
pattern in sensory epithelia. Front Cell Dev Biol. 2016;4:104.
49. Favor J, Bradley A, Conte N, Janik D, Pretsch W, Reitmeir P, et al. Analysis of Pax6 contiguous gene deletions in the mouse, Mus musculus, identifies
regions distinct from Pax6 responsible for extreme small-eye and belly-spotting phenotypes. Genetics. 2009;182:1077–88.
50. Deng S, Hirschberg A, Worzfeld T, Penachioni JY, Korostylev A, Swiercz JM, et al. Plexin-B2, but not Plexin-B1, critically modulates neuronal migration and patterning of the developing nervous system in vivo. J Neurosci. 2007; 27:6333–47.
51. Auderset L, Landowski LM, Foa L, Young KM. Low density lipoprotein receptor related proteins as regulators of neural stem and progenitor cell function. Stem Cells Int. 2016;2016:2108495.
52. Ekblom P, Lonai P, Talts JF. Expression and biological role of laminin-1. Matrix Biol. 2003;22:35–47.
53. Tsuprun V, Santi P. Proteoglycan arrays in the cochlear basement membrane. Hear Res. 2001;15:65–76.
54. Chen JK, Shapiro HS, Wrana JL, Reimers S, Heersche JN, Sodek J. Localization of bone sialoprotein (BSP) expression to sites of mineralized tissue formation in fetal rat tissues by in situ hybridization. Matrix. 1991;11:133–43. 55. Raphael Y, Altschuler RA. Structure and innervation of the cochlea. Brain Res
Bull. 2003;60:397–422.
56. Wu L, Sagong B, Choi JY, Kim UK, Bok J. A systematic survey of carbonic anhydrase mRNA expression during mammalian inner ear development. Dev Dyn. 2013;242:269–80.
57. Mueckler M, Thorens B. The SLC2 (GLUT) family of membrane transporters. Mol Asp Med. 2013;34:121–38.
58. Glowatzki E, Grant L, Fuchs P. Hair cell afferent synapses. Curr Opin Neurobiol. 2008;18:389–95.
59. Chen Z, Kujawa SG, Sewell WF. Functional roles of high-affinity glutamate transporters in cochlear afferent synaptic transmission in the mouse. J Neurophysiol. 2010;103:2581–6.
60. Danbolt NC. Glutamate uptake. Prog Neurobiol. 2001;65:1–105. 61. Foote M, Zhou Y. 14-3-3 proteins in neurological disorders. Int J Biochem
Mol Biol. 2012;3:152–64.
62. Obsilova V, Silhan J, Boura E, Teisinger J, Obsil T. 14-3-3 proteins: a family of versatile molecular regulators. Physiol Res. 2008;57:S11–21.
63. Lalwani AK, Goldstein JA, Kelley MJ, Luxford W, Castelein CM, Mhatre AN. Human nonsyndromic hereditary deafness DFNA17 is due to a mutation in nonmuscle myosin MYH9. Am J Hum Genet. 2000;67:1121–8.
64. Friedman TB, Sellers JR, Avraham KB. Un conventional mysins and the genetics of hearing loss. Am J Med Genet. 1999;89:147–57. 65. Parker LL, Gao J, Zuo J. Absence of hearing loss in a mouse model for
DFNA17 and MYH9-related disease: the use of public gene-targeted ES cell resources. Brain Res. 2006;1091:235–42.
66. Oonk AM, Leijendeckers JM, Lammers EM, Weegerin NJ, Oostrik J, Beynon AJ, et al. Progressive hereditary hearing impairment caused by a MYO6 mutation resembles presbyacusis. Hear Res. 2013;299:88–98.
67. Bifulco M, Laezza C, Stingo S. Wolff 2′,3'-cyclic nucleotide 3′-phosphodiesterase: a membrane-bound, microtubule-associated protein and membrane anchor for tubulin. Proc Natl Acad Sci U S A. 2002;99:1807–12.
68. Wangemann P. Supporting sensory transduction: cochlear fluid homeostasis and the endocochlear potential. J Physiol. 2006;576:11–21.

![4 Chloro N [N (6 methyl 2 pyridyl)carbamothioyl]benzamide](data:image/gif;base64,R0lGODlhAQABAIAAAP///wAAACH5BAEAAAAALAAAAAABAAEAAAICRAEAOw==)