M E T H O D O L O G Y
Open Access
Computational identification of adaptive mutants
using the VERT system
James Winkler and Katy C Kao
*Background:Evolutionary dynamics of microbial organisms can now be visualized using the Visualizing Evolution in Real Time (VERT) system, in which several isogenic strains expressing different fluorescent proteins compete during adaptive evolution and are tracked using fluorescent cell sorting to construct a population history over time. Mutations conferring enhanced growth rates can be detected by observing changes in the fluorescent population proportions.
Results:Using data obtained from several VERT experiments, we construct a hidden Markov-derived model to detect these adaptive events in VERT experiments without external intervention beyond initial training. Analysis of annotated data revealed that the model achieves consensus with human annotation for 85-93% of the data points when detecting adaptive events. A method to determine the optimal time point to isolate adaptive mutants is also introduced.
Conclusions:The developed model offers a new way to monitor adaptive evolution experiments without the need for external intervention, thereby simplifying adaptive evolution efforts relying on population tracking. Future efforts to construct a fully automated system to isolate adaptive mutants may find the algorithm a useful tool.
Keywords:Adaptive evolution, hidden Markov Model, Visualizing evolution in real time, Population history
Background
Strain development to improve the utility of microbial strains has been a focus of industry for decades. Numer-ous methods to improve strain characteristics have been developed such as random mutagenesis [1,2], genetic recombination [1,3-5], serial transfers in the presence of various inhibitors [6], and others [7-12]. A novel method to identify the occurrence and expansion of adaptive mutants within an evolving population was recently described by Kao and Sherlock [13], where the popula-tion dynamics of strains expressing different fluorescent proteins competing for the limiting carbon source in a chemostat system were monitored using fluorescent activated cell sorting (FACS). This approach (VERT, Visualizing Evolution in Real Time) has been used suc-cessfully to elucidate the population dynamics of Can-dida albicans in the presence of an antifungal agent [14] and generateEscherichia colimutants tolerant of
n-butanol (Reyes and Kao, manuscript in revision). The use of fluorescent labels improves the ability of the user to track various subpopulations in a quasi-real time fashion compared to microarrays [15] or quantitative PCR [16], and therefore makes the VERT method ideal for identifying adaptive events more quickly than other strain development techniques.
A key aspect of the VERT system and other types of population tracking methods involves analysis of observed population dynamics to accurately detect adap-tive events, which are subpopulation expansions trig-gered by novel adaptive mutants with growth-enhancing mutations. For example, if a growth enhancing mutation (such as one that confers drug resistance or more effi-cient nutrient uptake) arises in a labeled subpopulation, that specific subpopulation will experience an adaptive event due to an increase in population size. An algorith-mic way of analyzing population history data is prefer-able to human inference, as the former will be more consistent and reliable in most circumstances. A simple yet robust method that can identify adaptive episodes automatically is the hidden Markov model (HMM)
* Correspondence: [email protected]
Department of Chemical Engineering, Texas A&M University, College Station, TX, USA
[17,18], which involves the computation of the unknown state sequence that is most likely to produce the observed output (emissions) from the process in ques-tion. This technique can be applied to determine whether each subpopulation is undergoing an adaptive expansion by examining the visible population propor-tions, and then computing the probability of an adaptive event based on the model training data. A HMM based approach will also be sufficiently flexible to accommo-date variations between experiments arising from spe-cies-specific dynamics, data quality issues, and other factors.
In this work, we introduce a population state model (PSM) that employs a hidden Markov model to identify likely adaptive events for several types of chemostat evo-lution experiments that employed the VERT tracking system. After showing that the PSM predictions are comparable to those obtained from human annotation, properties of several VERT experiments for different species are quantified. Several utilities have also been developed that allow the PSM to quickly analyze raw data and generate predictions concerning experimental evolutionary dynamics. Finally, the ability of the PSM to process other types of evolutionary experiments is discussed.
Results and discussion
The first step in developing a model to analyze VERT population history is the examination of the population data to develop a method that can determine if the observed population proportion for populationjat time pointirepresents a statistically significant change com-pared to point i-1. A simple statistical classifier based on data obtained from neutrality (e.g. no adaptive events) experiments is developed to answer this ques-tion. This classifier is then utilized to determine emis-sion sequences that represent the statistical significance of population proportion changes for the entire set of VERT data. A hidden Markov-based model, trained with human annotated data, is then applied to determine whether or not a subpopulation is undergoing an adap-tive event based on these emissions. Finally, the error rate, behavior, and possible alternative applications of the model are considered.
Statistical classification of population dynamics data We seek to analyze the population dynamics that arise during a chemostat evolution experiment. In this type of system, a continuous, constant volume, bioreactor is inoculated with several isogenic microbial populations, each marked with a different fluorescent protein (or equivalent unique label), and evolved for hundreds of generations in the presence of the desired selective pres-sure. Adaptive mutants from each labeled subpopulation
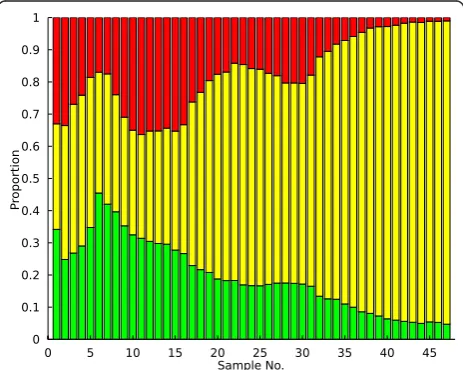
that arise during the course of the evolution experiment trigger an observable increase in the size of the labeled subpopulation, as shown in Figure 1. FACS devices are typically used to track the proportion of each fluores-cent strain in the evolving population over time in a ser-ies a discrete measurements (typically 1 measurement/ day); obtaining continuous data is usually not possible due to experimental and technical limitations. In this case we utilize population dynamics data obtained from evolving yeast andEscherichia coli that express several fluorescent proteins.
The population state model utilizes the rate of popula-tion expansion for the jthsubpopulation at time pointi (rpe,ij) as the measured variable to detect adaptive events
from FACS data. Population expansion rate is more practical to work with compared to population propor-tions over time as adaptive events will change the rela-tive proportions of the subpopulations over time. This property may be calculated directly from FACS data for each time point as follows. First, the proportion of each colored subpopulationjofJtotal subpopulations at time i(Pji) is computed from each subpopulation:
Pji=
xji
xj,0
j∈J
xi (1)
where the summation
j∈J
xi represents the total FACS
reading (counts) at the ith time point for normalization. This proportion is also divided by xj,0 to set Pj,0 = 1.0
for all subpopulations, no matter their initial proportion in the inoculum. Since the elapsed time between sam-ples is not necessarily constant over the course of an experiment, let tirepresent the number of generations
that have occurred by theithsample. Then,∀ti>t1, rpe,
ij:
rpe,ij=
Pji−Pj,i−1
ti−ti−1
(2)
The actual time derivative R˙j(t) can used in place of Rijif continuous measurements are available, as the
for-mer contains much more information concerning the process dynamics and will allow more accurate detec-tion of adaptive events.
Estimates for the mean rpe,ij(subsequently μr),
repre-senting a collection of slope measurements for one sub-population, and its standard deviation (sr) of the same
collection for metastable populations are needed to draw inferences about which fluctuations in population proportions are significant. Calibration data in the form of neutrality experiments, where adaptive events are unlikely to occur, can be leveraged to obtain these data. In an ideal case, with a perfectly accurate FACS device and populations with exactly equal fitness, μr =sr= 0
over the entire dataset; the population proportions would be fixed. In reality, fluctuations affecting both parameters tend to arise due to jackpot mutations, ran-dom stochasticity in the populations, or technical issues that generate noise in the data. The neutrality datasets are therefore used to calculate the slope mean and var-iance. The obtained values for these parameters indi-cated thatμrÎ [ - 0.005, 0.004] and sr = 0.018 for 64
neutral measurements. The parameterμr also serves as
an indicator of population stability and is, as expected, indistinguishable from zero at a 95% confidence level.
Generally, μr will be approximately zero for
fluoro-phores that have no fitness effect on their host strains. Some fluorescent proteins, such astdTomato, have been observed to decrease strain fitness (data not shown), resulting in negative values ofμr. The parameter values
used here may therefore be unique to specific experi-mental equipment and fluorophores and should be recomputed for each physically distinct setup.
These properties can be applied to construct a statisti-cal test that will identify when populations begin to expand or contract more rapidly than is expected under the neutral regime. In formal terms, we compare the observed slopes with a random variable Rpe,ij drawn
from the t-distribution with estimated mean μr and
standard deviation sr. At-test can be used to ascertain
whether there is a significant difference between the observed slope and the mean neutral measurement (alternative hypothesis, Equation 4) or if a population is stable (null hypothesis, Equation 3). A Gaussian distri-bution may also be used in place of the t-distridistri-bution if desired; however, if the number of samples is small (less than 30), the t-distribution is more appropriate. The
statistic T= rpe,ij−μr
σr/√n is used to determine if the difference
between the observed and expected slopes is statistically significant.
Ho:rpe,ij−μr= 0 (3)
Ha:rpe,ij−μr= 0 (4)
Each subpopulation of a VERT experiment is analyzed to determine when to reject the null hypothesis in order to classify the data. For slopes that are unlikely to be explained by the null hypothesis (P<a), the sign of the slope is examined to determine if that point will be identified as a population size increase (positive slope, P) or a contraction (negative slope, N). Slopes that fail to meet the significance threshold, in either direction, are recorded as zero (Z) slopes. The p-value threshold
for significance was a = 0.10, selected by empirical
observation and based on model performance, was used unless otherwise stated. These slope classifications are subsequently used in the population state model described below.
Definition of the population state model
The basic outline of the population state model (here-after PSM) exploits the statistical classifier to detect when one subpopulation of labeled cells is undergoing consistent expansion so that the initiation and termina-tion of the expansion can be identified accurately. The mutant is assumed to reach its largest frequency at the latter time point, allowing the experimentalist to more easily isolate the desired mutant from the rest of the population. The model itself utilizes two hidden states:
“N”which indicates that a colored subpopulation is not undergoing a population expansion, and“A”to indicate that the subpopulation is experiencing an adaptive event. Annotated training data from 8 multicolored yeast chemostats were used to calculate state transition probabilities within and between the states (PAA, PNN, PAN,PNA), and the emission probabilities of each symbol
(Z, N, and P) in the respective states (eA(S) and eN(S),
whereS Î {Z, N,P} as defined by the statistical classi-fier). This process was performed automatically by the model, allowing for the facile incorporation of additional data into the training dataset to improve model accu-racy. Training data were used for no other purpose and are not included in any subsequent analyses. Numeric values for each of these parameters are calculated only from the training data and are shown in Table 1. State transition probabilities are adjusted to account for con-tiguous positive slopes (CP) or negative and zero slopes
(C!P) through the use of an exponentially decay penalty
PAN=P◦AN(exp(−CP)) (5)
PNA=P◦NA(exp(−C!P)) (6)
wherePAN°andPNA°represents that nominal value of
each state transition probability. Accordingly,PNN= 1 -PNAandPAA= 1 -PANas well. These contiguous counts
are reset to zero when symbols outside the considered set (i.e.Z,NforCP) are encountered in the data. This
modifi-cation does represent a divergence from the traditional formulation of a hidden Markov model, where the state at
position i only depends on position i-1. We use this
approach to represent the fact that adaptive events, once they occur and survive initial drift, expand in a non-ran-dom fashion temporarily. The exponential decay function represents the decreasing probability of transitioning out of an ongoing change in population proportion (i.e. a long adaptive expansion or continual decline); many possible forms for this function exist, but the exponential functions seems to correlate well with the observed population dynamics. This formulation allows for the explicit consid-eration of the current population state in the chemostat and dramatically improves the accuracy of the model.
A total of 19 long-term chemostat experiments forE. coli(Reyes and Kao, manuscript in revision),S. cerevisae [13], andC. albicans[14] were analyzed using the PSM.
For a given chemostat experiment k, the emission
sequence Okj is generated for each of thejcolored
sub-populations using the statistical classifier at significance levela= 0.10 (single-tailed). The most likely set of hid-den states for thejthsubpopulation in thekth chemostat (Xkj) can then be decoded using the Viterbi algorithm
[18] in an iterative fashion:
Xkj={argmax(Pll·el(Ok,i),Plm·em(Ok,i))∀i} (7)
wherel denotes the previous hidden state andmthe
alternative state (e.g. A ® A or N). This process is
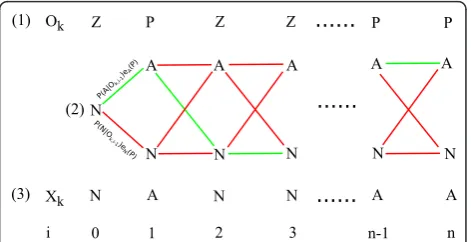
shown graphically in Figure 2. Given that all populations are not expanding immediately after chemostat inocula-tion, it assumed that all populations are in state N ati= 0. In addition, the final adaptive state predictions are translated back one time point (i.e.i ® i-1) based on
empirical observation that doing so improved model accuracy. Model validation was accomplished by com-paring the predicted hidden state sequences to human annotation of the 19 chemostats and then computing the number of true positives (Amod = Aann), true
nega-tives (Nmod= Nann), false positives (Amod= Nann), and
false negatives (Nmod = Aann) within the computational
predictions. Despite the use of true and false designa-tions, the human annotations may not always be accu-rate representations of the true state of each chemostat population. These error rates can be more accurately interpreted as representing the difference between PSM and human annotations.
The use of a supervised learning approach, though allowing for relatively straightforward development and training of the PSM, does introduce bias into what is considered an adaptive event which in turn affects the model parameters computed from the annotated train-ing set. An alternative approach to HMM traintrain-ing involves the use of unsupervised learning, where the estimated state transition and emission probabilities are computed automatically using algorithms such as Baum-Welch [19]. In essence, this type of HMM training com-putes the expected number of state transitions and the emission probabilities (in each state) that best fit the provided emission symbols, and then updates the model parameters accordingly. This iterative process continues until the change in HMM performance is below the user threshold. This type of training will be explored in future versions of the population state model.
Properties of the population state model
Using the procedure outlined previously, the PSM is
trained using an annotated dataset from S. cerevisae
Table 1 Population state model parameters
Parameter Value
State Transition PAN°= 0.154,PNA°= 0.079 Adaptive Emission PN= 0.102,PZ= 0.150,PP= 0.748 Non-adaptive Emission PN= 0.434,PZ= 0.337,PP= 0.229
An overview of the Markov parameters used by the population state model. The emission probabilities in the non-adaptive state reflect the symmetry of the slope distribution in the control data and the adaptive emissions are heavily biased towards positive slopes as expected. In addition, the state transition probabilities indicate that entry into and exit from adaptive events is relatively uncommon in the training data.
glucose limited chemostats [13]. Depending on the spe-cies, length of the evolution experiments, and conditions (mutagenic versus non-mutagenic), it is possible that different estimates of the Markov parameters given in Table 1 may be obtained depending on the dataset used for model training; however, the calculated probabilities seem reasonable in light of the experimental population dynamics. Non-adaptive events typically have slopes that are close to zero (P > 0.10) with the remaining events split evenly between positive and negative slopes (P < 0.10). Adaptive events are predominately weighted towards producing measurements with positive slopes as is trivially expected. The behavior of the PSM is overall most affected by the state transition propertiesPAN°and PNA°as these parameters control how quickly the model
responds to changes in chemostat dynamics.
In order to quantify the error rate of the model more precisely, the PSM was used to generate hidden state predictions for a collection of chemostat evolution experiments forE. coli,S. cerevisae, andCandida
albi-canswhich were then compared to human annotations.
As can be seen in the error rates reported in Table 2, the model achieves a prediction accuracy rate of 85% to 93% for the examined data. Discrepancies between the model and the annotated states typically arise from the inability of the statistical classifier to call positive slopes that do not meet the statistical threshold for signifi-cance; slow adaptive events (subpopulation growth rate < 0.0025 gen1 ata= 0.10) may therefore be missed by the model. While these events are relatively rare and therefore do not impact the accuracy of the PSM sub-stantially, slow adaptive events may harbor new lineages or additional mutations that can shed light on the con-dition being evaluated. However, even in light of this deficiency, the chemostat properties in Table 3 calcu-lated using the PSM are not significantly different from those obtained from human annotation. In addition to these continuous culture systems, the PSM was also able to accurately annotate VERT data obtained during a batch serial transfer experiment (data not shown).
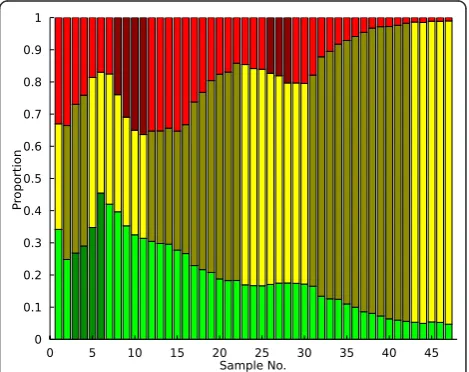
Example application: analysis of a yeast chemostat An example of the PSM predictions is shown for a yeast chemostat (Large1-KK-2007) in Figure 1. In this system, three fluorescent strains are competing for access to limited glucose; adaptive events occur as individual acquire mutations that affect the rate of glucose trans-port into the cell. Upon visual inspection of the raw population data in Figure 1, an experienced VERT user would likely conclude that adaptive events (expansions) occur several times in each subpopulation and that the mutations conferring the greatest fitness advantage occur in the yellow population. Analyzing these popula-tion dynamics using the PSM produces the adaptive event predictions shown in Figure 3 as shaded regions within each subpopulation. While the model is very suc-cessful at identifying the adaptive expansion regions that would likely be identified during a qualitative analysis in
Table 2 Population state model error analysis
System Description TPA= A
TNN= N
FPA= N
FNN= A
C. albicans Fluconazole challenge
0.213 0.598 0.108 0.082
E. coli Butanol challenge 0.167 0.683 0.043 0.108
S. cerevisae
Glucose limitation 0.216 0.720 0.044 0.020
Error rates are calculated by comparing the set of hidden states generated by the PSM to human annotation and then applying the translation method discussed in the model description. Model parameters were calculated witha
= 0.10 for the statistical classifier. The preponderance of slow adaptive events in theE. colichemostats accounts for the increased proportion of false negatives generated by the model. Overall, the PSM predictions agree quite well with the annotated data.
Table 3 Analysis of population dynamics
System AE/gen-color Rate of PEX† AE Length (s) Human Annotation
C. albicans 0.015 (0.007) 0.0058 (0.016) 3.26 (2.12)
E. coli 0.017 (0.005) 0.0065 (0.009) 1.80 (0.96)
S. cerevisae 0.008 (0.005) 0.005 (0.005) 4.124 (3.47) Model predictions
C. albicans 0.016 (0.009) 0.010 (0.015) 3.83 (2.79)
E. coli 0.013 (0.010) 0.005 (0.004) 2.46 (1.62)
S. cerevisae 0.009 (0.005) 0.005 (0.005) 4.33 (3.43)
Properties of adaptive events (AE) are calculated from the human annotated data and the predictions of the PSM to highlight differences between the annotation methods. The average value and (standard deviation) are provided for each parameter of interest. There are not statistically significant differences between each type of chemostat (i.e.E. coliversus yeast) at thea= 0.05 level.
†PEX:populationexpansion, defined asΔPij/Δt(t: generations).
this case, it should be noted that excessive noise in the raw FACS data arising from experimental error or con-stantly varying selective pressure may render adaptive event identification more error prone. However, this tendency should not be a problem in most situations.
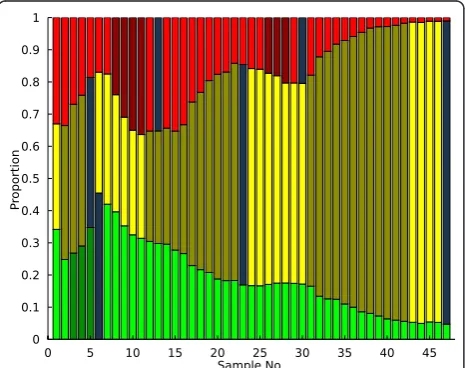
Now that adaptive events have been identified, adap-tive mutants must be isolated from the chemostat popu-lation. Preserved population samples stored at -80°C may be regrown in the selective media, plated, and ana-lyzed to determine which clonal isolate contains the adaptive mutation. Since any sample can potentially contain the mutant of interest, an additional tool based on the emission sequence generated by the statistical classifier and the hidden state data from the PSM was developed to guide sampling efforts so that the sample with the highest proportion of the adaptive mutant is identified. Firstly, the endpoints of each contiguous ser-ies of adaptive events ("A” states) are identified using the PSM output. Then, for each distinct adaptive event the emission sequence for that subpopulation is exam-ined until a“N”symbol (statistically significant negative slope) is found at point i. The sampling suggestion is then set toi-1as that time point likely contains the lar-gest proportion of the mutant. Applying this procedure to this chemostat yields the sampling predictions high-lighted in dark blue in Figure 4. The identified sampling points are either immediately adjacent to each adaptive expansion (if followed shortly by another expansion in a different subpopulation) or in the case of the final, high fitness yellow mutant, some distance away from the cal-culated adaptive event endpoint. The latter estimate arises from the fact that the yellow subpopulation essen-tially overran the chemostat environment, so that the
optimum sampling point coincided with the final popu-lation measurement. Quantitative PCR measurement of allele frequency in each population supports this sam-pling scheme [13]. Altogether, these samsam-pling sugges-tions provide a useful and accurate tool for the experimentalist to optimize their VERT experiment and minimize unnecessary mutant isolation.
Distribution of adaptive events
In addition to the adaptive events themselves, how these events are distributed between the various evolving sub-populations is also of interest to detect differences in the initial seed populations or fitness effects of the fluor-escent labels. If one label has a significant detrimental impact upon strain fitness, it is unlikely many detectable adaptive events will occur in that particular subpopula-tion. The PSM was utilized to calculate the number of adaptive events, weighted by length, per subpopulation for the entire set of available data (Figure 5). A consis-tent bias towards adaptive events in a particular subpo-pulation for chemostats seeded from the same initial inoculum may indicate the presence of a beneficial mutant that arose prior to exposure to the selective pressure in question (a jackpot). A statistical method for identifying this type of biased population dynamics will be developed to investigate this phenomenon in a rigor-ous manner.
Figure 4 Sampling Example. Following the identification of adaptive events, estimates of optimal sampling points as described in the text are then computed to further assist in mutant isolation.
!
!
!
!
"
Application to other evolution systems
Despite the usage of the VERT system and data in devel-oping the PSM, there is no explicit dependence of the PSM on VERT data. Any method that can generate similar population histories over time (e.g. microarray or qPCR methods) can also be integrated into the PSM. The only requirement is that comparable neutrality experiments and annotated experimental data must be generated using the proposed alternative so that the PSM can estimate the required HMM parameters. The current implementation of the PSM will automatically calculate all of the necessary parameters except forμrandsrfor the new type of
mea-surements, both of which must be determined by the end-user as described previously. After this calibration proce-dure, the PSMshould be able to analyze population his-tories obtained from alternative methods.
Another potential application of the PSM is the con-struction of a mostly automated system (e.g.autoVERT) for the observation and isolation of adaptive mutants. Unlike serial transfer (batch) evolution system that require periodic transfers of culture to fresh medium, the continu-ous culture system used to generate the VERT population histories can be adapted to minimize required external intervention to adjust the nominal media composition. The second part of an automated system is identifying when adaptive events occur so that samples of the popula-tion can be saved (on solid media or as frozen stocks) for later manual analysis. Given that the PSM has been shown to be effective in accomplishing this task, it may be possi-ble to adapt this model to construct such a system. Addi-tional work is needed to optimize the PSM for this type of data forecasting as the model was primarily constructed for retrospective analysis of VERT experiments.
Conclusions
The population state model offers the ability to automa-tically detect adaptive events within fluorescent micro-bial populations easily and without the need for user intervention. A variety of VERT experimental properties may also be determined, enabling a quantitative compar-ison between the evolutionary dynamics of different VERT experiments involving various inhibitors or spe-cies of interest. Comparison to human analysis of VERT experiments revealed that the PSM produced highly accurate predictions for adaptive events and sampling time points. This algorithm represents an important new tool for the analysis of population dynamics over time and will be integral in any VERT system capable of automatic identification of adaptive mutants.
Methods
Experimental procedures
The specific experimental procedures for the VERT experiments used in this study are detailed elsewhere
[13,14]. The first requirement is that strains with chro-mosomally integrated fluorescent proteins (e.g. RFP, GFP, YFP) be constructed. The labeled strains must then be assayed to ensure fluorescent protein expression has a neutral effect on strain growth rates. Once label neutrality has been established, equal proportions of each strain are inoculated into a continuous culture sys-tem (chemostats) or batch flasks and sampled daily using a FACS machine to determine the size of each labeled subpopulation. The complete series of FACS measurements for a VERT experiment (see Figure 1) can be interpreted as a quantitative measurement of population dynamics. These data form the basis of the population state model developed in this work.
Computational procedures
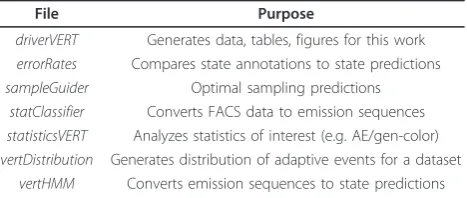
All software was implemented in MATLAB R2010a without additional toolboxes on Mac OS × 10.6. Data for model training were annotated and stored as comma separated value files (see Additional File 1). Experimen-tal data was also stored in a similar format without annotations. The purpose of each program used in this work is described in Table 4.
Additional material
Additional file 1: Population State Model (JBE V1).zip. The collection of MATLAB and data files necessary to use the PSM and generate the figures, data presented in this work.
Acknowledgements
We gratefully acknowledge the partial financial support of the NSF Graduate Research Fellowship program, NSF MCB-1054276, and the Texas Engineering Experimental Station. The authors would like to thank Dr. Cornelis J. Potgieter for his suggestions and comments.
Authors’contributions
JW proposed the concept, annotated the data, constructed the model, analyzed the experiments, and wrote the paper; KCK generated theCandida
chemostat data, oversaw the project, and wrote the paper. Both authors read and approved the final manuscript.
Competing interests
The authors declare that they have no competing interests.
Received: 7 October 2011 Accepted: 2 April 2012 Published: 2 April 2012 Table 4 Description of PSM submodules
File Purpose
driverVERT Generates data, tables, figures for this work
errorRates Compares state annotations to state predictions
sampleGuider Optimal sampling predictions
statClassifier Converts FACS data to emission sequences
statisticsVERT Analyzes statistics of interest (e.g. AE/gen-color)
vertDistribution Generates distribution of adaptive events for a dataset
References
1. Adrio J, Demain A:Genetic improvement of processes yielding microbial products.FEMS Microbiol Rev2006,30(2):187-214.
2. Klein-Marcuschamer D, Stephanopoulos G:Method for designing and optimizing random-search libraries for strain improvement.Appl Environ Microbiol2010,76(16):5541.
3. Patnaik R, Louie S, Gavrilovic V, Perry K, Stemmer W, Ryan C, del Cardayré S:
Genome shuffling of Lactobacillus for improved acid tolerance.Nat Biotechnol2002,20(7):707-712.
4. Chen X, Wei P, Fan L, Yang D, Zhu X, Shen W, Xu Z, Cen P:Generation of high-yield rapamycin-producing strains through protoplasts-related techniques.Appl Microbiol Biotechnol2009,83(3):507-512.
5. Bajwa P, Pinel D, Martin V, Trevors J, Lee H:Strain improvement of the pentose-fermenting yeast Pichia stipitis by genome shuffling.J Microbiol Methods2010,81(2):179-186.
6. Atsumi S, Hanai T, Liao J:Non-fermentative pathways for synthesis of branched-chain higher alcohols as biofuels.Nature2008,451(7174):86-89. 7. Stephanopoulos G, Alper H, Moxley J:Exploiting biological complexity for
strain improvement through systems biology.Nat Biotechnol2004,
22(10):1261-1267.
8. Lee S, Lee D, Kim T:Systems biotechnology for strain improvement.
Trends Biotechnol2005,23(7):349-358.
9. Alper H, Stephanopoulos G:Global transcription machinery engineering: a new approach for improving cellular phenotype.Metab Eng2007,
9(3):258-267.
10. Klein-Marcuschamer D, Santos C, Yu H, Stephanopoulos G:Mutagenesis of the bacterial RNA polymerase alpha subunit for improvement of complex phenotypes.Appl Environ Microbiol2009,75(9):2705. 11. Warner J, Patnaik R, Gill R:Genomics enabled approaches in strain
engineering.Curr Opin Microbiol2009,12(3):223-230.
12. Chung B, Selvarasu S, Andrea C, Ryu J, Lee H, Ahn J, Lee H, Lee D:
Genome-scale metabolic reconstruction and in silico analysis of methylotrophic yeast Pichia pastoris for strain improvement.Microb Cell Fact2010,9:50-50.
13. Kao K, Sherlock G:Molecular characterization of clonal interference during adaptive evolution in asexual populations of Saccharomyces cerevisiae.Nat Genet2008,40(12):1499-1504.
14. Huang M, McClellan M, Berman J, Kao K:Evolutionary dynamics of Candida albicans during in vitro evolution.Eukaryotic Cell2011,
10(11):1413-1421.
15. Brodie E, DeSantis T, Joyner D, Baek S, Larsen J, Andersen G, Hazen T, Richardson P, Herman D, Tokunaga T,et al:Application of a high-density oligonucleotide microarray approach to study bacterial population dynamics during uranium reduction and reoxidation.Appl Environ Microbiol2006,72(9):6288.
16. Watanabe K, Yamamoto S, Hino S, Harayama S:Population dynamics of phenol-degrading bacteria in activated sludge determined by gyrB-targeted quantitative PCR.Appl Environ Microbiol1998,64(4):1203. 17. Rabiner L, Juang B:An introduction to hidden Markov models.ASSP
Magazine, IEEE1986,3:4-16.
18. Rabiner L:A tutorial on hidden Markov models and selected applications in speech recognition.Proc IEEE1989,77(2):257-286.
19. Bilmes J:A gentle tutorial of the EM algorithm and its application to parameter estimation for Gaussian mixture and hidden Markov models.
Int Comput Sci Inst1998,4:126.
doi:10.1186/1754-1611-6-3
Cite this article as:Winkler and Kao:Computational identification of adaptive mutants using the VERT system.Journal of Biological Engineering
20126:3. Submit your next manuscript to BioMed Central
and take full advantage of:
• Convenient online submission • Thorough peer review
• No space constraints or color figure charges • Immediate publication on acceptance
• Inclusion in PubMed, CAS, Scopus and Google Scholar • Research which is freely available for redistribution