R E S E A R C H A R T I C L E
Open Access
Cohort Multiple Randomised Controlled
Trials (cmRCT) design: efficient but biased?
A simulation study to evaluate the
feasibility of the Cluster cmRCT design
Alexander Pate
1*, Jane Candlish
1, Matthew Sperrin
1, Tjeerd Pieter Van Staa
1,2and on behalf of GetReal Work Package 2
Abstract
Background:The Cohort Multiple Randomised Controlled Trial (cmRCT) is a newly proposed pragmatic trial design;
recently several cmRCT have been initiated. This study tests the unresolved question of whether differential refusal in the intervention arm leads to bias or loss of statistical power and how to deal with this.
Methods:We conduct simulations evaluating a hypothetical cluster cmRCT in patients at risk of cardiovascular disease (CVD). To deal with refusal, we compare the analysis methods intention to treat (ITT), per protocol (PP) and two instrumental variable (IV) methods: two stage predictor substitution (2SPS) and two stage residual inclusion (2SRI) with respect to their bias and power. We vary the correlation between treatment refusal probability and the probability of experiencing the outcome to create different scenarios.
Results:We found ITT to be biased in all scenarios, PP the most biased when correlation is strong and 2SRI the least biased on average. Trials suffer a drop in power unless the refusal rate is factored into the power calculation. Conclusions:The ITT effect in routine practice is likely to lie somewhere between the ITT and IV estimates from the trial which differ significantly depending on refusal rates. More research is needed on how refusal rates of experimental interventions correlate with refusal rates in routine practice to help answer the question of which analysis more relevant. We also recommend updating the required sample size during the trial as more information about the refusal rate is gained.
Keywords:Trials within Cohorts, Cohort multiple randomised controlled trial, Cluster, Pragmatic, Instrumental variable
Abbreviations:2SPS, Two stage predictor substitution; 2SRI, Two stage residual inclusion; CACE, Complier average causal effect; cmRCT, Cohort multiple randomised controlled trial; CVD, Cardiovascular disease; HSCIC, Health and social care information centre; ITT, Intention to treat; IV, Instrumental variable; NICE, National institute for health and care excellence; PP, Per protocol; RCT, Randomised controlled trial
* Correspondence:[email protected]
1Health eResearch Centre, Farr Institute for Health Informatics Research, University of Manchester, 1.003 Vaughan House, Manchester M13 9PL UK Full list of author information is available at the end of the article
Background
Randomised controlled trials (RCTs) often fail to meet recruitment targets and are costly [1]. This problem can be even more prevalent in comparative effectiveness re-search where more patients are needed to detect smaller differences between treatments. Furthermore, the results from most randomised controlled trials may not be gen-eralisable to routine practice [2], yet we use the results from these trials to inform clinical decision making [3]. There is a clear need for more pragmatic trials which are cost efficient, integrated with routine clinical care, have less stringent entry criteria and can address the clinical questions that current RCTs cannot [4–7].
The Cohort Multiple Randomised Controlled Trial (cmRCT) design can simplify the recruitment and con-duct of trials compared with current RCTs. It was first proposed in 2010 [8], and is beginning to be used in practice with a total of 5 registered trials from 7 cohorts [9–16]. In this design, a large cohort is identified (e.g., patients at high risk of cardiovascular disease [CVD]) and followed using routinely collected data such as elec-tronic health records [17]. The same cohort can be used for multiple interventions. Each intervention is offered to a randomly selected sample of patients eligible for that intervention, who are then compared with the rest of the eligible patients from the cohort that are still be-ing treated as usual [8]. Randomisation can occur either at a patient or a cluster (site) level. The cluster design can offer dramatically improved accrual [1] and can fur-ther reduce costs through the implementation of the in-terventions in fewer places; cluster designs are the focus of this paper.
The main advantages of cmRCTs are the low cost of recruiting the control group, the possibility to use it for multiple trials and the comparison of interventions to real life practice (the control group are not contacted for further consent). However, refusal to participate in the trial happens post randomisation so excluding these pa-tients may result in selection bias. Alternatively an intention to treat (ITT) analysis could be used; however the refusal rates in a cmRCT may not reflect those in routine practice as the intervention may be viewed as experimental. In this case the ITT effect may lack inter-pretation outside the trial setting. Depending on the re-fusal rate it may be preferable to calculate the effect of accepting the treatment, this will be referred to as the treatment effect for the remainder of this paper. Refusal can cause a loss of statistical power and a bias in the es-timation of the treatment effect, particularly if it is cor-related with the outcome of interest. Instrumental variable analysis (IV) is a method to account for un-measured confounding in epidemiological studies [18, 19] and can for non-compliance in RCTs [20, 21]. It is also applicable to the problem of treatment refusal in a
cmRCT setting. The aim of this paper is (1) to estimate the extent of bias and loss of statistical power with vari-ous refusals scenarios, (2) to test the robustness of IV methods to correct for bias due to refusals and (3) devise strategies to account for loss in power. There is cur-rently very little literature on the topic of cmRCTs, we provide practical recommendations to trial designers and decision makers on the conditions under which cluster cmRCT is a viable design for point of care trials and which statistical analysis methods to use.
Methods
A series of simulations are performed using Base SAS 9.4 Software in which cluster cmRCTs are conducted. In order to provide more realistic simulations they are based on an example of a cohort of patients at high risk of developing cardiovascular disease (CVD) and eligible for lipid lowering drugs according to the relevant criteria in the principal UK guidelines [22]. A novel intervention is tested against treatment as usual with a primary out-come of the time until a CVD event. This is an outout-come that is of direct importance to a patient and may be identified with routinely collected data. Three patient characteristics are simulated: probability of refusing the intervention treatment, the risk of having a CVD event, and the time to death or censoring. Different scenarios are created by changing the average refusal probability of the population and changing the correlation between individuals’risk of having an event and their probability of refusing treatment. The probability of a clinician refus-ing to offer the treatment to each patient is also simulated, and correlated to varying extents with patient risk. Once the patient characteristics have been generated, trial data is simulated through the same process of a cmRCT: treat-ment randomisation, refusal of treattreat-ment, application of intervention to those who accept and then the generation of times until an event. Weibull distributions are used to generate survival times. Each of the analysis methods ex-plained in Analysis Methods are then applied to the simu-lated trial data to estimate the intervention effect. The exact simulation process is detailed in Simulation procedure.
Analysis methods
modelling techniques and start by fitting a first stage model with treatment allocation as the explanatory vari-able and treatment received as the dependent varivari-able (here treatment allocation acts as the IV). This model is then used to calculate the predicted values for treatment received and the residuals. In 2SPS, a second stage model is fitted to the outcome data using the predicted values for treatment received as the explanatory vari-ables. In 2SRI, the second stage model is fitted to the outcome data using both the residuals and the actual treatment received as explanatory variables. The stand-ard errors of parameter estimates in two stage model-ling procedures are too small hence non-parametric bootstrapping [26] should be used to calculate them. IV estimators were the chosen method to estimate the causal effect as IV methods are believed to perform well in RCTs with non-compliance with assumptions more easily argued to hold. [27]. There is a wealth of litera-ture on the theoretical properties of causal effect esti-mates and IVs [18–21, 28] which is not recited in this paper. Instead the performances of the four different analysis methods in a variety of scenarios are evaluated with respect to bias, standard error and statistical power. We define bias as the error in the estimation of the treatment effect as defined in section 1 (effect of accepting treatment).
Simulation procedure
Table 1 contains details of all variables used in the simu-lations. The cluster size chosen is J= 620 to match the average number of eligible patients per UK practice. This is calculated using published figures on GP practice size from the Health and Social Care Information Centre (HSCIC) [29] and statistics on the prevalence of CVD from the National Institute for Health and Care Excel-lence (NICE) [30]. The cluster sizeJ is constant as it has been shown that variable cluster size has no effect on the results in terms of bias [31, 32]. The variances of the individual and cluster level random effects, σε2 and σu2,
and the shape and scale of the Weibull distribution for time to CVD event,λc and γc, are chosen to match the
mean 10-year CVD risk to published figures of 21.1 % (standard deviation 8.6 %) [22]. The mortality (censoring distribution) shape and scale, γm and λm, and the
vari-ancesσε2and σu2give censoring of 5 % of all events and a
correlation of 0.25 between Tikc and Tikmto represent
in-formative censoring.
For each scenario detailed previously, the following procedure was implemented:
For j = 1,2,…,1000:
1) Generate the random effects ikandUkfor each
patient and cluster. i = 1,2,…,I. k = 1,2,…,K.
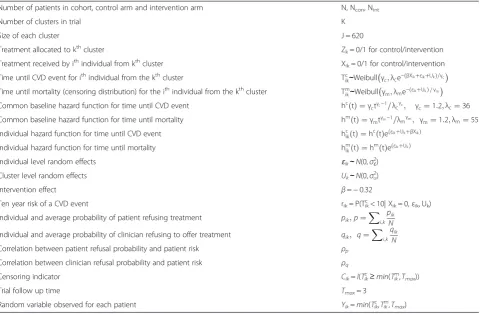
Table 1Description of all variables used in simulation
Number of patients in cohort, control arm and intervention arm N, Ncon, Nint
Number of clusters in trial K
Size of each cluster J = 620
Treatment allocated to kthcluster Z
k= 0/1 for control/intervention
Treatment received by ithindividual from kthcluster X
ik= 0/1 for control/intervention
Time until CVD event for ithindividual from the kthcluster Tc
ik∼Weibullγc;λce−ðβXikþεikþUkÞ=γc
Time until mortality (censoring distribution) for the ithindividual from the kthcluster Tm
ik∼Weibullγm;λme−ðεikþUkÞ=γm
Common baseline hazard function for time until CVD event hcð Þ ¼t γctγc−1=λcγc; γc¼1:2;λc¼36 Common baseline hazard function for time until mortality hmðtÞ ¼γmtγm−1=λmγm; γm¼1:2;λm¼55
Individual hazard function for time until CVD event hc
ikð Þ ¼t hcð ÞteðεikþUkþβXikÞ
Individual hazard function for time until mortality hm
ikð Þ ¼t hmð ÞteðεikþUkÞ
Individual level random effects ɛik∼N(0,σɛ2)
Cluster level random effects Uk∼N(0,σu2)
Intervention effect β=−0.32
Ten year risk of a CVD event rik= P(Tikc< 10| Xik= 0,εik, Uk)
Individual and average probability of patient refusing treatment pik;p¼X
i;k
pik
N Individual and average probability of clinician refusing to offer treatment qik; q¼Xi;kqik
N
Correlation between patient refusal probability and patient risk ρp
Correlation between clinician refusal probability and patient risk ρq
Censoring indicator Cik=I(Tikc≥min(Tikm,Tmax))
Trial follow up time Tmax= 3
2) For each patient, calculate unique 10 year risks (under the counterfactual scenario of receiving standard care) of a CVD event,rik.
3) Assign patient and clinician refusal probabilitiespik
andqik
3a) Order patients by their risk,rik.
3b) Assign refusal probabilities sequentially in a linear fashion between the lower limit (LL) and upper limit (UL) such that such that∑pik/N=p
and∑qik/N=q.
4) Randomise treatment allocationZkto control or intervention on a 4:1 basis.Zk= 0/1 if assigned to
control/intervention.
5) Generate the treatment received whereXik= 0/1 if control/intervention is received. If Zk= 0 then Xik= 0, ifZk= 1 thenXik= min {Bernoulli(1−pik),
Bernoulli(1−qik)}.
6) Apply intervention effectβand random effects to the hazard function, hcikð Þ ¼t hcð Þt eðβXikþεikþUkÞ. 7) Generate survival timesTikc andTikm. These survival
distributions correspond to the respective hazard functions.
8) Generate the censoring indicatorCik, The total observed trial data is then {Yik,Cik,Zik,Xik}, a set of
censored survival data, treatment allocations and treatments received.
9) Fit a Cox proportional hazards model to the data with respect to the four analysis methods ITT, PP, 2SRI and 2SPS, to produce an estimate^βj of the intervention effectβ, which is the log of the hazard ratio, and record thep-value,pj.
When j = 1000, calculate the mean β¼Xjβ^j=1000, the
percentage bias β−β=β and the statistical power
∑jI(pj< 0.05)/1000. Also, calculate a parametrically
bootstrapped standard error of the individual
esti-mates:e: β^ ¼s:d: ^βj , the standard error of the mean
s:e: β ¼s:d: ^βj =1000, and a confidence interval for the
percentage bias CI¼100β− 1:96 s:e: β Þ−βÞ=β; 100βþ1:96s:e: β −β=β.
Different scenarios are created by varying the fol-lowing variables. The intra-cluster coefficient (ICC) takes values 0.025 and 0.05, simulated by (σε2,σu2) = (0.6,
0.2) and (0.57, 0.27) respectively. Average patient and clin-ician refusal probabilitiespandq take values 0.1, 0.2 and 0.3. The correlation between refusal probability and risk,
ρp, takes values zero, low, medium and high, simulated by
having lower limits and upper limits for individual refusal probabilities asðLL;ULÞ∈ ðp;pÞ; 2p3;
4p 3 ; p 3; 5p 3
;ð0;2pÞ
. The correlation between clinician refusal and risk takes the same set of values. The reason for this structure is to give control over the correlation between individual risk
and refusal probabilities. The treatment effect is fixed at
β=−0.32, which equates to on average a 25 % reduction in 10 year risk of CVD. 1000 independent sets of inde-pendent trial data are generated for each scenario.
Sample sizes are calculated at a fixed ratio of 4:1 con-trol to study intervention, the type 1 error is 0.05 and re-quired power is 0.8. Sample sizes are calculated through simulation [33] as sample size formulas for informatively censored clustered survival data are not common. Trials characteristics (effect size, refusal rate, baseline risk) are assumed to be known. Trial data is simulated using the above process and analysed using ITT. For each combin-ation of refusal rates, the smallest N (that is a multiple of J = 620) such that the proportion ofp-values < 0.05 is 80 % is chosen as the required sample size in that sce-nario. There are then two recruitment methods which alter the required sample size. Recruitment method 1 calculates the sample size assuming no refusal. Recruit-ment method 2 factors in the refusal rate in the sample size calculation (assuming refusal to be non-informative and independent of individual risks). All simulation scenar-ios are run using both recruitment methods. The power realised varies from 0.8 as we use the smallest number of clusters that achieve at least a power of 0.8, in recruitment method 2 this changes depending on the refusal rate.
The outcome of interest is the time until a CVD event so cox proportional hazards models are fitted to produce estimates for the intervention effect. To account for the clustering of the data, three types of Cox proportional hazard model are fitted: marginal, lognormal frailty, and gamma frailty models [34, 35]. The lognormal model is correctly specified because the generated ran-dom effects (frailties) are normally distributed (Table 1), whereas the gamma frailty model is miss specified. The output from the robust marginal model has a different interpretation to the frailty models in that the hazard ratio returned is between any two randomly selected patients from the population, as opposed to the hazard ratio of any two people randomly selected from the same cluster [35]. Clustering is not taken into account in the first stage of the IV model as the inclusion of residuals in the second stage model (2SRI) is expected to take account of variation in refusal rates between clusters.
Results
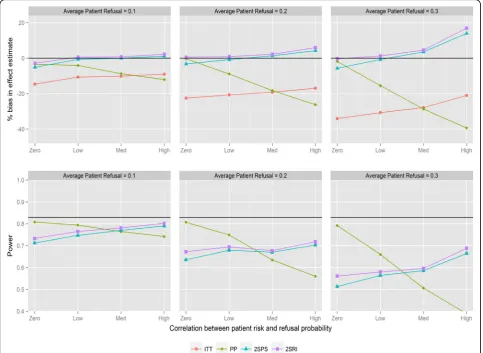
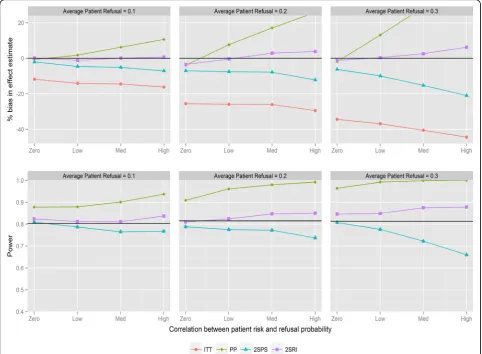
direction of the correlation. PP provides the most biased effect estimates when correlations are large with substantial reductions in statistical power. The two IV analyses provide similar results and substantially less biased effect estimates compared with ITT. The bias with both IV methods is below 6 % in all scenarios except when refusal is high with negative correlation, in which case 2SPS and 2SRI overestimate the effect of the study intervention by 13 and 17 % respectively. All methods have reduced statistical power with increasing refusals. ITT has the same statistical power as the 2SPS method in nearly all scenarios (i.e., the lines in Fig. 1 overlapping). For positive correlation (Fig. 2) 2SRI provides effect estimates with the lowest level of bias compared to the three other analysis methods, although it is associated with a statistical power between 0.8 and 0.56 rather than the 0.83 obtained from the sample size calculation. The trends in bias and power for ITT and 2SPS change direction
with the correlation causing an increase in bias and a drop in power.
Figure 3 shows the results for recruitment method 2 and negative correlation between refusal and individual risk. There is no difference from recruitment method 1 with respect to bias or trends in statistical power; how-ever the overall power of the trial stays consistent as refusal probabilities are changed. The only visible effect of changing refusal probabilities is to strengthen the effect of changing correlation. Importantly, the power of ITT and IV methods tends not to drop below the desired level. With positive correlations and recruit-ment method 2 (Fig. 4) there is a similar pattern when comparing to recruitment method 1. 2SRI provides the least biased estimates with the statistical power ranging between 0.81 and 0.88, depending on refusal. 2SPS and ITT yield more biased estimates with increasing reductions in statistical power as the rate of refusal increased.
Sensitivity analyses are conducted evaluating the effects of miss-specification of the statistical models. Figure 5 and Fig. 6 show the estimates and statistical power with a robust marginal and gamma frailty model fitted to the data respectively (for recruitment method 2 and negative correlations). The miss-specified models perform slightly worse than the correctly specified models in terms of percentage bias while the statistical power is slightly higher. If there was a greater variation between clusters, you would expect a lack of collapsibil-ity to cause a difference between the marginal and frailty estimates [36]. This should be considered along with what output is desired (conditional/marginal) if running a cluster cmRCT. Results for positive correlations also did not vary greatly with model miss-specifications (data not shown).
In Appendix A a look into the accuracy of the bias estimates are provided and results from scenarios including changes in the ICC and when clinician refusal > 0.
Discussion
This study has shown that refusal of a novel intervention in a cluster cmRCT design can lead to bias and reduc-tions in power. The ITT estimates have a high bias, which increases with increasing refusal and is affected by correlations between refusal and the risk of outcome of interest. IV analyses using the 2SRI method substan-tially reduce the bias but yield small overestimates (gen-erally < 6 %) of the treatment effect when refusal rates are high and correlation strong. The 2SPS estimates for IV are highly affected by the correlation structure and produce very biased estimates with positive correlation. Recruitment method 1 causes a loss in statistical power irrelevant of the analysis method used. On the other hand, cluster cmRCT are correctly powered or overpow-ered for recruitment method 2.
for the primary analysis [9, 11, 12] or methods have not been stated yet [10, 13–16]. This follows the recommen-dation to use ITT for the analysis of pragmatic trials [5, 24, 38]. The main argument for this is that treatment re-fusals do happen in actual clinical practice and ITT would thus evaluate the value of offering a treatment. However, as stated earlier, refusal rates may be different in trials (due to e.g. more complex consent and recruit-ment procedures) and the ITT effect will not reflect that in routine practice. In cmRCTs, randomisation precedes the recruitment and consent procedures, and thus may affect results more than traditional trials. The results presented here highlight the large biases associated with ITT when estimating the treatment effect. Our results indicate the importance of evaluating in a cmRCT whether refusal rates are higher than expected in actual clinical practice (is estimating the ITT effect valuable?) and whether this refusal may be related to the outcome as this may increase the bias in estimating the treatment effect. It has been reported that the risk of early
discontinuation may be correlated with the risk of out-come of interest [39].
models and we therefore recommend 2SRI should be used if an IV analysis is carried out. However the effect estimate of interest in a pragmatic trial (the ITT effect in routine practice) is likely to lie somewhere in between the ITT and IV estimates and contextual information is needed to assess this. For example, if refusal rates are particularly high (> 50 %) then the IV estimate is unlikely to represent the effect of this drug in routine practice. This is in line with the findings of van der Velden et al [44], who imply both ITT and IV analyses should be car-ried out to analyse the results of a cmRCT.
Recruitment method 1 causes a drop in statistical power when using ITT or IV methods. This drop in power can be explained by the dilution bias for ITT as the apparent treatment effect is smaller. Although the IV estimate is generally unbiased, it suffers the same drop in power due to larger standard errors resulting from using a two stage modelling technique. If refusal rates are factored into the sample size calculation (recruitment method 2) the statistical power improves as
expected. There is a paucity of literature on the methods for powering a RCT in case of refusals when using IV; most literature deals with ITT [45–47]. Our study high-lights the need to take into account treatment refusal into the power calculation. Methods, such as simula-tions, will need to be developed to adjust IV analyses (with 2SRI) for non-informative as well informative refusals.
not be relevant to certain populations. It is thus import-ant that each cluster cmRCT assesses prior to the start of trial the likely scenarios for refusal, risk of outcomes and cluster sizes and then estimate the potential impact on statistical power and level of bias. This would then guide the feasibility of the cluster cmRCT and the re-quired sample size.
Conclusions
In conclusion, cluster cmRCT can be an efficient design for conducting pragmatic trials, however there are still many questions to answer: What is the impact on bias and power when multiple trials are conducted within a cohort? What would be the influence of effect modifi-cation? What will happen if there is an overlap is sec-ondary endpoints? The question addressed in this paper is how to deal with differential refusal in the intervention arm. If the refusal in a cmRCT is similar to that in routine clinical practice, then an ITT analysis
will provide a valid estimate of the ITT effect in routine practice. If refusal differs from that in routine clinical practice, an IV analysis may provide a more accurate es-timate. More research is needed on how refusal rates of experimental interventions correlate with refusal rates in routine practice to help answer the question of which analysis more relevant. For now, we recommend running both analyses and providing context about the intervention. Refusals can also adversely affect the stat-istical power of a cluster cmRCT and should be incor-porated into the power calculation. An incorrect estimate of the refusal rate can lead to the recruitment of more patients than necessary or an underpowered trial. Therefore we recommend updating the required sample size during the trial as more information about the refusal rate is gained. Finally, it is important to note that the results, recommendations and discussion raised in this paper are very much applicable to the standard cmRCT design.
Appendix A
In scenarios where clinician refusal is bigger than 0 the trends seen in Figs. 1, 2, 3 and 4 carry over to the changes in clinician refusal and correlation. The main result to report is that 2SRI performs similarly in all narios. In fact the bias only reaches over 6 % in one sce-nario where clinician refusal and correlation are 0.1 and zero (Fig. 1). This shows the 2SRI method is only slightly biased even as refusal rates and correlation strengths are quite large. In the same scenarios when the ICC = 0.05 the required sample sizes for each recruitment method changed, however the biases and power in each scenario were no different. The standard error of individual IV estimates (s:e: ^β ), which have not been reported, are
always larger than that of ITT and PP. In recruitment method 1 the standard error of the IV methods increases to around 0.15, almost half the magnitude of β. In re-cruitment method 2 the size of the standard errors did not change from around 0.11 (reflected by the consistent
power). The 95 % confidence intervals around the per-centage bias calculated is always between∓2 – 3 % of the bias shown.
Acknowledgements
The research leading to these results was conducted as part of Work Package 2 of the GetReal consortium. This paper only reflects the personal views of the stated authors. For further information please refer to http://www.imi-getreal.eu/.
Funding
The work leading to these results has received support from the Innovative Medicines Initiative Joint Undertaking under grant agreement no. 115546, resources of which comprise financial contribution from the European Union Seventh Framework Programme(FP7/2007-2013) and EFPIA companies’in kind contribution. The study was also partly supported by the University of Manchester’s Health eResearch Centre (HeRC) funded by the Medical Research Council (MRC) Grant MR/K006665/1.
Availability of data and materials
Code to run the simulations are available upon request to the first author, [email protected].
Authors’contributions
AP ran the simulations and drafted the manuscript; MS provided
consultation when running the simulations and conducted critical revision of the manuscript for intellectual content; JC provided assistance in running the simulations, consultation when running the simulations and conducted critical revision of the manuscript for intellectual content; TVS conceptualised the ideas for the work, provided consultation when running the simulations and conducted critical revision of the manuscript for intellectual content. All authors read and approved the final manuscript.
Competing interests
The authors declare that they have no competing interests.
Ethics and consent to publish Not applicable.
Author details 1
Health eResearch Centre, Farr Institute for Health Informatics Research, University of Manchester, 1.003 Vaughan House, Manchester M13 9PL UK. 2Utrecht Institute of Pharmaceutical Sciences, Utrecht University, Utrecht, The Netherlands.
Received: 25 March 2016 Accepted: 10 August 2016
References
1. Vickers AJ. Clinical trials in crisis: Four simple methodologic fixes. Clin Trials. 2014;11(6):615–21.
2. Zwarenstein M, Oxman A. Why are so few randomized trials useful, and what can we do about it? J Clin Epidemiol. 2006;59(11):1125–6. 3. Zwarenstein M, Treweek S. What kind of randomised trials do patients and
clinicians need? Evid Based Med. 2009;14(4):101–3.
4. Luce BR, Kramer JM, Goodman SN, Connor JT, Tunis S, Whicher D, Schwartz JS. Medicine and Public Issues Annals of Internal Medicine Rethinking Randomized Clinical Trials for Comparative Effectiveness Research: The Need for Transformational Change. Ann Intern Med. 2009;151:206–209.
5. Thorpe KE, Zwarenstein M, Oxman AD, Treweek S, Furberg CD, Altman DG, Tunis S, Bergel E, Harvey I, Magid DJ, Chalkidou K. A pragmatic-explanatory continuum indicator summary (PRECIS): a tool to help trial designers. J Clin Epidemiol. 2009;62(5):464–75.
6. van Staa T-P, Goldacre B, Gulliford M, Cassell J, Pirmohamed M, Taweel A, Dalaney B, Smeeth L. Pragmatic randomised trials using routine electronic health records: putting them to the test. BMJ. 2012;344(1):e55.
7. Purgato M, Barbui C, Stroup S, Adams C. Pragmatic design in randomized controlled trials. Psychol Med. 2014;45(02):225–30.
8. Relton C, Torgerson D, O’Cathain A, Nicholl J. Rethinking pragmatic randomised controlled trials: introducing the‘cohort multiple randomised controlled trial’design. BMJ. 2010;340:c1066.
9. Burbach JM, Verkooijen HM, Intven M, Kleijnen J-PJ, Bosman ME, Raaymakers BW, van Grevenstein WM, Koopman M, Seravalli E, van Asselen B, Reerink O. RandomizEd controlled trial for pre-operAtive dose-escaLation BOOST in locally advanced rectal cancer (RECTAL BOOST study): study protocol for a randomized controlled trial. Trials. 2015;16(1):1–8. 10. Mitchell N, Hewitt C, Adamson J, Parrott S, Torgerson D, Ekers D, Holmes J,
Lester H, McMillan D, Richards D, Spilsbury K, Godfrey C, Gilbody S. A randomised evaluation of CollAborative care and active surveillance for Screen-Positive EldeRs with sub-threshold depression (CASPER): study protocol for a randomized controlled trial. Trials. 2011;12(1):225.
11. Kwakkenbos L, Jewett LR, Baron M, Bartlett SJ, Furst D, Gottesman K, Khanna D, Malcarne VL, Mayes MD, Mouthon L, Poiraudeau S, Sauve M, Nielson WR, Poole JL, Assassi S, Boutron I, Ells C, van den Ende CH, Hudson M, Impens A, Körner A, Leite C, Costa Maia A, Mendelson C, Pope J, Steele RJ, Suarez-Almazor ME, Ahmed S, Coronado-Montoya S, Delisle VC, Gholizadeh S, Jang Y, Levis B, Milette K, Mills SD, Razykov I, Fox RS, Thombs BD. The
Scleroderma Patient-centered Intervention Network (SPIN) Cohort: protocol for a cohort multiple randomised controlled trial (cmRCT) design to support trials of psychosocial and rehabilitation interventions in a rare disease context. BMJ Open. 2013;3(8):1–11.
12. Uher R, Cumby J, Mackenzie LE, Morash-conway J, Glover JM, Aylott A, Propper L, Abidi S, Bagnell A, Pavlova B, Hajek T, Lovas D, Pajer K, Gardner W, Levy A, Alda M. A familial risk enriched cohort as a platform for testing
early interventions to prevent severe mental illness. BMC Psychiatry. 2014; 14(1):344.
13. Young-Afat HMVDA, van Gils CH, van den Bongard HJ, van Vulpen M. Introducing the new‘cohort multiple Randomised Controlled Trial’design for evaluation of interventions for breast cancer: The UMBRELLA study. Eur J Cancer. 2014;50:S210–9.
14. R. Uher,“Skills for Wellness - Full Text View - ClinicalTrials.gov,”2013. [Online]. Available: https://clinicaltrials.gov/show/NCT01980147. [Accessed: 29-Oct-2015]. 15. Bower P. ISRCTN - ISRCTN12286422: CLASSIC Proactive Telephone Coaching
and Tailored Support (PROTECTS). 2014.
16. M. van Vulpen,“Randomized Trial Comparing Conventional Radiotherapy With Stereotactic Radiotherapy in Patients With Spinal Metastases -VERTICAL Study - Full Text View - ClinicalTrials.gov,”2015. [Online]. Available: https://www.clinicaltrials.gov/ct2/show/NCT02364115. [Accessed: 29-Oct-2015].
17. van Staa TP, Dyson L, McCann G, Padmanabhan S, Belatri R, Goldacre B, Cassell J, Pirmohamed M, Torgerson D, Ronaldson S, Adamson J, Taweel A, Delaney B, Mahmood S, Baracaia S, Round T, Fox R, Hunter T, Gulliford M, Smeeth L. The opportunities and challenges of pragmatic point-of-care randomised trials using routinely collected electronic records: Evaluations of two exemplar trials. Health Technol Assess (Rockv). 2014;18(43):1–146. 18. Angrist JD, Imbens GW, Rubin DB, Association S, Jun N. Identification of
Causal Effects Using Instrumental Variables. J Am Stat Assoc. 1996;91(434):444–55.
19. Greenland S. An introduction to instrumental variables for epidemiologists. Int J Epidemiol. 2000;29(4):722–9.
20. Frangakis BCE, Rubin DB. Addressing complications of intention-to-treat analysis in the combined presence of all-or-none treatment-noncompliance and subsequent missing outcomes. Biometrika. 1999;86(2):365–379. 21. Dunn G, Maracy M, Tomenson B. Estimating treatment effects from
randomized clinical trials with noncompliance and loss to follow-up: the role of instrumental variable methods. Stat Methods Med Res. 2005;14(4):369–95. 22. Wu J, Zhu S, Yao GL, Mohammed MA, Marshall T. Patient Factors
Influencing the Prescribing of Lipid Lowering Drugs for Primary Prevention of Cardiovascular Disease in UK General Practice: A National Retrospective Cohort Study. PLoS One. 2013;8(7):1–10.
23. Roland M, Torgerson DJ. Understanding controlled trials: What are pragmatic trials? BMJ. 1998;316(7127):285.
24. Armijo-Olivo S, Warren S, Magee D. Intention to treat analysis, compliance, drop-outs and how to deal with missing data in clinical research: a review. Phys Ther Rev. 2009;14(1):36–49.
25. Terza JV, Basu A, Rathouz PJ. Two-stage residual inclusion estimation: Addressing endogeneity in health econometric modeling. J Health Econ. 2008;27(3):531–43.
26. Efron BYB. Nonparametric estimates of standard error: The jackknife, the bootstrap and other methods. Biometrika. 1981;68(3):589–599. 27. Groenwold RHH, Uddin MJ, Roes KCB, De Boer A, Martin E, Gatto NM,
Klungel OH. Instrumental variable analysis in randomized trials with non-compliance and observational pharmacoepidemiologic studies. OA Epidemiology. 2014;2(1):9.
28. Hernán MA, Robins JM. Instruments for causal inference: an epidemiologist’s dream? Epidemiology. 2006;17(4):360–72.
29. HSCIC,“Numbers of Patients Registered at a GP Practice - April 2015,”2015. [Online]. Available: http://www.hscic.gov.uk/searchcatalogue?productid= 17788&topics=1%2fPrimary+care+services%2fGeneral+practice&sort=Most +recent&size=10&page=2#top. [Accessed: 30-Oct-2015].
30. Townsend N, Williams J, Bhatnagar P, Wickramasinghe K, Rayner M (2014). Cardiovascular disease statistics, 2014. British Heart Foundation: London. 31. Eldridge SM, Ashby D, Kerry S. Sample size for cluster randomized trials: Effect of coefficient of variation of cluster size and analysis method. Int J Epidemiol. 2006;35:1292–300.
32. Kerry SM, Martin Bland J. Unequal cluster sizes for trials in English and Welsh general practice: Implications for sample size calculations. Stat Med. 2001;20:377–90.
33. Arnold BF, Hogan DR, Colford JMJ, Hubbard AE. Simulation methods to estimate design power: an overview for applied research. BMC Med Res Methodol. 2011;11:94.
34. O’Quigley J, Stare J. Proportional hazards models with frailties and random effects. Stat Med. 2002;21(21):3219–33.
36. Greenland S, Robins J, Pearl J. Confounding and collapsibility in causal inference. Stat Sci. 1999;14:29–46.
37. Adamson J, Cockayne S, Puffer S, Torgerson DJ. Review of randomised trials using the post-randomised consent (Zelen’s) design. Contemp Clin Trials. 2006;27:305–19.
38. Hollis S, Campbell F. What is meant by intention to treat analysis? Survey of published randomised controlled trials. BMJ. 1999;319(7211):670–4. 39. Snapinn SM, Jiang Q, Iglewicz B. Informative noncompliance in endpoint
trials. Curr Control Trials Cardiovasc Med. 2004;5(1):5.
40. Ye C, Beyene J, Browne G, Thabane L. Estimating treatment effects in randomised controlled trials with non-compliance: a simulation study. BMJ Open. 2014;4:e005362.
41. Goldsmith LP, Lewis SW, Dunn G, Bentall RP. Psychological treatments for early psychosis can be beneficial or harmful, depending on the therapeutic alliance: an instrumental variable analysis. Psychol Med. 2015;45(11):2365–73. 42. Jago R, Edwards MJ, Sebire SJ, Tomkinson K, Bird EL, Banfield K, May T,
Kesten JM, Cooper AR, Powell JE, Blair PS. Effect and cost of an after-school dance programme on the physical activity of 11–12 year old girls: The Bristol Girls Dance Project, a school-based cluster randomised controlled trial. Int J Behav Nutr Phys Act. 2015;12(1):128.
43. Halpern SD, French B, Small DS, Saulsgiver K, Harhay MO, Audrain-McGovern J, Loewenstein G, Brennan TA, Asch DA, Volpp KG. Randomized Trial of Four Financial-Incentive Programs for Smoking Cessation. N Engl J Med. 2015;372(22):2108–17.
44. van der Velden JM, Verkooijen HM, Young-Afat DA, Burbach JPM, van Vulpen M, Relton C, van Gils CH, May AM, Groenwold RHH. The cohort multiple randomized controlled trial design: a valid and efficient alternative to pragmatic trials?. Int J Epidemiol. 2016. doi:10.1093/ije/dyw050. 45. Lakatos E. Sample size determination in clinical trials with time-dependent
rates of losses and noncompliance. Control Clin Trials. 1986;7(3):189–99. 46. Sato T. Sample size calculations with compliance information. Stat Med.
2000;19(19):2689–97.
47. Jiang Q, Snapinn S, Iglewicz B. Calculation of sample size in survival trials: the impact of informative noncompliance. Biometrics. 2004;60(3):800–6. 48. Wan F, Small D, Bekelman JE, Mitra N. Bias in estimating the causal hazard
ratio when using two-stage instrumental variable methods. Stat Med. 2015; 34(14):2235–2265.
49. Swanson SA, Hernán MA. Commentary. Epidemiology. 2013;24(3):370–4.
• We accept pre-submission inquiries
• Our selector tool helps you to find the most relevant journal
• We provide round the clock customer support
• Convenient online submission
• Thorough peer review
• Inclusion in PubMed and all major indexing services
• Maximum visibility for your research
Submit your manuscript at www.biomedcentral.com/submit