S Y S T E M A T I C R E V I E W P R O T O C O L
Open Access
A systematic map protocol: which components or
attributes of biodiversity affect which dimensions
of poverty?
Dilys Roe
1*, Chris Sandbrook
2, Max Fancourt
2, Bjorn Schulte
2, Robert Munroe
3and Mxolisi Sibanda
1Abstract
Background:The assumption that biodiversity and ecosystem services can help in efforts to tackle poverty is implicit in international targets set for biodiversity conservation (by the Convention on Biological Diversity) and for poverty reduction (enshrined in the Millennium Development Goals). The 2010 United Nations General Assembly further stressed the linkage, claiming:“preserving biodiversity is inseparable from the fight against poverty.”
Nevertheless the evidence-base on biodiversity–poverty links is not as robust as one might assume. Studies in the academic and“grey”literature have used diverse methods and metrics, different components of biodiversity and dimensions of poverty have been studied, and the scale of impact has rarely been assessed.
Methods/Design:This systematic map protocol sets out the proposed methodology for exploring the primary question: Which components or attributes of biodiversity affect (positively or negatively) which dimensions of poverty? The overall aim of our review is to unpack the broad claims and assumptions that are made about biodiversity-poverty links such as those above, and provide researchers, policy-makers and practitioners with a methodical overview of the type and quantity of evidence. The online databases SCOPUS and Web of Science will be searched for relevant peer-reviewed literature using search terms and Boolean search operators. Relevant grey literature will be identified through the membership and resources of the Poverty and Conservation Learning Group. The literature searches will be followed by a title and abstract level search using inclusion and exclusion criteria. Data will be extracted from the final list of papers using a questionnaire established through literature review and an expert workshop. A report and online database will be produced based on the results of the review.
Keywords:Biodiversity, Nature conservation, Wildlife conservation, Poverty, Livelihoods
Background
Biodiversity conservation and poverty alleviation are both important societal goals demanding increasing international attention. At first glance they may appear to be separate policy realms with little connection. The Convention on Biological Diversity (CBD), agreed in 1992, was drafted in response to escalating biodiversity loss and provides an international policy framework for biodiversity conservation activities worldwide. Similarly, the OECD International De-velopment Targets of 1996 - reiterated as the Millennium Development Goals (MDGs) in 2000–focus international development efforts on global poverty alleviation.
However, there is an explicit assumption that conserv-ing biodiversity (or reducconserv-ing the rate of biodiversity loss) can help in efforts to tackle global poverty [1]. Evidence of this assumption lies in the target that parties to the CBD agreed in 2002:“to achieve by 2010 a significant re-duction of the current rate of biodiversity loss at the global, regional and national level as a contribution to poverty alleviation [emphasis added] and to the benefit of all life on earth” [2]. The development community also bought into this assumption: when the Millennium Development Goals (MDGs) were formulated in 2000, for example, Goal 7 included a target to“reverse the loss of environmental resources”, one indicator of which was the area of land under protection for biodiversity. Subse-quently, the CBD “2010 Target” was included as a new * Correspondence:[email protected]
1
International Institute for Environment and Development (IIED), 80-86 Grays Inn Road, London WC1X 8NH, UK
Full list of author information is available at the end of the article
target within MDG7 following the 2006 UN General Assembly [3] with additional biodiversity indicators [4].
The Millennium Ecosystem Assessment (MA) pub-lished in 2005, earlier emphasised the link between biodiversity conservation and poverty reduction. The conceptual framework of the MA views biodiversity as underpinning the delivery of a range of ecosystem goods and services on which human well-being depends (pov-erty being “the pronounced deprivation of well-being” [5]. The MA further notes that “many aspects of bio-diversity decline have a disproportionate impact on poor people”[6].
The reduction in the rate of biodiversity loss antici-pated in the 2010 target was not achieved [7,8]. This continued loss of biodiversity is lamented not just for its own sake but for its implications for continued human wellbeing and poverty reduction. The 2010 progress re-port on the MDGs, for example, noted “The irreparable loss of biodiversity will also hamper efforts to meet other MDGs, especially those related to poverty, hunger and health, by increasing the vulnerability of the poor and reducing their options for development”[9]. A high level meeting at the September 2010 UN General Assembly further stressed the linkage, claiming: “preserving bio-diversity is inseparable from the fight against poverty” [10]. The CBD’s new Strategic Plan (2011–2020), agreed at the 10th Conference of Parties in Nagoya, Japan in October 2010 continues to emphasise the link between achieving conservation goals and reducing poverty: its mission being to“take effective and urgent action to halt the loss of biodiversity in order to ensure that by 2020 ecosystems are resilient and continue to provide essen-tial services, thereby securing the planet’s variety of life, and contributing to human well-being, and poverty eradication”[11].
Biodiversity conservation has no single relationship with poverty reduction. For example, six different rela-tionships have been described between environment and poverty: from a vicious cycle of poverty leading to envir-onmental degradation and thence to more poverty; to a win-win scenario where environmental conservation contributes to poverty alleviation [12] and the same is likely to hold for biodiversity and poverty. There is cer-tainly no linear relationship–the MA demonstrates that while many millions of people have benefited from the transformation of ecosystems and exploitation of natural resources, the benefits have not been evenly or equitably distributed, with the poor being the biggest losers [13]. Other commentators have noted the dynamic and context-specific nature of the biodiversity conservation-poverty alleviation relationship [14-16]. In particular, cross-cutting determinants such as governance, policies on poverty and biodiversity protection, and population growth and density which are associated with the
socio-economic context and are critical in determining whether or not biodiversity leads to actual poverty re-duction [17].
Thus, the causal relationships are not so simple that one can say poverty causes biodiversity loss, or improve-ments in biodiversity reduce poverty. This suggests a need to be more specific in defining what types of pov-erty and biodiversity issues are being assessed [18,19]. Within the broad policy statements described above, this specificity does not exist. Biodiversity is defined by the CBD as “the variability among living organisms from all sources including, inter alia, terrestrial, marine and other aquatic ecosystems and the ecological complexes of which they are part; this includes diversity within spe-cies, between species and of ecosystems”. This focus on variability is often missing, however, when assertions such as those above are made. The term biodiversity is often used to refer to the amount (in terms of abun-dance or biomass) of species and populations or to specific elements of biodiversity rather than variety per se [20,21]. Poverty is another term with many different definitions. The simplest usually relate to some level of material wealth –for example the Millennium Develop-ment Goal to “eradicate extreme poverty” refers to the billion-plus people whose income is less that US $1 a day. However, poor people often do not define them-selves in cash income terms – indeed the concept of cash is completely meaningless for some indigenous communities who live outside of the cash economy. In many cases, issues such as power and voice, opportunity and a healthy environment are valued more highly than money. It has therefore become increasingly recognised that poverty is multi-dimensional. The World Bank, for example, describes poverty as‘a pronounced deprivation in well-being…. To be poor is to be hungry, to lack shel-ter and clothing, to be sick and not cared for, to be illiterate and not schooled’[22].
“scientific” assessments and analyses remains a major challenge (e.g. see [27,28].
Our research is stimulated by an interest in better un-derstanding the evidence behind the broad claims made by the United Nations and others about the role of biodiversity in contributing to poverty alleviation. Dis-aggregating the terms and exploring which particular components/attributes of biodiversity affect which components/attributes of poverty will help achieve this understanding. Part of the funding for this study comes from a research programme on Ecosystem Services and Poverty Alleviation (ESPA)awhich is specifically concerned with the question of ‘How do ecosystem services contrib-ute to sustainable poverty alleviation?’ Our focus on biodiversity-poverty linkages therefore provides some es-sential background in efforts to address this question.
Objective of the review
The overall objective of this systematic map is to describe the current state of the evidence base – the degree to which it disaggregates“biodiversity”and“poverty”, its rep-resentativeness, the types of linkages that have been found, the methods that have been used to analyse them. We do not seek to pre-judge the‘quality’of different types of evi-dence in our mapping process, recognising that the type of evidence required depends on the specific question be-ing asked and on the motivation and discipline of the questioner. However, by describing the methods used by each study that we map - as well as the degree to which they have taken account of confounding factors, spatial and temporal considerations and so on–we will leave fu-ture researchers, practitioners and policy analysts better able to identify what evidence is and isn’t relevant for the specific questions they wish to answer.
We initially framed our research questions as:
i. What evidence exists on the relationship between biodiversity and poverty alleviation?
ii. What is the current state of that evidence?
And a number of sub questions:
i. What is the geographical focus of the evidence base? ii. What components of biodiversity have been
addressed?
iii. What dimensions of poverty have been addressed? iv. What methods were used to collect the evidence? v. What can we say about the relative strength of the
evidence given our understanding of what constitutes strong evidence?
Following a meeting of the project team we refined our primary research question as follows:
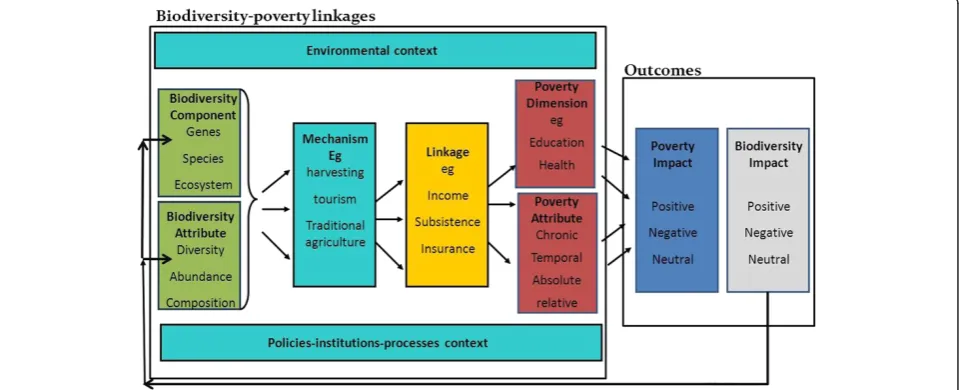
Which components or attributes of biodiversity affect (positively or negatively) which dimensions of poverty? Table1summarises the different components of the question and Figure1provides a conceptual framework diagram for the review. Our secondary research question remains: What is the current state of the evidence?–although this question is already implicit in the nature of a systematic map as an overview of evidence.
Methods
Search terms
Searches will be conducted in English only. Because we are interested in disaggregating broad claims about bio-diversity and poverty the search terms used will describe different components of biodiversity and different di-mensions of poverty. A test set of terms were developed iteratively by the project team checking the numbers of hits scored and returns of a short list of key publications with different combinations of the terms. In a scoping exercise we tested the searches on SciVerse’s Scopus on-line bibliographic database [29]. The scoping highlighted the problems with biodiversity and poverty terminology in that simply combining the two terms only produced 574 hits, while using terms that are commonly used interchangeably with biodiversity (for example “wildlife”,
“nature”) and combining these (using the Boolean oper-ator “AND”) with “poverty” produced over 15,000 hits. Including separate elements of biodiversity (for example
“forest”,“fish”,“species”(separated by the Boolean oper-ator “OR”)) and combing with poverty produced over 27,000 hits, while adding in additional poverty concepts (for example “poor people”, “livelihoods”, “wellbeing”) brought the total to over 30,000 hits. As a result of this unmanageable number of articles, the search string was modified in several ways:
1. we added an additional tier of terms that emphasised a human element (for example,
“household”;“farmer”;“dweller”);
2. we added in different dimensions of poverty (for example,“income”;“health”;“assets”);
3. we limited the search to selected subject areas within the Scopus database (for example,
“environment”;“economics”and“agriculture”and then further excluded more precise subjects within these broad areas (for example“nursing”;“dentistry”;
“mathematics”).
during the workshop to further refine the search terms– including adding extra poverty terms and extra biodiver-sity terms. These new terms were further tested by the project team–testing any additional hits generated by the new terms for relevance at each stage. Additional file 1: Annex 1 summarises the search terms scoping and evolu-tion of the final search string.
Publication database searches
Two peerreviewed publication databases will be searched -SciVerse’s SCOPUS, and ISI’s Web of Science [30] both of which cover natural and social sciences. The search string described in Additional file 1: Annex 1 will be used in Scopus to search titles, abstracts and keywords. Within Web of Science the equivalent field code is“Topic”which also includes title, abstract and keywords. The search string will be slightly modified when applied to Web of Science because of the different way it structures subject areas and hence the subjects which the search can be limited to or which can be excluded. In Scopus, each journal is assigned one or more of the 335‘subject areas’each of which falls under one of 27 major subject areas and it is these major subject areas which can be used to refine the search re-sults–as documented in Additional file 1: Annex 1. Web of Science, by contrast, allocates individual articles to one or more of 156“research areas” which can be included or excluded in order to refine the search. There are many overlaps between the Web of Science research areas and the Scopus subject areas but they are not directly
comparable. Additional file 2: Annex 2 describes the subject areas that were used in the search terms scoping exercise and highlights the equivalent research areas that would need to be included or excluded in Web of Science in order to achieve a comparable result. The results from the Scopus search will be combined with the Web of Science results and screened for duplicates using bibliographic software Endnote and Zotero.
Search engine searches
Google Scholar will also be searched just using the terms: "biodiversity" OR "wildlife" AND "poverty" OR "liveli-hoods" OR "poor". The first 50‘hits’will be compared with the Web of Science and Scopus search returns to test their comprehensiveness. References returned by the Google Scholar search, but not found in the Web of Science and Scopus searches, will be added to the reference list.
Specialist searches–searches of grey literature
A limited selection of ‘grey’literature (i.e. published and unpublished documents that do not pass through the scientific peer-review system) will be identified in a number of ways. First, a call will be issued to the Poverty and Conservation Learning Group (PCLG) - an inter-national network of conservation and development orga-nisations coordinated by IIED [31]. Members of the network will be asked to identify key pieces of grey lit-erature produced by their organisation. Second, the websites of organisations that are members of the PCLG
Table 1 Elements of the systematic map question
Subject Intervention Comparators Outcomes
Human individuals, households or communities, or nation states in developing countries
Direct or indirect use or conservation of one or more component of biodiversity
No use or conservation of biodiversity
Positive or negative effects on the multi-dimensional poverty status of people using biodiversity in developing countries
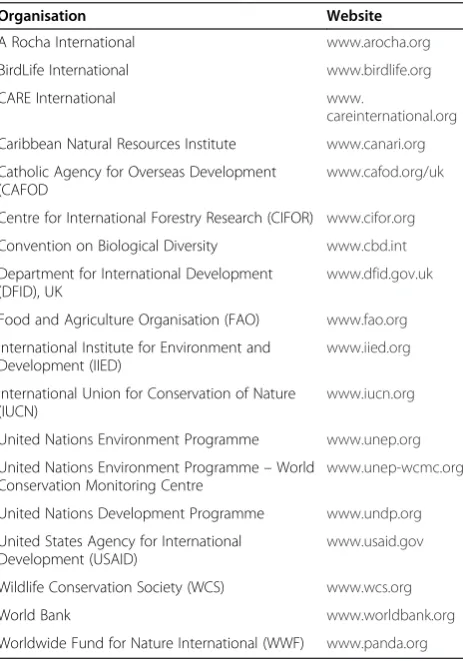
and listed in its online database [32] will be screened (Table 2 details the organisations and websites to be reviewed). Thirdly, the PCLG bibliographic database [33] will be searched using the search terms-“poverty” OR “livelihoods” AND “biodiversity”, OR “wildlife” OR
“nature”OR“species”. Fourthly, participants at the experts workshop held in August 2012 will be invited to review the final list of publications and to identify any further key publications they feel are missing from our list.
Estimating the comprehensiveness of the search
Our use of disaggregated poverty and biodiversity terms in the search string will ensure a comprehensive search. Dur-ing the search terms scopDur-ing exercise we reviewed the number of additional returns generated by adding new search terms and continued to add search terms if they returned relevant articles not previously captured. Indeed the broad nature of the terms means that our search is likely to return many irrelevant papers –making the art-icle screening process particularly important - but this is considered an acceptable risk to ensure that the search is comprehensive and does not overlook relevant articles from non-traditional sources.
Limitations of the review’s comprehensiveness are that we will only be including material written in English. Furthermore, depending on the total number of articles that we identify for review at the end of our search we may–due to time and resources available–have to se-lect a subset for detailed review. If that is the case the subset will be selected according to some agreed cri-teria–e.g. focussing on studies from one region of the world only; or one element of biodiversity or poverty. The criteria will be decided once basic information (sections 1 and 2 of the data extraction strategy) have been collected and a clearer idea of the scope of the lit-erature obtained. In the event of this happening, the full list of papers before the subset is decided upon will be made available in the results paper.
Study inclusion/exclusion criteria
In order to be included, an article needs to fulfil each of the following criteria:
Relevant population(s):the study makes mention of poverty in human populations, and is based in a non-OECD country.
Relevant exposure(s):the study makes mention of a link between biodiversity conservation/use and an effect on poverty/local livelihoods
Relevant outcomes:the study describes an effect on poverty–or a specific dimension of poverty–or human wellbeing (including assessments of
contribution to local livelihoods)
Relevant study design:all study designs will be included with a few exceptions (see exclusion criteria below)
In addition, the following exclusion criteria will be applied:
Irrelevant countries:studies that are focussed on OECD countries
Irrelevant interventions:studies must address the effects of biodiversity use/conservation on poverty. Studies that assess the effects of poverty on biodiversity or on the effectiveness of conservation interventions will be excluded.
Irrelevant study design:theoretical studies such as models, scenarios, attitudinal reviews.
The inclusion/exclusion process will take place through a number of stages. Firstly all the article titles will be reviewed and articles will be excluded if their ti-tles are considered to be irrelevant according to the cri-teria above. Secondly, all the abstracts of the articles passing the first stage of title review will be read and any
Table 2 List of websites to be searched for grey literature
Organisation Website
A Rocha International www.arocha.org
BirdLife International www.birdlife.org
CARE International www.
careinternational.org
Caribbean Natural Resources Institute www.canari.org
Catholic Agency for Overseas Development (CAFOD
www.cafod.org/uk
Centre for International Forestry Research (CIFOR) www.cifor.org
Convention on Biological Diversity www.cbd.int
Department for International Development (DFID), UK
www.dfid.gov.uk
Food and Agriculture Organisation (FAO) www.fao.org
International Institute for Environment and Development (IIED)
www.iied.org
International Union for Conservation of Nature (IUCN)
www.iucn.org
United Nations Environment Programme www.unep.org
United Nations Environment Programme–World Conservation Monitoring Centre
www.unep-wcmc.org
United Nations Development Programme www.undp.org
United States Agency for International Development (USAID)
www.usaid.gov
Wildlife Conservation Society (WCS) www.wcs.org
World Bank www.worldbank.org
which do not meet the criteria excluded. In both stages, if there is any doubt about the relevance of an article it will be retained.
The title review and abstract review stages will be under-taken by two researchers and a kappa test [34] performed at each stage in order to check consistency in the inter-pretation of the inclusion/exclusion criteria. The two reviewers will review a common, random 10 per cent sam-ple of the titles and abstracts (up to a maximum of 500 of each). The level of agreement between the number of arti-cles rejected or accepted by each of the reviewers will be calculated using the Kappa statistic which adjusts the pro-portion of records for which there was agreement by the proportion that you would expect by chance alone [34]. Values can range from +1 (perfect agreement) to−1 (per-fect disagreement). As recommended by the CEE guide-lines [35] if the kappa test returns a value indicating less than substantial agreement (less than 0.5) then the re-searchers will review the differences in their application of the inclusion/exclusion criteria and re-test against a fur-ther set of articles until a satisfactory score is obtained.
Once articles have been excluded or included based on the abstracts, reasonable effort will be made to secure paper or electronic copies of full articles. However, it may not be feasible within the time and resources avail-able to secure all the articles and any not secured will also excluded from the final list of articles. If this is the case, a full list of relevant articles will be provided in the results paper.
The final stage of inclusions/exclusion will take place during the process of data extraction (see below).
Study quality assessment
We do not plan to assess the quality of included studies as we recognise that different stakeholders have different interpretations of what constitutes quality [28]. As part of our data extraction strategy, however, we will collect information that will enable users of our research to draw their own judgements as to the quality of each study and the evidence base as a whole (see data extrac-tion strategy below and details of the data extracextrac-tion questionnaire provided as Additional file 3). We will therefore provide details about the research design, the type of data collected, sample size, duration of study and so on as part of the mapping process and will use de-scriptive statistics to summarise this information.
Data extraction strategy
Each article will be interrogated against a standard ques-tionnaire and the data extracted using a custom made programme which provides a user-friendly interface and exports data into either Excel or Access. The question-naire was developed based on the project team’s com-bined professional experience and literature review and was refined through discussion with experts at the August 2012 workshop (Additional file 3: Biodiversity-Poverty Evidence Assessment Framework).
The following data will be extracted:
1. Bibliographic information: author, year, title, publication, place published, publisher
2. Basic information: dimension of poverty, aspect of poverty, component of biodiversity, attribute of
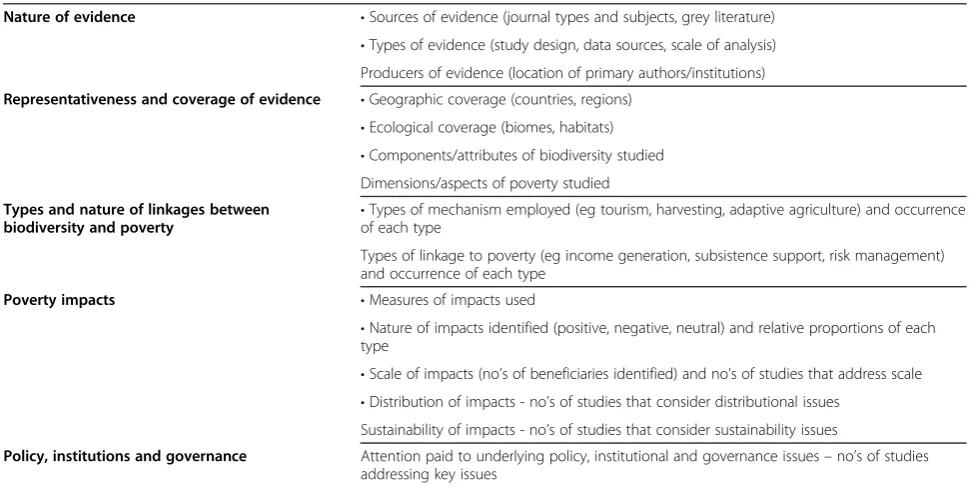
Table 3 Systematic map - categories of data to be included in overview
Nature of evidence •Sources of evidence (journal types and subjects, grey literature) •Types of evidence (study design, data sources, scale of analysis) Producers of evidence (location of primary authors/institutions)
Representativeness and coverage of evidence •Geographic coverage (countries, regions) •Ecological coverage (biomes, habitats) •Components/attributes of biodiversity studied Dimensions/aspects of poverty studied
Types and nature of linkages between
biodiversity and poverty •
Types of mechanism employed (eg tourism, harvesting, adaptive agriculture) and occurrence of each type
Types of linkage to poverty (eg income generation, subsistence support, risk management) and occurrence of each type
Poverty impacts •Measures of impacts used
•Nature of impacts identified (positive, negative, neutral) and relative proportions of each type
•Scale of impacts (no’s of beneficiaries identified) and no’s of studies that address scale •Distribution of impacts - no’s of studies that consider distributional issues
Sustainability of impacts - no’s of studies that consider sustainability issues
biodiversity, type of intervention, type of mechanism, location of study, habitat studied, measure of poverty impact
3. Details of evidence type: source, location of primary author, study design, methodology, type of data, unit of analysis, duration of study
4. Relevant detail considered by study: biodiversity status of site, poverty status of site, natural resource governance regime, resource rights regime, land tenure regime, power relations, trade-offs. 5. Details of outcomes: poverty measure used,
distribution of impacts, duration of impacts, replicability, thresholds/tipping points, spatial distribution of impacts, sustainability.
All articles will be reviewed to the end of section 2 of the data extraction questionnaire. If the answer to the final question in section 2“Does the study include a measure of poverty impact?”is no, this will be deemed as not qualify-ing as evidence of a link between biodiversity and poverty and so no further analysis of the study will be undertaken. Examples of measure of poverty impact might include in-come generated, improvements in education provision or enrolment, uptake of social services and so on. All articles that do include some measure of poverty impact will be subject to the full data extraction questionnaire. Section 3 is intended to facilitate a description of the quantity and type of evidence. Sections 4 and 5 provide some insights into the degree to which the evidence covers issues that an expert workshop and literature review determine necessary to make a comprehensive assessment of biodiversity-poverty linkages
Wherever possible fixed answers will be selected from a drop down list and entered into the spreadsheet in nu-merical format in order to allow for subsequent analysis with descriptive statistics. Where not possible, qualita-tive narraqualita-tive data will be collected. A full list of the questions and answer codes is provided as supplemen-tary information.
Data mapping and presentation
We plan to provide a narrative mapping of all the articles that were reviewed in full. The main method employed to map the collected data will be descriptive statistics which will be used to summarise quantitative trends, map the quantity and type of articles reviewed, and highlight their relevance to the primary question. The statistical analysis will be supplemented by a summary analysis of any quali-tative information collected. The narrative report will therefore be supplemented with graphs and charts which show, for example, relative geographical distribution of studies, relative proportions of studies addressing different dimensions of poverty and employing different compo-nents of biodiversity, numbers of studies using different
types of research design, and so on. Table 3 summarises the main categories of data that will be analysed to pro-vide an overview of the epro-vidence on biodiversity-poverty linkages.
Endnotes
a
Ecosystem Services and Poverty Alleviation (ESPA) programme of the UK Department for International Development, Natural Environment Research Council (NERC) and Economic and Social Research Council (ESRC).
Additional files
Additional file 1: Annex 1.Scoping of search terms and evolution of search string.
Additional file 2: Annex 2.Comparison of Scopus subject areas and Web of Science research areas. Scopus - Subject Areas Limited To in Search String Evolution.
Additional file 3:Biodiversity-Poverty Evidence Assessment Framework.
Competing interests
No competing interests have been identified.
Authors’contributions
DR jointly–with CS and BSH - conceived the study and secured the funding support. DR, MF and RM co-drafted the manuscript while CS, BSH and MS provided comments. DR, CS and BSH jointly developed the data extraction strategy. DR will coordinate the review and the analysis and presentation of results. MF, MS and RM will participate in the review. All authors read and approved the final manuscript.
Acknowledgements
The authors would like to thank the Directorate of the ESPA programme for providing the initial funding for this study from its Evidence and Impact Research Grants scheme. Additional funding for this study and for the products produced under this study including this article has been provided by UKaid from the UK Government, however the views expressed do not necessarily reflect the views of the UK Government.
Author details
1International Institute for Environment and Development (IIED), 80-86 Grays Inn Road, London WC1X 8NH, UK.2United Nations Environment Programme -World Conservation Monitoring Centre (UNEP-WCMC), 219 Huntingdon Road, Cambridge CB3 0DL, UK.3Birdlife International, Wellbrook Court, Girton, Cambridge CB3 0NA, UK.
Received: 30 January 2013 Accepted: 16 April 2013 Published: 30 April 2013
References
1. Roe D (Ed):Linking Biodiversity Conservation and Poverty Alleviation: A State of Knowledge Review. CBD Technical Series no 55.Montreal: Secretariat of the Convention on Biological Diversity; 2010.
2. SCBD:Decision VI/26: Strategic Plan for the Convention on Biological Diversity.
Montreal: Secretariat of the Convention on Biological Diversity; 2002. 3. United Nations:Report of the Secretary General on the Work of the
Organization.New York: United Nations; 2006.
4. United Nations:Official List of MDG Indicators.2008. http://mdgs.un.org/ unsd/mdg/Host.aspx?Content=Indicators/OfficialList.htm (last accessed 10 March 2011).
6. Millennium Ecosystem Assessment:Ecosystems and Human Well-being: Biodiversity Synthesis.Washington DC: World Resources Institute; 2005:6. 7. Butchart SH, Walpole M, Collen B, van Strien A, Scharlemann JP, Almond RE,
Baillie JE, Bomhard B, Brown C, Bruno J, Carpenter KE, Carr GM, Chanson J, Chenery AM, Csirke J, Davidson NC, Dentener F, Foster M, Galli A, Galloway JN, Genovesi P, Gregory RD, Hockings M, Kapos V, Lamarque JF, Leverington F, Loh J, McGeoch MA, McRae L,et al:Global biodiversity: indicators of recent declines.Science2010,328(5982):1164–1168.
8. Mace GM, Cramer W, Diaz S, Faith DP, Larigauderie A, Le Prestre P, Palmer M, Perrings C, Scholes RJ, Walpole M, Walther BA, Watson JEM, Mooney HA:
Biodiversity targets after 2010.Current Opinion in Environmental Sustainability (COSUST)2010,2(1):3–8.
9. United Nations:The Millennium Development Goals Report.New York: United Nations; 2010:55.
10. United Nations:Secretary-General, at High-Level Meeting, Stresses Urgent Need to Reverse Alarming Rate of Biodiversity Loss, Rescue‘Natural Economy’. 2010: . Press Release 22 Sept 2010, http://www.un.org/News/ Press/docs/2010/ga10992.doc.htm (last accessed 10 March 2011). 11. SCBD:Decision X/2: Strategic Plan for Biodiversity 2011–2020.Montreal:
Secretariat of the Convention on Biological Diversity; 2010.
12. Nadkarni MV:Poverty, Environment, Development: A Many-patterned Nexus.Economic and Political Weekly2000,35(14):1184–1190. 13. Millennium Ecosystem Assessment:Ecosystems and Human Well-being:
Biodiversity Synthesis.Washington DC: World Resources Institute; 2005. 14. Kepe T, Saruchera M, Webster WJ:Poverty Alleviation and Biodiversity
Conservation: A South African Perspective.Oryx2004,38(2):143–145. 15. Redford KH, Sanderson SE:No roads, only directions.Conservation & Society
2006,4(3):379–382.
16. Birdlife International:Livelihoods and the Environment at Important Bird Areas: Listening to Local Voices.Cambridge: BirdLife International; 2007. 17. Tekelenburg A, ten Brink BJE, Witmer MCH,et al:How do Biodiversity and
Poverty Relate? An Explorative Study.Bilthoven, Netherlands: Netherlands Environmental Assessment Agency (PBL); 2009.
18. Steele P, Fernando N, Maneka W:Poverty Reduction That Works: Experience of Scaling Up Development Success.London: Earthscan; 2008.
19. Walpole M, Wilder L:Disentangling the Links between Conservation and Poverty Reduction in Practice.Oryx2008,42(4):539–547.
20. Leisher C, Sanjayan M, Blockhus J, Kontoleon A, Larsen SN:Does conserving biodiversity work to reduce poverty? A state of knowledge review.The Nature Conservancy, University of Cambridge, and International Institute for Environment and Development (IIED); 2010.
21. Vira B, Kontoleon A:Dependence of the poor on biodiversity: which poor, what biodiversity? A State of Knowledge Review.InLinking Biodiversity Conservation and Poverty Alleviation: A State of Knowledge Review.Edited by Roe D. Montreal: Secretariat of the Convention on Biological Diversity; 2010:13–28.
22. World Bank:World Development Report 2000/2001: Attacking Poverty.
Washington DC: World Bank; 2001:15.
23. Barrett CB, Travis AJ, Dasgupta P:On biodiversity conservation and poverty traps.PNAS2011,108(34):13907–13912.
24. Ferraro PJ:Counterfactual thinking and impact evaluation in environmental policy.New Directions for Evaluation2009,122:75–84. 25. Roe D, Elliott J, Sandbrook C, Walpole M:Biodiversity Conservation and
Poverty Alleviation: Exploring the Evidence for a Link.Chichester: Wiley-Blackwell; 2013.
26. Holmes G, Brockington D:Protected areas - what people say about well-being.InBiodiversity Conservation and Poverty Alleviation: Exploring the Evidence for a Link.Edited by Roe. Chichester: Wiley-Blackwell; 2013:160–173. 27. Fazey I, Fazey JA,et al:The nature and role of experiential knowledge for
environmental conservation.Environmental Conservation2006,33:1–10. 28. Sandbrook C:Biodiversity, Ecosystem Services and Poverty Alleviation: What
constitutes good evidence?Poverty and Conservation Learning Group Discussion Paper. London: International Institute for Environment and Development; 2013.
29. SciVerse Scopus.http://www.scopus.com/. 30. Web of knowledge.http://wok.mimas.ac.uk/.
31. Poverty and Conservation; The information portal of the Poverty and Conservation Learning Group.www.povertyandconservation.info. 32. Poverty/Conservation organisations.http://povertyandconservation.info/
en/organisations.
33. Bibliography.http://povertyandconservation.info/en/bibliographies.
34. Edwards P, Clarke M, DiGuiseppi C, Pratap S, Roberts I, Wentz R:Identification of randomized controlled trials in systematic reviews: accuracy and reliability of screening records.Stat Med2002,21:1635–1640. 35. Collaboration for Environmental Evidence:Guidelines for Systematic
Review and Evidence Synthesis in Environmental Management. Version 4.2. Environmental Evidence. 2013. http://www.environmentalevidence. org/Documents/Guidelines.pdf page 34.
doi:10.1186/2047-2382-2-8
Cite this article as:Roeet al.:A systematic map protocol: which components or attributes of biodiversity affect which dimensions of poverty?.Environmental Evidence20132:8.
Submit your next manuscript to BioMed Central and take full advantage of:
• Convenient online submission
• Thorough peer review
• No space constraints or color figure charges
• Immediate publication on acceptance
• Inclusion in PubMed, CAS, Scopus and Google Scholar
• Research which is freely available for redistribution