R E S E A R C H
Open Access
A study of ghrelin and leptin levels and
their relationship to metabolic profiles in
obese and lean Saudi women with
polycystic ovary syndrome (PCOS)
Maha H. Daghestani
1, Mazin Daghestani
2, Mamoon Daghistani
3, Akmal El-Mazny
4, Geir Bjørklund
5,
Salvatore Chirumbolo
6, Samar H. Al Saggaf
7and Arjumand Warsy
8*Abstract
Background:Polycystic ovary syndrome (PCOS) is considered as one of the most frequently encountered hormonal pathologies in women during their reproductive years. Leptin and ghrelin, peptide hormones with adipostatic and orexigenic effect, respectively, seem to be involved in the metabolic changes that occur in PCOS. The aim of this study was to determine serum ghrelin and leptin levels in obese and lean Saudi women with PCOS and to investigate their relationship to the metabolic profiles in these women.
Methods:This study was conducted as a prospective, observational, cross-sectional, case-control study, at the Department of Obstetrics and Gynecology, Al-Noor Hospital, Makkah, Kingdom of Saudi Arabia. The study population included 252 women [130 women with PCOS (diagnosed according to the Rotterdam ESHRE/ASRM-Sponsored PCOS Consensus, 2003) and 122 normo-ovulatory women as matched controls] attending the outpatient Gynecology Clinic. Demographic details were recorded, blood was extracted following overnight fast and serum was used for the determination of serum ghrelin and leptin levels and other hormonal and biochemical parameters including total cholesterol, triglycerides, high-density lipoprotein (HDL) cholesterol, low-density lipoprotein (LDL) cholesterol, glucose, and insulin. Insulin resistance and sensitivity were calculated as HOMA-IR and HOMA-S.
Results:No significant differences in ghrelin (P= 0.1830) and leptin (P= 0.8329) levels were detected between the PCOS and control groups. However, ghrelin levels were significantly lower; and leptin levels were significantly higher in obese PCOS patients in comparison with lean patients (P= 0.0001 for both). In the PCOS group, there were significant correlations between ghrelin and leptin levels with Body Mass Index (BMI), waist-hip ratio, total cholesterol, triglycerides, HDL, LDL and insulin levels. Multiple regression analysis demonstrated that insulin was the main determinant for ghrelin (R2= 0.316) and leptin (R2= 0.352) levels (P= 0.0001 for both).
Conclusions:Although serum ghrelin and leptin levels were found to be normal in women with PCOS; yet, there is a relationship, possibly linked to obesity, hyperinsulinemia and insulin resistance between these levels and metabolic profile of Saudi PCOS.
Keywords:Polycystic ovary syndrome, Ghrelin, Leptin, Insulin, insulin resistance
* Correspondence:aswarsy@ksu.edu.sa
8Central Laboratory, Female Center for Scientific and Medical Colleges, King
Saud University, Riyadh, Saudi Arabia
Full list of author information is available at the end of the article
Background
In 1935, Stein and Leventhal first described polycystic ovary syndrome (PCOS) in seven women suffering from amenorrhea, enlarged ovaries with multiple cysts, and hirsutism [1]. Currently, PCOS is considered as one of the most frequently encountered hormonal pathologies in women during their reproductive years, occurring in most populations of the World [2, 3] and prevalence as high as 15–20% has been reported in some studies [4]. It is a heterogeneous complex genetic trait of multifactorial nature where both genetic and environmental factors contribute to the underlying pathophysiological mecha-nisms [5]. It has drawn significant attention as it is con-sidered as a major cause of anovulatory infertility in women of childbearing age, and is the cause of several other complications including endocrine, metabolic, hemostatic and hepatic derangements [6, 7]. These re-cent studies have highlighted the association between PCOS and metabolic syndrome, obesity, insulin resist-ance, cardiovascular diseases and liver diseases including cirrhosis, liver tumors and fatty liver [6,8].
Obesity is considered as one of the major factor pre-disposing to the development of PCOS, since 35-80% of the women suffering from PCOS are reported to be overweight or obese [9–12]. However, it is not the only factor, since many PCOS patients are lean [13,14]. Type 1 and Type 2 diabetes mellitus, and gestational diabetes have been associated with an increased prevalence of
PCOS [15]. Some studies have implicated leptin and
ghrelin as possible factors contributing to the develop-ment of PCOS, while others have failed to do so [16– 19]. Leptin, a polypeptide hormone, functions as an adi-postatin, where it suppresses food intake and activates catabolic pathways associated with increased energy pro-duction [20,21]. It also plays a role in improving the in-sulin sensitivity of the peripheral tissues and affects beta-cell functions. Leptin signaling is involved in obes-ity and its cardiovascular complications [22]. It also af-fects reproductive functions at many levels, where it is shown to inhibit folliculogenesis, influences embryo im-plantation and endometrial receptivity [23–25]. Since obesity is associated with hyperleptinaemia, the situation in obese PCOS becomes more complex [25,26]. Ghrelin, another peptide hormone, has an orexigenic effect [27]. It also stimulates growth hormone secretion, regulates glucose metabolism, appetite, body weight, endocrine pancreatic, and ovarian functions [28, 29]. It exhibits a negative correlation with androstenedione, and in obese women with PCOS, it may contribute to modification of factors such as insulin resistance and androgens, hence producing a negative effect on fertility [12]. Ghrelin levels are shown to be lower in PCOS, and this decrease has been associated with the negative correlation shown
between body mass index (BMI) and ghrelin [30].
Several studies show contradictory results in the level of ghrelin in PCOS patients, where lower ghrelin levels have been reported in some studies, while others report that there was no change in ghrelin level in PCOS, [4,5,
31, 32]. An earlier study from our group, on a smaller number of Saudi PCOS patients, failed to show the ex-istence of hypoghrelinaemia [19].
Several metabolic and hormonal dysfunctions exist in patients suffering from PCOS, and these include insulin resistance, glucose intolerance, and dyslipidemia [33, 34]. Hyperinsulinaemia is frequently reported in PCOS and may be involved in anovulation, by causing premature maturation of granulosa cells, inhibition of granulosa cell proliferation and development in the presence of elevated LH levels [35]. Furthermore, some studies have shown that insulin resistance and neuroendocrine dysfunctions play a significant role in the pathogenesis of PCOS [36].
In Saudi females, PCOS occurs frequently, but the exact prevalence is not known. Some recent studies have reported variations in the levels of metabolic and hor-monal parameters [19]. However, more extensive studies are warranted, in order to achieve a clearer picture of the disease and to identify further underlying etiological factors contributing to the development of PCOS in the Saudi population.
We designed this study as a case-control study on Saudi PCOS patients in an attempt to determine leptin and ghrelin levels and to investigate the type of relation-ship that exists between these hormones and anthropo-metric, metabolic and hormonal parameters. The study was conducted in two stages, where initially (stage 1) the results in the PCOS were compared to the control group and in the stage 2, a comparison was made between the lean and obese PCOS. This paper reports the findings of this study in Saudi Arabia and compares the results with those reported for other populations.
Methods
Subject recruitment and type of study
The present investigation was conducted as a prospect-ive, observational, cross-sectional, case-control study at the Department of Obstetrics and Gynecology, Al-Noor Hospital, Makkah, Kingdom of Saudi Arabia. The local Ethical Committee approved the study protocol (Review Board (IRB) at the Umm Al Qura University, Makkah Al Mukaramah, Saudi Arabia (IRB No. 235) and 252 fe-males, who were attending the outpatient Gynecology Clinic, were enrolled in the present investigation, after taking their informed consent.
(1) Oligo- and/or anovulation; confirmed by luteal progesterone and normal serum FSH levels (normal range: 1.0–10.0 mIU/ml).
(2) Clinical and/or biochemical signs of raised androgens; elevated serum androgen levels (total testosterone > 2 nmol/l), and/or androstenedione > 0.15 nmol/l, and/or dehydroepiandrosterone sulphate (DHEAS) > 10 mmol/l); LH to FSH ratio > 2.
(3) Ultrasound criterion of PCOS; at least one ovary containing > 12 follicles measuring 2–9 mm in diameter and/or increase in the ovarian volume to at least 10 ml [4,37].
The control group consisted of 121 normo-ovulatory women with male, tubal or unexplained infertility. They had regular ovulatory cycles (25–35 days), no endocrine abnormalities, no clinical or biochemical signs of raised androgens, and normal ultrasonic ovarian morphology. The control women were matched with PCOS patients for age (± 2 years SD) and body mass index, BMI (± 10%).
Exclusion criteria for all the subjects included preg-nancy, hypothyroidism, hyperprolactinemia, Cushing’s syndrome, congenital adrenal hyperplasia, current or pre-vious (within the last 6 months) use of oral contraceptives,
glucocorticoids, antiandrogens, ovulation induction
agents, antidiabetic and anti-obesity drugs or other hor-monal pharmaceuticals. None of the patients was affected by neoplastic, metabolic and cardiovascular disorder or other concurrent medical illness such as diabetes, renal disease, and hepatic disorders. All the subjects were non-smokers and had normal physical activity.
Anthropometric measurements
For each woman weight and height were measured and the BMI (weight in kg divided by height in m2) were cal-culated. Considering our anthropometric local data on the Saudi female population, patients with a BMI > 27 kg/m2
were considered obese, and those with a BMI ≤27 were
considered lean. Waist circumference (the narrowest cir-cumference between the lower costal margins and the iliac crest) and hip circumference (the maximum circumfer-ence at the level of the femoral trochanters) were also measured in the standing position to calculate the waist-hip ratio (WHR).
Biochemical measurements
A peripheral venous blood sample was extracted in the morning after overnight fasting. During the early follicu-lar phase (2nd or 3rd day), 5 ml of blood was drawn in plain red-top tubes for serum on which the determin-ation of leptin, cholesterol, triglyceride, HDL-C, LDL-C, insulin levels was accomplished within the next 4 h (max) following the blood withdrawal. Two ml of blood were collected into chilled tubes containing 1.2 mg
EDTA and aprotinin (500 KIU/ml; Trasylol; Bayer Corp., Leverkusen, Germany) for total ghrelin levels and 2 ml were drawn in fluoride tubes (gray top) for glucose esti-mation. All blood samples for each woman were imme-diately centrifuged, and the serum or plasma was stored at−80 °C until further analysis.
The basal serum levels of insulin were estimated using
the electrochemiluminescence immunoassay“ECLlA”on
a Roche Elecsys 1010/2010 and Modular Analytics E170 (Elecsys module) immunoassay analyzers (Roche Diag-nostic, Mannheim, Germany). Total ghrelin levels were measured in duplicate using a commercial ghrelin (human)-enzyme immunoassay kit (EIA) from Phoenix Pharmaceuticals, Inc.,(Belmont, CA, USA), with a lower limit of detection of 0.06 ng/ml. Plasma glucose levels were determined by the glucose oxidase method on a Beckman Glucose Analyzer (Fullerton, CA). Lipids were determined on an autoanalyzer for clinical chemistry in the hospital.
Homeostatic model assessment of insulin resistance (HOMA-IR) and insulin secretion were calculated using the following formulas:
Insulin resistance¼FIG
22:5 Insulin secretion¼ 20FI
G‐3:5
HOMA-IR = Fl X G/ 22.3 HOMA-S = 20 X-FI/G-3.5
Where FI is fasting insulin and G is fasting glucose.
Statistics
Data was collected and entered into a spreadsheet, to evaluate their organization and inference with proper statistical assays, where all analyses were performed using Statistical Package for the Social Science, version 22 (SPSS; Inc., Chicago, IL, USA). Results were expressed as mean ± SD and compared using ANOVA in a student’s t-test or a Wilcoxon-Mann-Whitney U-test when appropriate, following a Shapiro-Wilk test for nor-mality. Correlations between ghrelin, leptin, HOMA-IR and HOMA-S levels and the anthropometric measure-ments, lipid, and hormonal parameters were performed and evaluated using Pearson correlation coefficient (r).
Multiple regression analysis was used to evaluate the preferential effect of the different studied variables on
ghrelin, leptin, HOMA-IR and HOMA-S levels. Ap-value
< 0.05 was considered statistically significant. Data from this study were also approached to build up a ROC curve analysis for the determination of the best suited predictive marker of PCOS in obese Saudi women.
Results
Anthropometric data and metabolic profile of patients
with PCOS and controls are summarized in Table 1.
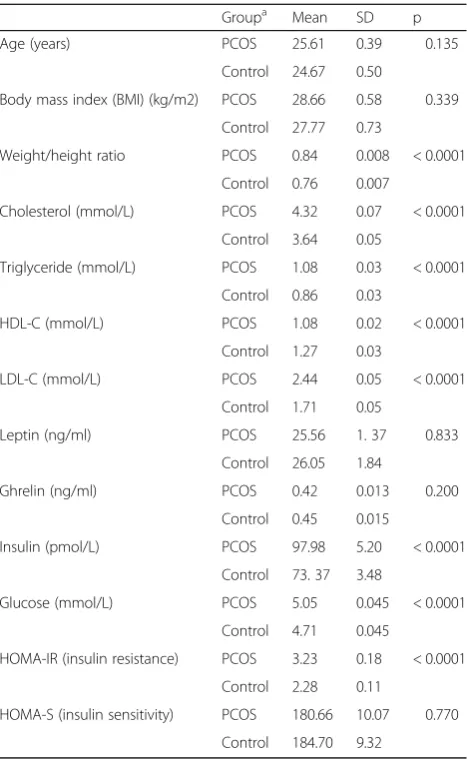
groups. In the PCOS group, the WHR, cholesterol, triglyceride, LDL-C and insulin levels were significantly higher and HDL-C levels were significantly lower in comparison with the control group (p< 0.0001). Insulin resistance as indicated by the higher HOMA-IR was significantly more in the PCOS compared to the con-trols, but the insulin secretion as judged from the value of HOMA-S was not different between the two groups.
The lean and obese PCOS and control were separated, and all the parameter values were recalculated and com-pared to the PCOS (either lean or obese) patients and controls. The results are presented in Table2.
When the lean PCOS were compared with the obese PCOS, all studied parameters including leptin, ghrelin, and HOMA-IR, except HDL level and HOMA-S showed
statistically significant differences. However, this differ-ence was not statistically significant when all PCOS pa-tients were compared with controls. On the other hand, all the parameters were different statistically when the lean control values were compared with the values ob-tained in the obese controls, as shown in Table 2. The differences were still significant statistically when the values in lean PCOS were compared to the lean control, except for HOMA-S, which did not differ significantly. However, when the values in obese PCOS were com-pared to the values in obese control, certain parameters lost the significant difference. These included BMI, HDL-C, leptin, ghrelin, insulin and HOMA-S.
Table 2 shows leptin and ghrelin levels in lean and
obese patients with PCOS compared to controls. Ghrelin levels were significantly lower, and leptin levels were significantly higher in obese patients with PCOS and obese controls in comparison with lean patients with PCOS and lean controls (P< 0.0001 for each). Likewise, ghrelin levels were significantly lower
(P= 0.0249), and leptin levels were significantly
higher (P= 0.0019) in lean patients with PCOS in
comparison with lean controls. However, there was no statistically significant difference in ghrelin levels (P= 0.767) and leptin levels (P= 0.181) in obese pa-tients with PCOS and obese controls.
Correlation of leptin levels to the clinical and meta-bolic profile of patients with PCOS and controls is pre-sented in Table 3. In the PCOS group, leptin levels did not correlate with age and glucose levels, however, there was a significant positive correlation with BMI, WHR, cholesterol, triglyceride, LDL-C and insulin levels and a significant negative correlation with HDL-C and ghrelin levels. In the control group, there was only a significant positive correlation with BMI and insulin levels; and a significant negative correlation with ghrelin levels while other parameters did not correlate with leptin levels. Multiple regression analysis demonstrated that insulin was the primary determinant of leptin level in the PCOS group (R2= 0.352;P= 0.0001).
Correlation of ghrelin levels to the clinical and meta-bolic profile of patients with PCOS and controls is pre-sented in Table4. In the PCOS group, ghrelin levels did not correlate with age and glucose levels; however, there was a significant negative correlation with BMI, WHR, cholesterol, triglyceride, LDL-C, insulin, leptin levels, HOMA-IR and HOMA-S; and a significant positive cor-relation with HDL-C levels. In the control group, only a significant negative correlation with BMI, insulin, leptin levels and HOMA-IR and HOMA-S was observed, while other parameters did not correlate with ghrelin levels. Multiple regression analysis demonstrated that insulin was the primary determinant of ghrelin level in the PCOS group (R2= 0.316;P< 0.0001).
Table 1Comparison of anthropometric measurements and metabolic profile of patients with polycystic ovary syndrome (POCS) and normal healthy females
Groupa Mean SD p
Age (years) PCOS 25.61 0.39 0.135
Control 24.67 0.50
Body mass index (BMI) (kg/m2) PCOS 28.66 0.58 0.339
Control 27.77 0.73
Weight/height ratio PCOS 0.84 0.008 < 0.0001
Control 0.76 0.007
Cholesterol (mmol/L) PCOS 4.32 0.07 < 0.0001
Control 3.64 0.05
Triglyceride (mmol/L) PCOS 1.08 0.03 < 0.0001
Control 0.86 0.03
HDL-C (mmol/L) PCOS 1.08 0.02 < 0.0001
Control 1.27 0.03
LDL-C (mmol/L) PCOS 2.44 0.05 < 0.0001
Control 1.71 0.05
Leptin (ng/ml) PCOS 25.56 1. 37 0.833
Control 26.05 1.84
Ghrelin (ng/ml) PCOS 0.42 0.013 0.200
Control 0.45 0.015
Insulin (pmol/L) PCOS 97.98 5.20 < 0.0001
Control 73. 37 3.48
Glucose (mmol/L) PCOS 5.05 0.045 < 0.0001
Control 4.71 0.045
HOMA-IR (insulin resistance) PCOS 3.23 0.18 < 0.0001
Control 2.28 0.11
HOMA-S (insulin sensitivity) PCOS 180.66 10.07 0.770
Control 184.70 9.32
Groupa
= PCOS- 130; Control- 122
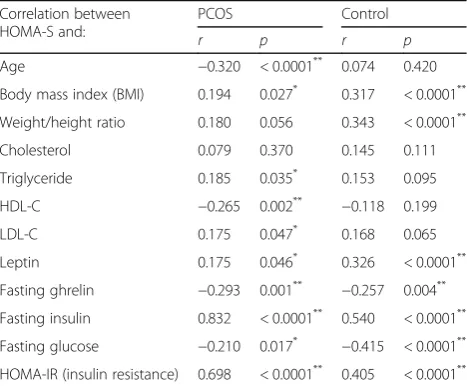
The HOMA-IR and HOMA-S were correlated with the clinical and biochemical parameters, and the results are presented in Tables5and6, respectively.
ROC analysis of PCOS patients either without or with obesity diagnosis (lean) for all the parameters investi-gated and the relative values are shown respectively in Additional file 1: Figures S1, S2 and S3 and Additional file2: Tables S1, S2 and S3.
Discussion
The results of this study showed that the PCOS group had significantly higher levels of insulin, insulin resist-ance, glucose, all plasma lipids except HDL-C, com-pared to the healthy controls, while insulin secretion was not different. Among the anthropometric variables, the two groups were very similar and only differed in
the WHR ratio, which was significantly higher in the PCOS patients.
The abnormalities in lipid, insulin, and HOMA-IR, seen in this study confirm previous reports, which show that PCOS patients have altered lipidograms with high LDL-C, most probably due to the insulin resistance phenotype and altered BMI, rather than circulating androgen levels [38]. This evidence might recall some recent data on Bra-zilian adolescent women, where the existence of more than one risk factor for type 2 diabetes mellitus showed a
high HOMA-IR and a low HOMA-S [39].
Both leptin and ghrelin did not show any differences between the two groups. Hence, our findings could not confirm the earlier reports by Mitkov et al. [17] and Pehlivanov et al. [18] and other researchers [19, 20,22], who reported an elevated level of leptin in PCOS
Table 2Comparison of the anthropometric measurements and metabolic profile of lean and obese patients with polycystic ovary syndrome (POCS) and lean and obese controls
Parameter Patient Group Mean SD p1 Control Group Mean SD p2 p3
Age (years) Lean 26.05 0.63 0.131 Lean 23.95 0.60 0.231 0.018
Obese 27. 24 0.48 Obese 25.14 0.79 0.028
Body mass index (BMI) (kg/m2) Lean 22.86 0.20 0.0001 Lean 20.85 0. 24 < 0.0001 < 0.0001
Obese 33.64 0.62 Obese 34.47 0.72 0.387
Weight/height ratio Lean 0.79 0.01 0.0001 Lean 0.71 0.006 < 0.0001 < 0.0001
Obese 0.88 0.01 Obese 0.81 0.007 < 0.0001
Cholesterol (mmol/L) Lean 3.91 0.06 0.0001 Lean 3.42 0.05 < 0.0001 < 0.0001
Obese 4.68 0.11 Obese 3.86 0.07 < 0.0001
Triglyceride (mmol/L) Lean 0.93 0.05 0.0001 Lean 0.68 0.029 < 0.0001 < 0.0001
Obese 1.21 0.05 Obese 1.04 0.057 0.025
HDL-C (mmol/L) Lean 1.04 0.04 0.132 Lean 1.44 0.040 < 0.0001 < 0.0001
Obese 1.11 0.04 Obese 1.12 0.038 0.945
LDL-C (mmol/L) Lean 2.20 0.04 0.0001 Lean 1.31 0.048 < 0.0001 < 0.0001
Obese 2.65 0.09 Obese 2.11 0.078 < 0.0001
Leptin Lean 13.65 0.40 0.0001 Lean 11.70 0.464 < 0.0001 < 0.0001
Obese 35.78 1.78 Obese 39.94 2.59 0.181
Fasting ghrelin Lean 0.53 0.02 0.0001 Lean 0.57 0.016 < 0.0001 0.025
Obese 0.33 0.01 Obese 0.33 0.014 0.767
Fasting insulin (pmol/L) Lean 86.67 8.20 0.04 Lean 52.57 02.28 < 0.0001 < 0.0001
Obese 107.68 6.45 Obese 93.51 5. 37 0.094
Fasting Glucose (mmol) Lean 4.93 0.05 0.014 Lean 4.53 0.051 < 0.0001 < 0.0001
Obese 5.15 0.07 Obese 4.88 0.066 0.007
HOMA-IR (insulin resistance) Lean 2.807 0.27 0.034 Lean 1.49 0.070 < 0.0001 < 0.0001
Obese 3.492 0. 25 Obese 2.88 0.177 0.05
HOMA-S (insulin secretion) Lean 164.80 16.64 0.146 Lean 161.06 10.62 0.013 0.850
Obese 194. 25 11.97 Obese 207.19 14.64 0.49
p1
= significance of the difference between lean and obese PCOS p2= significance of the difference between lean and obese control p3
patients. As a matter of fact, controversial results have been reported for serum leptin levels in PCOS patients, where both high concentrations and unchanged levels have been documented in different studies, though novel parameters, such as the ratio adiponectin/leptin, appear to be more promising to associate PCOS with serum circu-lating adipokines [4, 40, 41]. These controversial results
have been explained by differences in age, anthropometric differences, genetics and disease severity [42,43].
Leptin has a dual effect on reproduction, where ele-vated levels of this hormone may have a pathophysio-logical role in the development of PCOS. A positive effect of leptin is in its role as a trigger of puberty on a hypothalamic-pituitary axis by stimulating estrogen
Table 3Correlation between leptin levels and clinical and metabolic profile of patients with polycystic ovary syndrome (POCS) and healthy controls
Correlation of leptin levels and
PCOS (n= 130) Control (n= 122)
r p r p
Age 0.092 0.2979 0.045 0.6226
Body mass index (BMI) 0.289 0.0009** 0.187 0.0392*
Weight/height ratio 0.213 0.0150* 0.096 0.2929
Cholesterol 0.204 0.0199* 0.043 0.6382
Triglyceride 0.175 0.0464* 0.024 0.7930
HDL-C −0.202 0.0212* 0.037 0.6858
LDL-C 0.235 0.0071* 0.049 0.5920
Glucose 0.135 0.1257 0.121 0.1843
Insulin 0.382 0.0001** 0.254 0.0048*
Ghrelin −0.251 0.0040* −0.248 0.0059*
HOMA-IR (insulin resistance) 0.316 0.0001** 0.611 < 0.0001**
HOMA-S 0.175 0.046* 0.326 < 0.0001**
HOMAHomeostatic model assessment *Significant (p< 0.05)
**Highly significant (p< 0.001)
Table 4Correlation between ghrelin levels and clinical and metabolic profile of patients with polycystic ovary syndrome (POCS) and healthy controls
Correlation of ghrelin levels and
PCOS (n= 130) Control (n= 122)
r p r p
Age 0.108 0.2213 0.118 0.1955
Body mass index (BMI) −0.292 0.0007** −0.196 0.0305*
Weight/height ratio −0.209 0.0170* 0.114 0.2112
Cholesterol −0.215 0.0140* 0.048 0.5996
Triglyceride −0.199 0.0232* 0.019 0.8354
HDL-C 0.207 0.0181* 0.021 0.8184
LDL-C −0.229 0.0088* 0.071 0.4371
Glucose 0.129 0.1435 0.109 0.2320
Insulin −0.347 0.0001** −0.251 0.0053*
Leptin −0.251 0.0040* −0.248 0.0059*
HOMA-IR (insulin resistance) −0.279 0.001** −0.637 < 0.0001**
HOMA-S (insulin secretion) −0.293 0.001** −0.257 0.004**
HOMAHomeostatic model assessment *Significant (p< 0.05)
**Highly significant (p< 0.001)
Table 5Correlation of homeostatic model assessment for insulin resistance (HOMA-IR) and the clinical and metabolic profile of patients with polycystic ovary syndrome (POCS) and healthy controls
Correlation between HOMA-IR and:
PCOS Control
r p r p
Age −0.183 0.038* 0.144 0.115
Body mass index (BMI) 0.342 0.0001** 0.634 < 0.0001**
Weight/height ratio 0.212 0.024* 0.518 < 0.0001**
Cholesterol 0.168 0.057 0.382 < 0.0001**
Triglyceride 0.325 0.0001** 0.350 < 0.0001**
HDL-C −0.210 0.016* −0.389 < 0.0001**
LDL-C 0.268 0.002** 0.529 < 0.0001**
Leptin 0.316 0.0001** 0.611 < 0.0001**
fasting ghrelin −0.279 0.001** −0.637 < 0.0001**
Fasting insulin 0.970 0.0001** 0.984 < 0.0001**
Fasting glucose 0.463 0.0001** 0.560 < 0.0001**
HOMA-S (insulin secretion) 0.698 0.0001** 0.405 < 0.0001**
*Significant (p< 0.05) ** Highly Significant (p< 0.001)
Table 6Correlation of homeostasis model assessment of insulin sensitivity (HOMA-S) and the clinical and metabolic profile of patients with polycystic ovary syndrome (POCS) and healthy controls
Correlation between HOMA-S and:
PCOS Control
r p r p
Age −0.320 < 0.0001** 0.074 0.420
Body mass index (BMI) 0.194 0.027* 0.317 < 0.0001**
Weight/height ratio 0.180 0.056 0.343 < 0.0001**
Cholesterol 0.079 0.370 0.145 0.111
Triglyceride 0.185 0.035* 0.153 0.095
HDL-C −0.265 0.002** −0.118 0.199
LDL-C 0.175 0.047* 0.168 0.065
Leptin 0.175 0.046* 0.326 < 0.0001**
Fasting ghrelin −0.293 0.001** −0.257 0.004**
Fasting insulin 0.832 < 0.0001** 0.540 < 0.0001**
Fasting glucose −0.210 0.017* −0.415 < 0.0001**
HOMA-IR (insulin resistance) 0.698 < 0.0001** 0.405 < 0.0001**
secretion, and the negative impact of leptin, in condi-tions such as hyperleptinemia, is the inhibition of the ovarian response to gonadotrophin stimulation [44].
When the obese PCOS patients were separated from the lean PCOS patients, and the results were compared with the obese and lean controls, respectively, the lean PCOS had all parameters significantly different com-pared to the lean controls except for HOMA-S. On the other hand, when the obese PCOS were compared to the obese control, the significant differences were lost between the two groups in BMI, leptin, ghrelin, insulin, HDL-C and HOMA-S, but the differences persisted in all the lipids, in glucose level and insulin resistance.
These results demonstrate that PCOS is associated with hyperinsulinemia, insulin resistance and elevated glucose and lipids, but as the BMI increases the differences in lep-tin, ghrelin, insulin, HDL-C, and insulin secretion are lost, indicating that BMI, plays a major role in relating to these abnormalities even in the control group.
Several interesting correlations were identified when ghrelin, leptin, HOMA-IR and HOMA-S levels were cor-related with the biochemical and hormonal parameters in the PCOS patients and controls. The association between leptin and the lipids were significant in the PCOS, but not in the controls. These results indicate very clearly that even though leptin levels do not differ between the PCOS and controls, but the leptin levels significantly correlate with elevating lipids, insulin, ghrelin, insulin resistance and insulin secretion. The findings of the present study confirm the result of previous studies, which have shown a significant correlation between WHR with leptin in the PCOS patients [45, 46]. This supports the importance of abdominal fat mass in the secretion of leptin and hence in the resulting lipid abnormalities which exist in the PCOS. Ghrelin correlated with the same parameters as leptin, ex-cept that the correlations were inverse. The WHR was sig-nificantly higher in the PCOS group, both lean and obese group compared to the counterpart control groups. These results further confirm the importance of the abdominal fat in PCOS.
Insulin resistance is a frequent finding in PCOS and the PCOS patients in this study had higher levels of HOMA-IR compared to the control group. Correlation studies between HOMA-IR and the clinical and biochem-ical parameters showed several correlations in both pa-tients and controls, except between HOMA-IR and cholesterol in the patient group, there was no relationship. These results indicate that insulin resistance plays a sig-nificant role in the associated hormonal and biochemical abnormalities observed in PCOS patients [10,47–49].
Insulin secretion as judged from the level of HOMA-S did not differ between the PCOS patients and controls
(p> 0.05), and comparison between PCOS lean and
obese females did not show any significance (Table2).
This study is important as it has highlighted several dif-ferences in the results of Saudi PCOS patients compared to studies reported in literature. It has also shown signifi-cant differences between the obese and lean PCOS pa-tients. Though this study has covered several parameters, the major limitation of this study is that coagulation parameters and liver functions were not investigated, and hence the findings of previous studies, related to these parameters, could not be confirmed in Saudis.
Further studies are warranted on a larger group of PCOS patients in an attempt to confirm the role of liver disorders and coagulation parameter abnormalities in the pathogenesis of PCOS in Saudi patients.
Conclusion
This study investigated the relationship between leptin and ghrelin in PCOS-affected Saudi women and showed that leptin is probably associated with lipidograms (particularly with chol-LDL) in PCOS patients, as ex-pected, but that the difference in serum adipokines levels between lean and obese female with PCOS, is no more significant, most probably due to an interference of
insulin level and HOMA indexes [50–58]. It may be
concluded that leptin or ghrelin levels in the serum are associated with insulin metabolism and insulin resist-ance and the lipidogram pattern and BMI is a conse-quence of the insulin metabolic impairment. This evidence is supported by the interesting data from HOMA-S.
Additional files
Additional file 1:Figure S1.ROC-Curve of all the investigated parameters in PCOS patients.Figure S2.ROC-Curve of all the investigated parameters in lean PCOS patients.Figure S3.ROC-Curve of all the investigated parameters in Obese PCOS patients. (DOCX 403 kb)
Additional file 2:Table S1.ROC-Curve of all the investigated parameters in PCOS-Lean patients.Table S2.ROC-Curve of all the investigated parameters in PCOS-Obese patients.Table S3.ROC-Curve of all the investigated parameters in all PCOS patients. (DOCX 20 kb)
Abbreviations
BMI:Body Mass Index; DHEAS ESHR and E/ASRM: Embryology/American Society for Reproductive Medicine; ECLlA: electrochemiluminescence immunoassay; FI: Fasting Insulin; G: Glucose; HDL: high-density lipoprotein; IR: Homeostatic model assessment of insulin resistance; HOMA-S: Homeostatic model assessment of insulin secretion; LDL: low-density lipoprotein; PCOS: polycystic ovary syndrome; ROC: Receiver Operator characteristic curve; SEM: Standard error of the mean
Acknowledgements
The authors extend their appreciation to the Deanship of Scientific Research at King Saud University for funding the work through the research group project No. RGP-VPP-068.
Funding
Availability of data and materials
All data is available with the authors and can be provided when required.
Authors’contributions
MD and AW designed the experiment. MD1 carried all the experiments MD, MD and AKM recruited the subjects/samples of the study. AW, GB and SC performed the statistical analysis. MD and AW prepared the tables and drafted the manuscript. GB and SC participated in the manuscript revision. All authors read and approved the final manuscript.
Ethics approval and consent to participate
The ethical approval for this study was obtained from the local Institutional Review Board (IRB) at the Umm Al Qura University, Makkah Al Mukaramah, Saudi Arabia (IRB No. 235). Written informed consent was obtained from all study subjects before their participation.
Consent for publication
All authors agree to the contents of the manuscript and approved the submission.
Competing interests
The authors declare no conflicts of interest, state that the manuscript has not been published or submitted elsewhere, state that the work complies with Ethical Policies of the Journal and the work has been conducted under internationally accepted ethical standards after relevant ethical review.
Publisher’s Note
Springer Nature remains neutral with regard to jurisdictional claims in published maps and institutional affiliations.
Author details
1Department of Zoology, King Saud University, Riyadh, Saudi Arabia. 2
Department of Obstetrics and Gynecology, Umm Al-Qura University, Makkah, Saudi Arabia.3Department of Surgery, King Abdulaziz Medical City, National Guard Health Affairs, Jeddah, Saudi Arabia.4Department of Obstetrics and Gynecology, College of Medicine, University of Cairo, Kasr Al-ainy, Cairo, Egypt.5Council for Nutritional and Environmental Medicine, Mo i Rana, Norway.6Department of Neurological and Movement Sciences, University of Verona, Verona, Italy.7Department of Anatomy, College of Medicine, King Abdulaziz University, Jeddah, Saudi Arabia.8Central Laboratory, Female Center for Scientific and Medical Colleges, King Saud University, Riyadh, Saudi Arabia.
Received: 21 March 2018 Accepted: 31 July 2018
References
1. Stein IF, Leventhal ML. Amenorrhea associated with bilateral polycystic ovaries. Am J Obstet Gynecol. 1935;29:181–91.
2. McGowan MP. Polycystic ovary syndrome: a common endocrine disorder and risk factor for vascular disease. Curr Treat Options Cardiovasc Med. 2011;13:289–301.https://doi.org/10.1007/s11936-011-0130-0. 3. Sirmans SM, Pate KA. Epidemiology, diagnosis, and management of
polycystic ovary syndrome. Clin Epidemiol. 2014;6:1–13.https://doi.org/10. 2147/CLEP.S37559.
4. Rotterdam ESHRE/ASRM-Sponsored PCOS Consensus Workshop Group. Revised 2003 consensus on diagnostic criteria and long-term health risks related to polycystic ovary syndrome. Fertil Steril. 2004;81:19–25. 5. Farquhar C. Introduction and history of polycystic ovary syndrome.
In: Kovacs G, Norman R, editors. Polycystic ovary syndrome. 2nd ed. Cambridge: Cambridge University Press; 2007. p. 4–24.
6. Targher G, Rossini M, Lonardo A. Evidence that non-alcoholic fatty liver disease and polycystic ovary syndrome are associated by necessity rather than chance: a novel hepato-ovarian axis? Endocrine. 2016;51(2):211–21.
https://doi.org/10.1007/s12020-015-0640-8. Epub 2015 May 30 7. Targher G, Zoppini G, Bonora E, Moghetti P. Hemostatic and fibrinolytic
abnormalities in polycystic ovary syndrome. Semin Thromb Hemost. 2014; 40(5):600–18.https://doi.org/10.1055/s-0034-1384512. Epub 2014 Jul 7 8. Polak K, Czyzyk A, Simoncini T, Meczekalski B. New markers of insulin
resistance in polycystic ovary syndrome. J Endocrinol Investig. 2017;40(1):1–8.
https://doi.org/10.1007/s40618-016-0523-8. Epub 2016 Jul 29
9. Hahn S, Tan S, Sack S, Kimmig R, Quadbeck B, Mann K, et al. Prevalence of the metabolic syndrome in German women with polycystic ovary syndrome. Exp Clin Endocrinol Diabetes. 2007;115:130–5.
10. Azziz R, Sanchez LA, Knochenhauer ES, Moran C, Lazenby J, Stephens KC, et al. Androgen excess in women: experience with over 1000 consecutive patients. J Clin.Endocrinol Metab. 2004;89:453–62.
11. Cupisti S, Kajaia N, Dittrich R, Duezenli H, Beckmann MW, Mueller A. Body mass index and ovarian function are associated with endocrine and metabolic abnormalities in women with hyperandrogenic syndrome. Eur J Endocrinol. 2008;158:711–9.
12. Messinis IE, Messini CI, Anifandis G, Dafopoulos K. Polycystic ovaries and obesity. Best Pract Res Clin Obstet Gynaecol. 2015;29(4):479–88.https://doi. org/10.1016/j.bpobgyn.2014.11.001. E-Pub 2014 Nov 12.
13. Sam S. Obesity and polycystic ovary syndrome. Obes Manag. 2007;3:69–73. 14. Begum GS, Shariff A, Ayman G, Mohammad G, Housam R, Khaled N.
Assessment of risk factors for development of polycystic ovarian syndrome. Int J Contemporary Med Res. 2017;4:77–83.
15. Barber TM, Franks S. The link between polycystic ovary syndrome and both type 1 and type 2 diabetes mellitus. What do we know today? Womens Health (Lond). 2012;8:147–54.
16. Houjeghani S, Gargari BP, Farzadi L. Serum leptin and ghrelin levels in women with polycystic ovary syndrome: correlation with anthropometric, metabolic, and endocrine parameters. Int J Fertil Steril. 2012;6:117–2.
17. Mitkov M, Pehlivanov B, Orbetzova M. Serum ghrelin level in women with polycystic ovary syndrome and its relationship with endocrine and metabolic parameters. Gynecol Endocrinol. 2008;24:625–30.https://doi.org/ 10.1080/09513590802302233.
18. Pekhlivanov B, Mitkov M, Orbtsova M, Terzieva D. Serum levels of ghrelin and leptin in women with polycystic ovary syndrome. Akush Ginekol (Sofia). 2008;47:15–9.
19. Daghestani MH, Daghestani MH, El-Mazny A. Circulating ghrelin levels and the polycystic ovary syndrome: correlation with the clinical, hormonal and metabolic features. Eur J Obstet Gynecol Reprod Biol. 2011;155:65–8.https:// doi.org/10.1016/j.ejogrb.2010.11.019.
20. Friedman JM, Halaas JL. Leptin and the regulation of body weight in mammals. Nature. 1998;395:763–70.https://doi.org/10.1038/27376. 21. Monteiro MP, Batterham RL. The Importance of the Gastrointestinal Tract in
Controlling Food Intake and Regulating Energy Balance. Gastroenterology. 2017;152(7):1707–1717.e2. doi:https://doi.org/10.1053/j.gastro.2017.01.053. Epub 2017 Feb 11.
22. Yang R, Lili A. Barouch leptin signaling and obesity, cardiovascular consequences. Circ Res. 2007;101:545–9.
23. Duggal PS, Van Der Hoek KH, Milner CR, Ryan NK, Armstrong DT, Magoffin DA, et al. The in vivo and in vitro effects of exogenous leptin on ovulation in the rat. Endocrinology. 2000;141:1971–6.
24. Srivastava PK, Krishna A. Increased circulating leptin level inhibits folliculogenesis in vespertilionid bat, Scotophilus heathii. Mol Cell Endocrinol. 2011;337:24–35.
25. Brewer CJ, Balen AH. The adverse effects of obesity on conception and implantation. Reproduction. 2010;140:347–64.
26. Becker GF, Passos EP, Moulin CC. Short-term effects of a hypocaloric diet with low glycemic index and low glycemic load on body adiposity, metabolic variables, ghrelin, leptin, and pregnancy rate in overweight and obese infertile women: a randomized controlled trial. Am J Clin Nutr. 2015;102(6):1365–72.https://doi.org/10.3945/ajcn.115. 117200. Epub 2015 Nov 11
27. Wren AM, Small CJ, Ward HL, Murphy KG, Dakin CL, Taheri S, et al. The novel hypothalamic peptide ghrelin stimulates food intake and growth hormone secretion. Endocrinology. 2000;141:4325–8.
28. Sato T, Ida T, Nakamura Y, Shiimura Y, Kangawa K, Kojima M. Physiological roles of ghrelin on obesity. Obes Res Clin Pract. 2014;8:e405–13.https://doi. org/10.1016/j.orcp.2013.10.002.
29. Müller TD, Nogueiras R, Andermann ML, Andrews ZB, Anker SD, Argente J, et al. Ghrelin. Mol Metab. 2015;4:437–60.
30. Koleva DI, Orbetzova MM, Atanassova PK. Adipose tissue hormones and appetite and body weight regulators in insulin resistance. Folia Med (Plovdiv). 2013;55:25–32.
32. Garin MC, Butts SF, Sarwer DB, Allison KC, Senapati S, Dokras A. Ghrelin is independently associated with anti-mullerian hormone levels in obese but not non-obese women with polycystic ovary syndrome. Endocrine. 2017;55:907–13.
33. Ehrmann DA. Insulin resistance and polycystic ovary syndrome. Curr Diab Rep. 2002;2:71–6.
34. Azziz R. Evaluation for insulin resistance and comorbidities related to insulin resistance in polycystic ovary syndrome. In: Diamanti-Kandarakis E, Nestler JE, Panidis D, Pasqual R, editors. Contemporary endocrinology: insulin resistance and polycystic ovarian syndrome: pathogenesis, evaluation, and treatment. Totowa: Humana Press Inc.
35. Willis DS, Watson H, Mason HD, Galea R, Brincat M, Franks S. Premature response to luteinizing hormone of granulosa cells from anovulatory women with polycystic ovary syndrome: relevance to mechanism of anovulation. J Clin Endocrinol Metab. 1998;83:3984–91.
36. Suhail AR. Neuroendocrine dysfunction in PCOS: a critique of recent reviews. Clin Med Res. 2008;6:47–53.
37. Balen AH, Morley LC, Misso M, Franks S, Legro RS, Wijeyaratne CN, Stener-Victorin E, Fauser BC, Norman RJ, Teede H. The management of anovulatory infertility in women with polycystic ovary syndrome: an analysis of the evidence to support the development of global WHO guidance. Hum Reprod Update. 2016;22:687–708.
38. Pirwany IR, Fleming R, Greer IA, Packard CJ, Sattar N. Lipids and lipoprotein subfractions in women with PCOS: relationship to metabolic and endocrine parameters. Clin Endocrinol. 2001;54:447–53.
39. da Silva RC, Miranda WL, Chacra AR, Dib SA. Insulin resistance, beta-cell function, and glucose tolerance in Brazilian adolescents with obesity or risk factors for type 2 diabetes mellitus. J Diabetes Complicat. 2007;21:84–92. 40. Behboudi-Gandevani S, Ramezani Tehrani F, Bidhendi Yarandi R,
Noroozzadeh M, Hedayati M, Azizi F. The association between polycystic ovary syndrome, obesity, and the serum concentration of adipokines. J Endocrinol Investig. 2017;https://doi.org/10.1007/s40618-017-0650-x. 41. Sarray S, Madan S, Saleh LR, Mahmoud N, Almawi WY. Validity of
adiponectin-to-leptin and adiponectin-to-resistin ratios as predictors of polycystic ovary syndrome. Fertil Steril. 2015;104:460–6.
42. Mohamadin AM, Habib FA, Al-Saggaf AA. Cardiovascular disease markers in women with polycystic ovary syndrome with emphasis on asymmetric dimethylarginine and homocysteine. Ann Saudi Med. 2010;30:278–83.
https://doi.org/10.4103/0256-4947.65255.
43. Tamimi W, Siddiqui IA, Tamim H, AlEisa N, Adham M. Effect of body mass index on clinical manifestations in patients with polycystic ovary syndrome. Int J Gynaecol Obstet. 2009;107:54–7.https://doi.org/10.1016/j.ijgo.2009.06.003. 44. Ardawi MS, Rouzi AA. Plasma adiponectin and insulin resistance in women
with polycystic ovary syndrome. Fertil Steril. 2005;83:1708–16.
45. Gargari BP, Houjeghani S, Farzadi L, Houjeghani S, Safaeigan A. Relatioship between serum leptin, ghrelin and dietary micronutrients in women with polycystic ovary syndrome. Int J Fertil Steril. 2015;9(3):313–21.https://doi. org/10.22074/efs2015.45.46.
46. Pehlivanov B, Mitkov M. Serum leptin levels correlate with clinical and biochemical indices of insulin resistance in women with polycystic ovary syndrome. Eur J Contracept Reprod Health Care. 2009;14:153–9. 47. Balen A, Conway G, Kaltsas G. Polycystic ovary syndrome: the spectrum of
the disorder in 1741 patients. Hum Reprod. 1995;10:2107–11.
48. Hart R. Definitions, prevalence and symptoms of polycystic ovaries and the polycystic ovary syndrome. In: Allahbadia GN, Agrawal R, editors. Polycystic Ovary Syndrome. Kent: Anshan, Ltd; 2007. p. 15–26.
49. Fauser B, Tarlatzis B, Rebar R, et al. Consensus on women’s health aspects of polycystic ovary syndrome (PCOS): the Amsterdam ESHRE/ASRM-Sponsored 3rd PCOS Consensus Workshop Group. Fertil Steril. 2012;97:28–38.e25.
https://doi.org/10.1016/j.fertnstert.2011.09.024.
50. Baig M, Rehman R, Tariq S, Fatima SS. Serum leptin levels in polycystic ovary syndrome and its relationship with metabolic and hormonal profile in Pakistani females. Int J Endocrinol. 2014;https://doi.org/10.1155/2014/132908. 51. Chakrabarti J. Serum leptin level in women with polycystic ovary syndrome:
correlation with adiposity, insulin, and circulating testosterone. Ann Med Health Sci Res. 2013;3:191–6.https://doi.org/10.4103/2141-9248.113660. 52. Brannian JD, Zhao Y, McElroy M. Leptin inhibits gonadotrophin-stimulated
granulosa cell progesterone production by antagonizing insulin action. Hum Reprod. 1999;14:1445–8.
53. Kamal M, Mohi A, Fawzy M, El-Sawah H. Fasting plasma ghrelin in women with and without PCOS. Middle East Fertil Soc J. 2010;15:91–4.
54. Mohiti-Ardekani TN, Aflatonian A. Relationships between free leptin and insulin resistance in women with polycystic ovary syndrome. Iran J Reprod Med. 2009;7:53–8.
55. Bakari AG. Relationship between leptin and indices of obesity among apparently healthy adults in Kano, northwestern Nigeria. Int J Med Sci Public Health. 2015;4https://doi.org/10.5455/ijmsph.2015.19042015236. 56. Smith J, Al-Amri M, Sniderman A, Cianflone K. Leptin and adiponectin in
relation to body fat percentage, waist to hip ratio and the apoB/apoA1 ratio in Asian Indian and Caucasian men and women. Nutr Metab (Lond). 2006;3: 18.https://doi.org/10.1186/1743-7075-3-18.
57. Pagotto U, Gambineri A, Vicennati V, Heiman ML, Tschöp M, Pasquali R. Plasma ghrelin, obesity, and the polycystic ovary syndrome: correlation with insulin resistance and androgen levels. J Clin Endocrinol Metab. 2002;87:5625–9. 58. Stepien M, Rosniak-Bak K, Paradowski M, Misztal M, Kujawski K, Banach M,