R E S E A R C H A R T I C L E
Open Access
Multiple imputation for handling missing
outcome data when estimating the relative
risk
Thomas R. Sullivan
1*, Katherine J. Lee
2,3, Philip Ryan
1and Amy B. Salter
1Abstract
Background:Multiple imputation is a popular approach to handling missing data in medical research, yet little is known about its applicability for estimating the relative risk. Standard methods for imputing incomplete binary outcomes involve logistic regression or an assumption of multivariate normality, whereas relative risks are typically estimated using log binomial models. It is unclear whether misspecification of the imputation model in this setting could lead to biased parameter estimates.
Methods:Using simulated data, we evaluated the performance of multiple imputation for handling missing data prior to estimating adjusted relative risks from a correctly specified multivariable log binomial model. We
considered an arbitrary pattern of missing data in both outcome and exposure variables, with missing data induced under missing at random mechanisms. Focusing on standard model-based methods of multiple imputation, missing data were imputed using multivariate normal imputation or fully conditional specification with a logistic imputation model for the outcome.
Results:Multivariate normal imputation performed poorly in the simulation study, consistently producing estimates of the relative risk that were biased towards the null. Despite outperforming multivariate normal imputation, fully conditional specification also produced somewhat biased estimates, with greater bias observed for higher outcome prevalences and larger relative risks. Deleting imputed outcomes from analysis datasets did not improve the performance of fully conditional specification.
Conclusions:Both multivariate normal imputation and fully conditional specification produced biased estimates of the relative risk, presumably since both use a misspecified imputation model. Based on simulation results, we recommend researchers use fully conditional specification rather than multivariate normal imputation and retain imputed outcomes in the analysis when estimating relative risks. However fully conditional specification is not without its shortcomings, and so further research is needed to identify optimal approaches for relative risk estimation within the multiple imputation framework.
Keywords:Relative risk, Missing data, Multiple imputation
* Correspondence:[email protected]
1The University of Adelaide, School of Public Health, Adelaide, SA, Australia Full list of author information is available at the end of the article
Background
The relative risk is a summary measure of effect for binary outcomes that is often of interest in medical research [1–4]. Unlike the odds ratio, the relative risk is simple to interpret and collapsible across covariate strata [5]. For rare out-comes, relative risks may be estimated from logistic regres-sion models, since the odds ratio approximates the relative risk in this case [4]. For more common outcomes, the odds ratio overestimates the relative risk and so alternatives to logistic regression are required to estimate the relative risk. A standard approach to estimating the relative risk directly is to fit a generalized linear model with a binomial error distribution and a log link, known as the log binomial model [6, 7]. Since the log link allows predicted probabil-ities greater than one, convergence problems with this model are not uncommon, particularly for models contain-ing continuous covariates or outcomes with high preva-lence [6, 7]. Several alternative approaches to relative risk estimation have been proposed to address failed conver-gence with the log binomial model, with modified Poisson regression using a log link and a robust error variance [8] one of the more commonly used methods.
A common feature of epidemiologic investigations is the occurrence of missing data, which can result in biased and inefficient parameter estimates if inad-equately handled during the statistical analysis. Among the more rigorous approaches to handling missing data, multiple imputation (MI) [9] has been widely adopted due to its flexibility and availability in statistical software packages [10]. MI involves fitting a statistical model to the observed data to estimate values for the missing data. To incorporate missing data uncertainty, multiple values are imputed for each missing observation, produ-cing multiple complete datasets. Following analysis, par-ameter estimates from the multiple datasets are appropriately combined to give a single MI estimate. Standard implementations of MI assume that data are missing at random (MAR), which occurs when the prob-ability of missing data depends only on observed data [11]. Provided this assumption is met and statistical models used for imputation and analysis are correctly specified, MI produces consistent and asymptotically ef-ficient parameter estimates [9].
For arbitrary patterns of missing data (i.e. missing data occurring in any variable, in any pattern across variables), the two standard model-based methods of MI are fully conditional specification (FCS) [12–14], also known as chained equations, and multivariate normal imputation (MVNI) [15]. FCS involves specifying a series of univariate imputation models, one for each variable with missing data. Standard software uses logistic regression to impute incomplete binary outcomes, which assumes a linear rela-tionship between the log odds of the risk and other vari-ables in the imputation model. Incomplete covariates can
similarly be imputed using appropriate univariate models (e.g. linear regression for continuous covariates). In con-trast, MVNI assumes that all variables in the imputation model follow a multivariate normal distribution. For in-complete binary outcomes, an additional rounding step is also required following MVNI to convert continuous im-puted values to binary values suitable for analysis [16]. Al-though FCS and MVNI have been evaluated in settings where the goal is to estimate the odds ratio using logistic regression [12, 16, 17], little is known about their perform-ance when the aim is to estimate the relative risk. Import-antly, it is unclear whether imputing outcomes using logistic regression in FCS or under a multivariate normal assumption in MVNI could lead to biased or inefficient es-timation when the analysis involves a log binomial model.
A popular alternative to the standard implementation of MI for handling missing data in both outcome and exposure variables is the “multiple imputation, then de-letion” approach (MID), where observations with im-puted outcomes are excluded from the analysis [18]. Although MID is not advisable when the imputation model contains auxiliary variables for the outcome (i.e. variables that are not part of the analysis but which help to predict missing outcome values) [19], the approach can offer small efficiency gains over standard MI when imputation and analysis models are the same. Of rele-vance to the estimation of relative risks, it has been ar-gued that removing imputed outcomes prior to analysis can help to minimize the bias introduced by a misspeci-fied imputation model for the outcome [18]. Should the imputation of incomplete binary outcomes using FCS or MVNI lead to biased estimation of the relative risk, this claimed strength of MID could lessen this bias.
This article aims to (i) evaluate the performance of FCS and MVNI for handling missing outcome data when estimating the relative risk, and (ii) investigate whether deleting imputed outcomes prior to analysis im-proves the performance of FCS and MVNI in this set-ting. The rest of the article is set out as follows. In the next section, we describe the methods of FCS and MVNI in more detail, drawing attention to potential limitations. This is followed by an outline of the simulation methods used to address the article aims, and a summary of the simulation results. Finally, we conclude the article by discussing key findings and providing recommendations for practice.
Methods
Fully conditional specification
values with randomly selected observed values or the mean value for the same variable. Imputations are then generated by estimating each univariate model in turn, restricted to participants with observed values for the variable being considered and using imputed values for other variables; at each stage missing values are replaced by draws from their posterior predictive distribution. This process continues until all incomplete variables have been imputed and is repeated several times in order to stabilise results, leading to the generation of a single imputed dataset. Additional imputed datasets are ob-tained by independently repeating this process.
Despite its flexibility, FCS is not without limitations. One concern with the approach is the possibility of spe-cifying univariate imputation models where the condi-tional distributions implied do not correspond to a valid joint distribution. A potential consequence of this is that results could vary according to the ordering of univariate imputation models within the FCS procedure. Fortu-nately this issue appears to have little impact on results in practice [12, 13, 17, 20]. Another drawback of FCS is that it can be time consuming to implement in settings containing a large number of incomplete variables, since univariate imputation models need to be specified for each incomplete variable in the imputation model.
Multivariate normal imputation
MVNI is a joint modelling approach to imputation where all variables in the imputation model are assumed to fol-low a multivariate normal distribution. First implemented by Schafer [15], MVNI uses a Markov chain Monte Carlo algorithm (known as data augmentation) for imputation. Initially, missing values are imputed based on assumed starting parameter values for the multivariate normal dis-tribution. These are typically obtained from available data using the expectation-maximisation algorithm. Next, up-dated parameter values for the multivariate normal distri-bution are drawn from their posterior distridistri-bution based on the observed and imputed data. This iterative process of imputing missing values and drawing updated param-eter values continues until these values converge to a sta-tionary distribution [15, 21]. Following these “burn-in” iterations, a set of imputed values is taken. In order to re-duce dependence between imputations, additional itera-tions are performed before the next set of imputed values is obtained.
Due to its strong theoretical underpinnings, MVNI is an appealing method when multivariate normality holds, but such an assumption is not always realistic, particularly when the imputation model contains binary variables. Although several authors have reported good performance with MVNI for binary variables [15, 16, 20, 22], it remains difficult to make global statements about the robustness of this approach to violations of
multivariate normality, whether in the specific case of binary variables or more generally.
Simulation study
The performance of FCS and MVNI for handling miss-ing outcome data when estimatmiss-ing the relative risk was evaluated using data simulation. In order to attribute any deficiencies in performance to the method of MI, ra-ther than getting caught up in complexities of the data, we focused on relatively simple simulation scenarios. In each simulation scenario, 2000 datasets of size n= 1000 were generated from the log binomial model logP(Y= 1) =β0+β1X1+β2X2, where X1andX2were binary or nor-mally distributed exposure variables andY was the bin-ary outcome. A relatively large sample size was chosen to avoid zero cells in cross-tabulations involving the out-come. Following generation of complete datasets, values inX2and Ywere set to missing according to a specified MAR mechanism to produce an arbitrary pattern of missing data in these two variables. Missing values were then multiply imputed using FCS or MVNI with m= 20 imputations. For FCS, missing values inYwere imputed using a logistic regression model, while imputations for binary or normally distributedX2were generated from a logistic or linear regression model respectively. A total of 20 cycles were used for each imputation, with the out-come imputed last. For MVNI, missing values were im-puted using a Markov chain Monte Carlo algorithm with a burn-in of 200 iterations. Following imputation with MVNI, imputed values in the outcome were rounded to binary values using adaptive rounding, which has been recommended over alternative rounding techniques [16]. Finally, complete datasets either retaining or deleting im-puted outcomes were analyzed using log binomial models (or modified Poisson regression as appropriate), with par-ameter estimates for β1and β2combined across datasets using Rubin’s rules [9]. Since the outcome Ywas gener-ated under the analysis model, any deficiencies in per-formance could be attributed to the method of MI. For reference, a complete case analysis (CCA) restricted to participants with complete data on bothYandX2was also performed in each simulation scenario.
Simulation study 1: Categorical exposures
complete datasets, values inYandX2were set to missing according to one of two MAR mechanisms:
1) Coordinated: logitP(Ymissing) = logitP(X2missing)
=α+λX1.
2) Opposite: logitP(Ymissing) =α+λX1,
logitP(X2missing) =α+λ(1−X1).
Under the coordinated mechanism, participants with missing data were often missing bothYand X2, whereas under the opposite mechanism, participants with miss-ing data tended to be missmiss-ing either Y or X2 (but not both). For both mechanisms, the parameterλ was set to 1 or 2 to indicate a moderate or strong missing data mechanism respectively, whileα was chosen to produce 30% missing data in Yand X2. Collectively this resulted in 4 missing data patterns and 32 simulation scenarios. Following imputation, complete datasets were analyzed using log binomial models. Provided MVNI was applied with adaptive rounding for imputed values in X2 (in addition to Y), there were no convergence issues with the log binomial model in this setting.
Simulation study 2: Continuous exposures
For simulation study 2,X1and X2were generated from a bivariate normal distribution with mean 0, variance 0.20 and correlation (corr(X1,X2)) 0.30 or 0.70. Againβ1andβ2 were set to log(2) or log(3) to give conditional relative risks of 2 or 3, whileβ0was chosen to give an outcome preva-lence of 0.10 or 0.30. One concern when simulating data under a log binomial model with unbounded continuous covariates is the possibility of generating‘success’ probabil-ities greater than one. In choosing the variance forX1and
X2, we sought to maximize the size of standardized condi-tional relative risks while minimizing the occurrence of in-valid success probabilities. With a variance of 0.20, inin-valid success probabilities were rare, except in settings involving an outcome prevalence of 0.30 and conditional relative risks of 3 (where 5.4% of success probabilities exceeded one). Following previous simulation studies exploring the relative risk (e.g. [23]),X1andX2were resampled in these instances to ensure valid success probabilities.
Letting Z1¼X1=
ffiffiffiffiffiffiffiffiffiffiffiffiffiffiffiffiffi
varð ÞX1
p
, the coordinated and op-posite missing data mechanisms were adapted for the continuous setting as follows:
1) Coordinated: logitP(Ymissing) = logitP(X2missing)
=α+λZ1.
2) Opposite: logitP(Ymissing) =α+λZ1,
logitP(X2missing) =α−λZ1.
In line with simulation study 1,λwas set to 1 or 2 and
αwas chosen to produce 30% missing data in Yand X2.
Again this resulted in 4 missing data patterns and 32 simulation scenarios. As non-convergence with the log binomial model was a considerable problem in this set-ting, often occurring for some but not all imputed data-sets within a single simulation, we elected to analyze all complete datasets using modified Poisson regression.
Comparisons
The performance of the MI approaches in estimating pa-rametersβ1andβ2was evaluated in terms of bias (average difference between estimate and true value) and the cover-age of estimated 95% confidence intervals (proportion of 95% confidence intervals containing the true value). With 2000 simulated datasets per simulation scenario, on 95% of occasions the coverage is expected to lie between 0.94 and 0.96 for a true coverage of 0.95. For each parameter, the average within-simulation estimated standard error (denoted the average standard error), the standard error of parameter estimates across simulated datasets (denoted the empirical standard error), and the mean square error (average squared difference between the estimate and the true value) were also derived. All analyses were performed in SAS version 9.4 (SAS Institute, Inc., Cary, North Carolina). Multiple imputation was carried out using the MI procedure, while analysis was performed using the GENMOD and MIANALYZE procedures. The SAS code for implementing the simulation study is available in the Additional file 1: Web Appendix.
Results
Simulation study 1: Categorical exposures
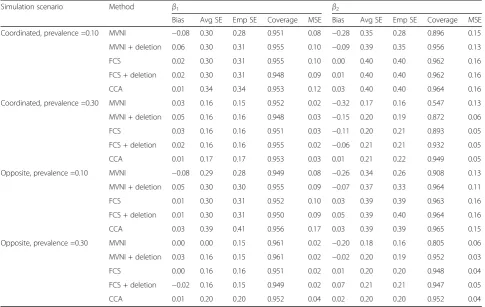
Table 1 displays results for the categorical exposure set-ting in scenarios with a strong missing data mechanism (λ= 2), where RR(X1,X2) = 2 andβ1=β2= log(3). Similar results were observed for RR(X1,X2) = 3, while absolute biases of the imputation approaches were smaller in magnitude when λ= 1 and β1=β2= log(2). Full results for all simulation scenarios are available in the Add-itional file 1: Web Appendix. MVNI performed poorly across the 32 simulation scenarios, consistently produ-cing estimates of β2 that were biased towards the null (bias range−0.32 to−0.10). The bias of−0.32 shown in Table 1 for an outcome prevalence of 0.30 under the co-ordinated mechanism equates to a relative risk estimate of 2.19 compared with the true value of 3; coverage was just 0.55 in this scenario. Bias was less of a concern for
led to small increases in the mean square error for β1, but tended to decrease the mean square error forβ2.
In contrast to MVNI, FCS performed fairly well for categorical exposures, with absolute bias only exceed-ing 0.10 for the coefficient β2 in scenarios involving a strong coordinated mechanism, an outcome preva-lence of 0.30 and where β1=β2= log(3). Excluding simulation scenarios where the bias for β2 exceeded 0.10, the coverage of estimated 95% confidence inter-vals for β1 and β2 remained close to nominal levels (range 0.93 to 0.96). Compared to FCS (without dele-tion), FCS with deletion led to small reductions in ab-solute bias for β2 under the coordinated mechanism for an outcome prevalence of 0.30, but slight in-creases in absolute bias under the opposite mechan-ism for the same outcome prevalence. There was little difference in average standard errors, empirical standard errors, and mean square errors between FCS and FCS with deletion, although both approaches were less precise than MVNI.
Interestingly, CCA exhibited little bias in simulation scenarios involving categorical exposures, with a max-imum absolute bias of 0.06 for both β1 and β2. As ex-pected, in discarding information from partially observed cases, CCA was noticeably less efficient than
the MI approaches, especially for the coefficient β1 for the fully observed exposureX1.
Simulation study 2: Continuous exposures
To ensure that any deficiencies in performance in the continuous exposure setting could be attributed to the method of MI and not the use of modified Poisson re-gression for estimating relative risks, the accuracy of this method was first verified in complete datasets (i.e. before values in Yand X2 were set to missing). Reassuringly, unbiased estimates for β1 and β2were observed across all simulation scenarios (absolute bias ≤0.01), with estimated 95% confidence intervals demonstrating ap-propriate coverage (i.e. within the range 0.94 to 0.96) (results not shown).
The performance deficits of MI were more pro-nounced in the presence of continuous exposures than categorical exposures. Table 2 shows results for scenar-ios with a strong missing data mechanism (λ= 2), where corr(X1,X2) = 0.70 andβ1=β2= log(3). A similar pattern of results was observed in other simulation scenarios, al-though absolute biases were smaller in magnitude for λ = 1 and β1=β2= log(2). As shown in Table 2, MVNI produced estimates for β1 and β2 that were biased to-wards the null, with the largest absolute bias observed Table 1Results forX1andX2Binary,λ= 2, RR(X1,X2) = 2 andβ1=β2= log(3)
Simulation scenario Method β1 β2
Bias Avg SE Emp SE Coverage MSE Bias Avg SE Emp SE Coverage MSE
Coordinated, prevalence =0.10 MVNI −0.08 0.30 0.28 0.951 0.08 −0.28 0.35 0.28 0.896 0.15
MVNI + deletion 0.06 0.30 0.31 0.955 0.10 −0.09 0.39 0.35 0.956 0.13
FCS 0.02 0.30 0.31 0.955 0.10 0.00 0.40 0.40 0.962 0.16
FCS + deletion 0.02 0.30 0.31 0.948 0.09 0.01 0.40 0.40 0.962 0.16
CCA 0.01 0.34 0.34 0.953 0.12 0.03 0.40 0.40 0.964 0.16
Coordinated, prevalence =0.30 MVNI 0.03 0.16 0.15 0.952 0.02 −0.32 0.17 0.16 0.547 0.13
MVNI + deletion 0.05 0.16 0.16 0.948 0.03 −0.15 0.20 0.19 0.872 0.06
FCS 0.03 0.16 0.16 0.951 0.03 −0.11 0.20 0.21 0.893 0.05
FCS + deletion 0.02 0.16 0.16 0.955 0.02 −0.06 0.21 0.21 0.932 0.05
CCA 0.01 0.17 0.17 0.953 0.03 0.01 0.21 0.22 0.949 0.05
Opposite, prevalence =0.10 MVNI −0.08 0.29 0.28 0.949 0.08 −0.26 0.34 0.26 0.908 0.13
MVNI + deletion 0.05 0.30 0.30 0.955 0.09 −0.07 0.37 0.33 0.964 0.11
FCS 0.01 0.30 0.31 0.952 0.10 0.03 0.39 0.39 0.963 0.16
FCS + deletion 0.01 0.30 0.31 0.950 0.09 0.05 0.39 0.40 0.964 0.16
CCA 0.03 0.39 0.41 0.956 0.17 0.03 0.39 0.39 0.965 0.15
Opposite, prevalence =0.30 MVNI 0.00 0.00 0.15 0.961 0.02 −0.20 0.18 0.16 0.805 0.06
MVNI + deletion 0.03 0.16 0.15 0.961 0.02 −0.02 0.20 0.19 0.952 0.03
FCS 0.00 0.16 0.16 0.951 0.02 0.01 0.20 0.20 0.948 0.04
FCS + deletion −0.02 0.16 0.15 0.949 0.02 0.07 0.21 0.21 0.947 0.05
CCA 0.01 0.20 0.20 0.952 0.04 0.02 0.20 0.20 0.952 0.04
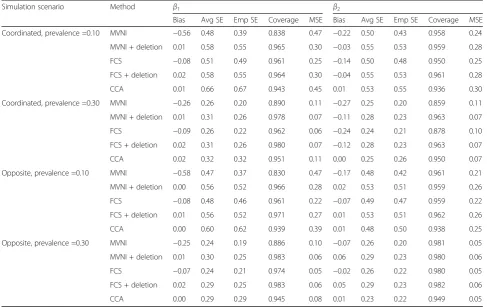
for β1 under the opposite mechanism with an outcome prevalence of 0.10 (relative risk estimate of 1.68 com-pared with the true value of 3). Across all 32 simulation scenarios, the median bias of MVNI was −0.21 for β1 (range−0.58 to−0.10) and−0.12 forβ2(range−0.27 to −0.06). Deleting imputed outcomes following MVNI re-duced the bias of this imputation method, although moderate bias remained forβ2in scenarios with an out-come prevalence of 0.30. The cost of this bias reduction was substantially larger average standard errors in com-parison to MVNI. In terms of accuracy, deleting imputed outcomes following MVNI led to reductions in the mean square error relative to MVNI without deletion in 26/32 and 12/32 simulation scenarios forβ1andβ2respectively.
FCS also produced estimates of β1 and β2 that were biased towards the null, albeit to a lesser degree than MVNI. The bias of−0.24 shown in Table 2 for an out-come prevalence of 0.30 under the coordinated mechan-ism translates to a relative risk estimate of just 2.37 versus the true value of 3. In addition to the more ex-treme simulation scenarios, noticeable bias for β2 (abso-lute bias >0.10) was apparent in simulation scenarios with an outcome prevalence of 0.10, a moderate missing data mechanism or where β1=β2= log(2). Deleting im-puted outcomes following FCS tended to decrease the
bias of this imputation approach, with absolute bias re-duced in 28/32 and 26/32 simulation scenarios for β1 and β2respectively. The trade-off for this bias reduction was a substantial loss in precision. Across the 32 simula-tion scenarios, average standard errors were 14.4% larger for β1 and 8.1% larger for β2 with the deletion of im-puted outcomes following FCS compared to FCS alone. A consequence of the substantial loss in precision with the deletion of imputed outcomes following FCS was a loss in overall accuracy, with the mean square error in-creased relative to FCS without deletion in 30/32 and 26/32 simulation scenarios forβ1andβ2respectively.
Another noteworthy result from the continuous ex-posure setting was that average standard errors were consistently larger than empirical standard errors. Aver-aged across the 32 simulation scenarios, average stand-ard errors for β1 and β2 were 25.8% and 17.9% larger than empirical standard errors respectively for MVNI, 14.4% and 11.9% larger for MVNI with deletion, 10.4% and 9.5% larger for FCS, and 14.3% and 12.1% larger for FCS with deletion. Discrepancies were most prominent in simulation scenarios with an outcome prevalence of 0.30. In scenarios where β1and β2 were estimated with little bias, coverage probabilities also tended to be much higher than the nominal level of 0.95. Collectively these Table 2Results forX1andX2Continuous,λ= 2, Corr(X1,X2) = 0.70 andβ1=β2= log(3)
Simulation scenario Method β1 β2
Bias Avg SE Emp SE Coverage MSE Bias Avg SE Emp SE Coverage MSE
Coordinated, prevalence =0.10 MVNI −0.56 0.48 0.39 0.838 0.47 −0.22 0.50 0.43 0.958 0.24
MVNI + deletion 0.01 0.58 0.55 0.965 0.30 −0.03 0.55 0.53 0.959 0.28
FCS −0.08 0.51 0.49 0.961 0.25 −0.14 0.50 0.48 0.950 0.25
FCS + deletion 0.02 0.58 0.55 0.964 0.30 −0.04 0.55 0.53 0.961 0.28
CCA 0.01 0.66 0.67 0.943 0.45 0.01 0.53 0.55 0.936 0.30
Coordinated, prevalence =0.30 MVNI −0.26 0.26 0.20 0.890 0.11 −0.27 0.25 0.20 0.859 0.11
MVNI + deletion 0.01 0.31 0.26 0.978 0.07 −0.11 0.28 0.23 0.963 0.07
FCS −0.09 0.26 0.22 0.962 0.06 −0.24 0.24 0.21 0.878 0.10
FCS + deletion 0.02 0.31 0.26 0.980 0.07 −0.12 0.28 0.23 0.963 0.07
CCA 0.02 0.32 0.32 0.951 0.11 0.00 0.25 0.26 0.950 0.07
Opposite, prevalence =0.10 MVNI −0.58 0.47 0.37 0.830 0.47 −0.17 0.48 0.42 0.961 0.21
MVNI + deletion 0.00 0.56 0.52 0.966 0.28 0.02 0.53 0.51 0.959 0.26
FCS −0.08 0.48 0.46 0.961 0.22 −0.07 0.49 0.47 0.959 0.22
FCS + deletion 0.01 0.56 0.52 0.971 0.27 0.01 0.53 0.51 0.962 0.26
CCA 0.00 0.60 0.62 0.939 0.39 0.01 0.48 0.50 0.938 0.25
Opposite, prevalence =0.30 MVNI −0.25 0.24 0.19 0.886 0.10 −0.07 0.26 0.20 0.981 0.05
MVNI + deletion 0.01 0.30 0.25 0.983 0.06 0.06 0.29 0.23 0.980 0.06
FCS −0.07 0.24 0.21 0.974 0.05 −0.02 0.26 0.22 0.980 0.05
FCS + deletion 0.02 0.29 0.25 0.983 0.06 0.05 0.29 0.23 0.982 0.06
CCA 0.00 0.29 0.29 0.945 0.08 0.01 0.23 0.22 0.949 0.05
results suggest that estimated confidence intervals were too wide.
As observed for categorical exposures, CCA exhibited little bias but tended to produce inefficient estimates of
β1in scenarios involving continuous exposures. Interest-ingly, CCA produced more precise estimates ofβ2than the two MID approaches; across the 32 simulation sce-narios, average standard errors forβ2were 9.3% smaller with CCA relative to both deletion approaches.
Sensitivity analyses
In light of the relatively poor performance of the MI ap-proaches for relative risk estimation, we undertook add-itional analyses to explore whether findings were sensitive to choices made during the fitting of imput-ation models or to the simulimput-ation parameters consid-ered. First, we investigated the performance of simple rounding following MVNI as an alternative to adaptive rounding. While differences were minimal in most sce-narios, MVNI introduced slightly more bias in both cat-egorical and continuous exposure settings when simple rounding was used in place of adaptive rounding (results not shown). Next, we investigated the performance of FCS with the outcome imputed before rather than after the incomplete covariateX2. This modification made lit-tle difference to results (also not shown). We then ex-plored the performance of the four MI approaches in scenarios involving n= 250 rather thann= 1000 obser-vations. Excluding simulation scenarios with binary X1 and X2 where the reduced sample size resulted in zero cells in cross-tabulations involving the outcome (i.e. where log binomial analysis models would not con-verge), this change made little difference to the bias and coverage of parameter estimates (results not shown).
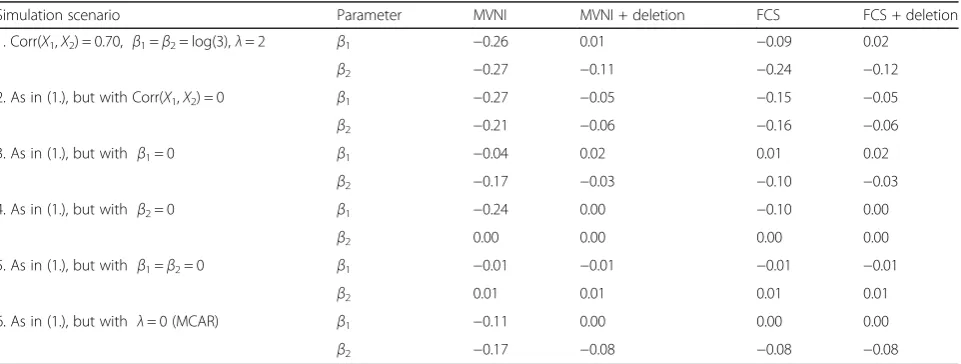
To investigate whether biased estimation would persist if the exposures were independent of one another, if the
outcome was unrelated to one or both exposures, or if data were missing completely at random (i.e. probability of missing data unrelated to observed or unobserved data), several “null-case” simulation settings were con-sidered. Table 3 shows results for continuous X1and X2 under the coordinated missing data mechanism for an outcome prevalence of 0.30. The reference case for com-parisons in this table was the previously considered simulation scenario involving a strong missing data mechanism (λ= 2), where corr(X1,X2) = 0.70 andβ1=β2 = log(3). As shown in the table, the four MI approaches continued to produce biased parameter estimates when the exposures were independent of one another (i.e. corr(X1,X2) = 0). When the outcome was unrelated to one of the exposures, parameter estimates remained biased only for the exposure that was predictive of the outcome; little bias was observed with any of the MI ap-proaches when both exposures were unrelated to the outcome. Lastly, bias was reduced but still evident when data were missing completely at random. A similar pat-tern of results was observed with binary X1and X2, and for an outcome prevalence of 0.10. Full results for these sensitivity analyses are available in the Additional file 1: Web Appendix.
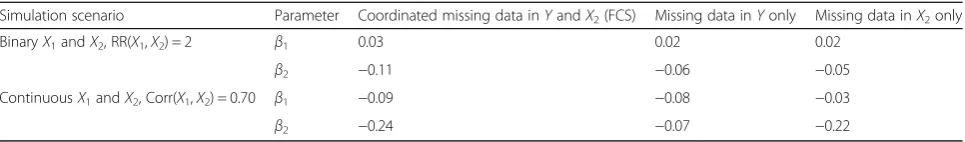
Lastly, to evaluate whether the performance deficiencies of FCS could be attributed solely to the misspecified logis-tic imputation model for the outcome, we considered add-itional simulation scenarios where missing data were restricted to eitherYorX2only (with logitP(missing) =α +λX1). Since data were missing in a single variable, miss-ing values were imputed 20 times usmiss-ing logistic or linear regression as appropriate. Table 4 shows results for an outcome prevalence of 0.30, λ= 2 andβ1=β2= log(3) for categorical exposures with RR(X1,X2) = 2 or continuous exposures with corr(X1,X2) = 0.70. The results for the ori-ginal simulation scenario for FCS under the coordinated
Table 3Bias in Scenarios withX1andX2Continuous, Coordinated Missing Data Mechanism and Outcome Prevalence = 0.30
Simulation scenario Parameter MVNI MVNI + deletion FCS FCS + deletion
1. Corr(X1,X2) = 0.70, β1=β2= log(3),λ= 2 β1 −0.26 0.01 −0.09 0.02
β2 −0.27 −0.11 −0.24 −0.12
2. As in (1.), but with Corr(X1,X2) = 0 β1 −0.27 −0.05 −0.15 −0.05
β2 −0.21 −0.06 −0.16 −0.06
3. As in (1.), but with β1= 0 β1 −0.04 0.02 0.01 0.02
β2 −0.17 −0.03 −0.10 −0.03
4. As in (1.), but with β2= 0 β1 −0.24 0.00 −0.10 0.00
β2 0.00 0.00 0.00 0.00
5. As in (1.), but with β1=β2= 0 β1 −0.01 −0.01 −0.01 −0.01
β2 0.01 0.01 0.01 0.01
6. As in (1.), but with λ= 0 (MCAR) β1 −0.11 0.00 0.00 0.00
β2 −0.17 −0.08 −0.08 −0.08
mechanism are also presented for comparison. As shown in the table, estimation remained biased when missing data were restricted to X2. Indeed for continuous expo-sures, the bias for β2was larger when missing data were restricted toX2compared to when missing data were re-stricted toY. Thus it seems that the shortcomings of FCS were at least partly attributable to the choice of condi-tional imputation model for the incomplete covariate X2. It is worth noting that the bias following the imputation of continuousX2with a univariate linear model, as shown in Table 4, also suggests that the performance deficits seen with MVNI in the continuous exposure setting were partly due to inappropriate imputed values in the ex-posure (and not just the outcome).
Discussion
Given the widespread use of MI and the popularity of the relative risk, the lack of research on the application of MI for estimating the relative risk is surprising. In this study we demonstrated that standard model-based methods of MI can produce biased estimates of the rela-tive risk with overly wide confidence intervals when data are MAR. Performance deficits were particularly evident when the analysis included continuous exposures, and in settings with larger relative risks, stronger missing data mechanisms and higher outcome prevalences. These findings raise concerns about the use of standard MI methods for relative risk estimation.
The primary aim of this study was to contrast the per-formance of MVNI and FCS for handling missing out-come data when estimating the relative risk. MVNI performed more poorly than FCS, producing relative risk estimates that were often substantially biased towards the null, both for categorical and continuous exposures. Although MVNI has been shown to be robust to viola-tions of the multivariate normal assumption across a range of other settings, for example in estimating odds ratios or dealing with non-normal exposure variables [16, 20], such robustness to imputation model misspeci-fication was not evident here. In contrast, FCS per-formed well when the analysis involved categorical exposures, only introducing noticeable bias for an out-come prevalence of 0.30, a strong missing data mechan-ism and large relative risks. Performance was less satisfactory in the presence of continuous exposures,
with noticeable bias towards the null also evident in set-tings involving moderate relative risks or an outcome prevalence of 0.10. Even when relative risks for continu-ous exposures were estimated with little bias, FCS pro-duced confidence intervals that were too wide. While we would recommend FCS over MVNI for relative risk esti-mation based on the simulation results presented here, clearly the approach is not without its shortcomings.
The secondary aim of this study was to evaluate whether deleting imputed outcomes improves the per-formance of MI for relative risk estimation. Focusing on FCS as the better performed method of MI, we observed little difference between FCS with and without deletion of imputed outcomes for analysis models involving cat-egorical exposures. In the presence of continuous expo-sures, deleting imputed outcomes following FCS was associated with partial decreases in absolute bias at the expense of large increases in average standard errors; an interesting finding given that deletion improves the pre-cision of estimation in settings where analysis and im-putation models are the same [18]. The lost precision with MID in the continuous exposure settings suggests that imputed values in the outcome contained informa-tion that was useful for analysis, which may be due to inconsistencies between the imputation and analysis models. Of course, since the imputation model was mis-specified, this additional information (from the imputed outcome values) could also result in increased bias in a conventional MI analysis. In any case, we find it difficult to recommend MID for relative risk estimation based on these results, particularly since the approach is only ad-visable in settings where auxiliary variables for the out-come are unavailable [19].
Although logistic regression is the standard choice for imputing binary outcomes in software for implementing FCS, evidently this model is not optimal for relative risk estimation. Since controlling for confounding differs be-tween the odds ratio and the relative risk [24], it is perhaps unsurprising that performance deficits were observed with FCS in this simulation study. This raises the question of whether an alternative conditional imputation model for the outcome should be adopted with FCS when relative risk estimation of interest. Assuming the analysis model is appropriately specified, an obvious candidate to minimise the problems of imputation model misspecification is the Table 4Bias in Scenarios withλ= 2, Outcome Prevalence = 0.30 andβ1=β2= log(3)
Simulation scenario Parameter Coordinated missing data inYandX2(FCS) Missing data inYonly Missing data inX2only
BinaryX1andX2, RR(X1,X2) = 2 β1 0.03 0.02 0.02
β2 −0.11 −0.06 −0.05
ContinuousX1andX2, Corr(X1,X2) = 0.70 β1 −0.09 −0.08 −0.03
β2 −0.24 −0.07 −0.22
log binomial model, however issues with non-convergence could be a significant limitation in the context of FCS. As relative risks are often estimated using modified Poisson regression, another possibility would be to impute out-comes using Poisson regression. One difficulty with this approach is that imputed outcome values would be counts and would thus entail the use of modified Poisson regres-sion in the analysis or the use of a rounding method prior to analysis with a log binomial model. Rounding methods have not been developed for this purpose. Another im-portant challenge would be to incorporate a robust esti-mate of the error variance within the imputation model, since ordinary Poisson regression tends to overestimate the standard error for the relative risk [8]. Although other approaches have been proposed to estimate relative risks (e.g. Cox regression with constant time at risk [25]), like Poisson regression, they typically require the use of a ro-bust error variance which would need to be accounted for during imputation. This is difficult to achieve with current MI software.
In addition to the misspecified logistic model for im-puting the outcome, sensitivity analyses revealed that the bias introduced by FCS could also be attributed to the conditional models used to impute the covariates. Im-puting the continuous covariate using linear regression in FCS assumed a linear relationship between the covari-ate and the outcome, which was inconsistent with the data generation model. A similar argument applies for the imputation of binary covariates using logistic regres-sion. In a recent article, Bartlett and colleagues [26] pro-posed a modification to the standard FCS algorithm such that incomplete covariates are imputed from models that are compatible with the intended analysis model. While the approach seems promising in this context, further re-search is needed to understand its properties and suitabil-ity for relative risk estimation.
Due to convergence problems with the log binomial model in the continuous exposure setting, we elected to analyze all imputed datasets using the popular modified Poisson regression approach. Simulation results demon-strated that this method performed well in the absence of missing data, which is consistent with previous inves-tigations of the method [8, 23, 25]. An interesting con-sideration that arose following imputation was whether to use modified Poisson regression to analyze all im-puted datasets or only those datasets where the log bino-mial model failed to converge. We chose the former approach, as this was simpler to implement and seemed more in keeping with Rubin’s rules, however the latter could also be considered in future work.
Given the missing data mechanisms considered in the simulation study, it is not surprising that CCA produced parameter estimates with little bias. For missing data in a univariate outcome, CCA is known to produce unbiased
and fully efficient estimates of regression coefficients when the probability of missing data depends only on fully ob-served covariates [27–29]. For missing data restricted to a covariate, CCA is known to be unbiased (but not fully effi-cient) if the probability of missing data is independent of the outcome conditional on the other covariates in the model [30]. Both of these conditions were satisfied in the simulation study, where the probability of missing data in
Yand X2 depended only on the fully observed covariate
X1. Clearly these conditions do not always hold in more complex practical settings, and CCA can introduce con-siderable bias when data are MAR. Taking into account the potential bias and inefficiency of CCA, we do not ad-vocate its use over MI for handling arbitrary patterns of missing data when estimating the relative risk.
Although we anticipate similar deficits with MVNI and FCS in more complex practical settings, it is diffi-cult to draw definitive conclusions from a restricted set of simulation scenarios. Further exploration of the per-formance of these MI methods in real datasets (where the missing data mechanism is unknown) and in simu-lation scenarios with different covariate characteristics, outcome prevalences and missing data mechanisms would certainly be useful. A further limitation of the current study is that we did not evaluate alternatives to standard model-based methods of MI for handling missing data. Most notably we did not consider inverse probability weighting, a method that involves weighting complete cases in the analysis according to the inverse of the probability of being a complete case [31]. We chose to focus on MI as it known to be more efficient than inverse probability weighting, particularly in the presence of auxiliary variables and for arbitrary patterns of missing data. However in light of the performance deficits of MI, further research could explore the use of inverse probability weighting in this setting. Within the MI framework, we did not consider less widely used model-based methods such as the general location model for mixtures of continuous and categorical vari-ables, or non-parametric methods such as hot deck im-putation. Again further research might consider the use of these approaches for relative risk estimation.
Conclusions
Additional file
Additional file 1:Web Appendix. (DOCX 227 kb)
Abbreviations
FCS:fully conditional specificationMAR: missing at random; MI: multiple imputation; MID: multiple imputation then deletion; MVNI: multivariate normal imputation
Acknowledgements Not applicable.
Availability of data and material
All data were simulated; SAS simulation code is available from [email protected] on request.
Funding
The work was supported by funding from an Australian Government Research Training Program Scholarship (Thomas R Sullivan) and a National Health and Medical Research Council Career Development Fellowship (Katherine J Lee, ID 1053609).
Authors’contributions
TRS designed the study, performed all analyses, interpreted the results and drafted the manuscript. KJL, PR and AS contributed to study design, interpreted results and critically reviewed the manuscript. All authors read and approved the final manuscript.
Ethics approval and consent to participate Not applicable.
Consent for publication Not applicable.
Competing interests
The authors declare that they have no competing interests.
Publisher’s Note
Springer Nature remains neutral with regard to jurisdictional claims in published maps and institutional affiliations.
Author details
1The University of Adelaide, School of Public Health, Adelaide, SA, Australia. 2Clinical Epidemiology and Biostatistics Unit, Murdoch Childrens Research Institute, Melville, VIC, Australia.3Department of Paediatrics, University of Melbourne, Melbourne, VIC, Australia.
Received: 10 February 2017 Accepted: 31 August 2017
References
1. Greenland S. Interpretation and choice of effect measures in epidemiologic analyses. Am J Epidemiol. 1987;125(5):761–8.
2. Lee J. Odds ratio or relative risk for cross-sectional data? Int J Epidemiol. 1994;23(1):201–3.
3. Sinclair JC, Bracken MB. Clinically useful measures of effect in binary analyses of randomized trials. J Clin Epidemiol. 1994;47(8):881–9. 4. McNutt LA, Wu C, Xue X, Hafner JP. Estimating the relative risk in cohort
studies and clinical trials of common outcomes. Am J Epidemiol. 2003; 157(10):940–3.
5. Cummings P. The relative merits of risk ratios and odds ratios. Archives of Pediatrics & Adolescent Medicine. 2009;163(5):438–45.
6. Wacholder S. Binomial regression in GLIM: estimating risk ratios and risk differences. Am J Epidemiol. 1986;123(1):174–84.
7. Skov T, Deddens J, Petersen MR, Endahl L. Prevalence proportion ratios: estimation and hypothesis testing. Int J Epidemiol. 1998;27(1):91–5. 8. Zou G. A modified poisson regression approach to prospective studies with
binary data. Am J Epidemiol. 2004;159(7):702–6.
9. Rubin D. Multiple imputation for nonresponse in surveys. New York: Wiley & Sons; 1987.
10. Hayati Rezvan P, Lee KJ, Simpson JA. The rise of multiple imputation: a review of the reporting and implementation of the method in medical research. BMC Med Res Methodol. 2015;15:30.
11. Rubin D. Inference and missing data. Biometrika. 1976;63(3):581–92. 12. Raghunathan T, Lepkowski J, Van Hoewyk J, Solenberger P. A multivariate
technique for multiply imputing missing values using a sequence of regression models. Survey Methodology. 2001;27(1):85–95.
13. van Buuren S. Multiple imputation of discrete and continuous data by fully conditional specification. Stat Methods Med Res. 2007;16(3):219–42. 14. White IR, Royston P, Wood AM. Multiple imputation using chained
equations: issues and guidance for practice. Stat Med. 2011;30(4):377–99. 15. Schafer JL. Analysis of incomplete multivariate data. London: Chapman &
Hall; 1997.
16. Bernaards CA, Belin TR, Schafer JL. Robustness of a multivariate normal approximation for imputation of incomplete binary data. Stat Med. 2007; 26(6):1368–82.
17. van Buuren S, Brand J, Groothuis-Oudshoorn C, Rubin D. Fully conditional specification in multivariate imputation. J Stat Comput Simul. 2006;76(12): 1049–64.
18. von Hippel PT. Regression with missing Ys: an improved strategy for analyzing multiply imputed data. Sociol Methodol. 2007;37(1):83–117. 19. Sullivan TR, Salter AB, Ryan P, Lee KJ. Bias and precision of the "multiple
imputation, then deletion" method for dealing with missing outcome data. Am J Epidemiol. 2015;182(6):528–34.
20. Lee KJ, Carlin JB. Multiple imputation for missing data: fully conditional specification versus multivariate normal imputation. Am J Epidemiol. 2010; 171(5):624–32.
21. Schafer JL, Olsen MK. Multiple imputation for multivariate missing-data problems: a data analyst's perspective. Multivar Behav Res. 1998;33(4):545–71. 22. Romaniuk H, Patton GC, Carlin JB. Multiple imputation in a longitudinal
cohort study: a case study of sensitivity to imputation methods. Am J Epidemiol. 2014;180(9):920–32.
23. Yelland LN, Salter AB, Ryan P. Performance of the modified Poisson regression approach for estimating relative risks from clustered prospective data. Am J Epidemiol. 2011;174(8):984–92.
24. Miettinen OS, Cook EF. Confounding: essence and detection. Am J Epidemiol. 1981;114(4):593–603.
25. Barros AJ, Hirakata VN. Alternatives for logistic regression in cross-sectional studies: an empirical comparison of models that directly estimate the prevalence ratio. BMC Med Res Methodol. 2003;3:21.
26. Bartlett JW, Seaman SR, White IR, Carpenter JR. Multiple imputation of covariates by fully conditional specification: accommodating the substantive model. Stat Methods Med Res. 2015;24(4):462–87.
27. Little RJA. Regression with missing X's: a review. J Am Stat Assoc. 1992; 87(420):1227–37.
28. Graham JW, Donaldson SI. Evaluating interventions with differential attrition: the importance of nonresponse mechanisms and use of follow-up data. J Appl Psychol. 1993;78(1):119–28.
29. Groenwold RH, Donders AR, Roes KC, Harrell FE Jr, Moons KG. Dealing with missing outcome data in randomized trials and observational studies. Am J Epidemiol. 2012;175(3):210–7.
30. White IR, Carlin JB. Bias and efficiency of multiple imputation compared with complete-case analysis for missing covariate values. Stat Med. 2010; 29(28):2920–31.