Biogeosciences, 7, 2477–2487, 2010 www.biogeosciences.net/7/2477/2010/ doi:10.5194/bg-7-2477-2010
© Author(s) 2010. CC Attribution 3.0 License.
Biogeosciences
Shadow analysis of soil surface roughness compared to the
chain set method and direct measurement of micro-relief
R. Garc´ıa Moreno1, M. C. D´ıaz ´Alvarez2, A. M. Tarquis2, A. Paz Gonz´alez1, and A. Saa Requejo2
1Facultad de Ciencias, Universidad de La Coru˜na- UDC, Spain
2CEIGRAM (Centre for Studies and Research on Agricultural and Environmental Risk Management),
Universidad Polit´ecnica de Madrid, Spain
Received: 17 December 2009 – Published in Biogeosciences Discuss.: 10 February 2010 Revised: 1 July 2010 – Accepted: 3 August 2010 – Published: 18 August 2010
Abstract. Soil surface roughness (SSR) expresses soil sus-ceptibility to wind and water erosion and plays an important role in the development and the maintenance of soil biota. Several methods have been developed to characterise SSR based on different methods of acquiring data. Because the main problems related to these methods involve the use and handling of equipment in the field, the present study aims to fill the need for a method for measuring SSR that is more re-liable, low-cost and convenient in the field than traditional field methods. Shadow analysis, which interprets micro-topographic shadows, is based on the principle that there is a direct relationship between the soil surface roughness and the shadows cast by soil structures under fixed sunlight con-ditions. SSR was calculated with shadows analysis in the laboratory using hemispheres of different diameter with a di-verse distribution of known altitudes and a surface area of 1 m2.
Data obtained from the shadow analysis were compared to data obtained with the chain method and simulation of the micro-relief. The results show a relationship among the SSR calculated using the different methods. To further improve the method, shadow analysis was used to measure the SSR in a sandy clay loam field using different tillage tools (chisel, tiller and roller) and in a control of 4 m2surface plots divided into subplots of 1 m2. The measurements were compared to the data obtained using the chain set and pin meter methods. The SSR measured was the highest when the chisel was used, followed by the tiller and the roller, and finally the control, for each of the three methods. Shadow analysis is shown to be a reliable method that does not disturb the measured surface, is easy to handle and analyse, and shortens the time
Correspondence to: R. Garc´ıa Moreno
involved in field operations by a factor ranging from 4 to 20 compared to well known techniques such as the chain set and pin meter methods.
1 Introduction
Soil surface roughness (SSR) describes the micro variations in the surface elevation across a field that result mainly from tillage practices and soil texture. SSR is a major factor influ-encing wind and water erosion (Vidal et al., 2005). Because SSR defines the potential for soil particle retention, emission and saltation, SSR can also be used to predict wind erosion (Hagen, 1988; Potter et al., 1990; Zobeck, 1991). Marques da Silva and Soares (2000) showed that different tillage tools have different impacts on the translocation of the soil sur-face. Tillage operations reduce erosion and increase the ori-ented and random roughness (Saleh, 1994). Conservation practices during tillage are beneficial for avoiding the loss of organic matter and nutrient-rich topsoil, increasing soil pro-ductivity, improving air and water quality and diversifying fauna (mainly microorganisms) in soils (Cihacek et al., 1993; Saxton, 1995; Larney et al., 1999; Or et al., 2007).
SSR, which is mainly randomly induced by different tillage tools, increases the number and variability of microor-ganisms that can grow in a particular ecosystem by increas-ing the porosity of soils and resultincreas-ing flow of percolatincreas-ing wa-ter in the vadose zone. Microbial activity is very important to a large range of soil functions and most biogeochemical cycles and promotes the development of all other living or-ganisms (Or et al., 2007; Dighton et al., 1997).
2478 R. Garc´ıa Moreno et al.: Shadow analysis of soil surface roughness and benefit the crop. These benefits are mainly due to the
promotion of decomposition processes that distribute nutri-ents in the rooting zone.
Young et al. (2001) corroborated the previous studies. They found that the management practice of increasing soil aggregation improves to the structure of soils and that this process promotes the presence of macropores that positively influence the ecosystems. They showed that the two major operations influencing the aggregation of soils are erosion and tillage, and these processes increases the SSR and the activity, number and diversity of soil biota (Young and Ritz, 2000; Diaz-Zorita et al., 2002; Knapen, 2007; Boxell and Drohan, 2009). Langmaack et al. (2001) demonstrate that as soil surface roughness increases there is an increase in the mesofaunal activity, which plays a very important role in both the rehabilitation of sealed soil surfaces and the re-structuring of soil, particularly after soil compaction.
For all these reasons, the assessment of SSR is an im-portant element for evaluating the development and diver-sity of living organisms in soils. The quantification of soil surface roughness requires methodologies capable of accu-rately measuring the soil micro relief as well as obtaining and analysing the data easily in the field (Garc´ıa Moreno, 2006; Garc´ıa Moreno et al., 2008a).
The most popular methods used to obtain soil surface roughness data are well documented. Among these meth-ods are the pin meter and profile meter methmeth-ods (Burwell et al., 1963; R¨omkens et al., 1986), stereo-photography (Wag-ner, 1995; Zribi et al., 2000), laser scanning (Huang, 1998; Darboux and Huang, 2003), the chain method (Saleh, 1993; Merrill et al., 2001) and acoustic backscatter (Oelze et al., 2003).
The pin meter is simple, consisting of a row of equally spaced probes lowered onto the ground surface. The pin po-sition is registered either electronically or photographically and later digitalised (Burwell et al., 1963; Podmore and Hug-gins, 1981; Wagner and Yiming, 1991). The main disadvan-tage is the potentially destructive effect of the pins, which could prevent any further measurements. The main advan-tage is its simplicity and ease of handling under extreme field conditions. This method gives reliable data without being ex-pensive.
The automated laser micro-relief meter non-destructively measures SSR. However, the meter is expensive, somewhat bulky and covers only a small area at a time (R¨omkens et al., 1987; Flanagan et al., 1995). The laser technique is lim-ited when used outdoors because of interference from other sources of light (Huang, 1998; Huang and Bradford, 1992; Darboux and Huang, 2003).
The acoustic back-scanner is a non-contact method pro-posed by Oelze et al. (2003) without any further published development.
The first use of a roller chain to measure soil surface roughness was published by Saleh (1993), who showed that a roller chain is more convenient for measuring soil surface
roughness than a pin meter. The validity of soil roughness measurements obtained from the use of a single roller chain was later questioned by Skidmore (1997) and Saleh (1997) because of possible scale insensitivity, which would lead to invalid measurements. However, Merrill (1998) demon-strated theoretically that using a set of chains with different lengths that are linked in geometric progression would over-come this problem. Merrill also concluded that data from chain sets give information about the fractal character of soils surface roughness as an expression of multiscale nature of size distribution of the largest size roughness elements.
According to Merrill et al. (2001) soil surface roughness must be a multiscalar and scale-continuous erodibility factor and thus, the use of the chain set method provides a univer-sally accessible and practical soil surface device. To show the results the author used a set of six chains to measure soil surface roughness. The chains were built from ANSI (Amer-ican National Standars Institute) roller chain. Plotting the regression of chain roughness (CR) versus the log of the link length of each chain, the authors showed that a decrease in had occurred in the absolute slopes after erosion. This decay seems to be associated more with a decrease in the smaller roughness elements than in the larger ones, and the experi-ment demonstrates the ability of the chain set to show qual-itative changes in soil surface roughness as a result of ero-sion. Also, the authors concluded that the slope increases as the degree of the fractal character of soil surface roughness increases.
Jester and Klik (2005) compared four methods to measure soil surface roughness, including two contact methods (pin meter and single roller chain) and two methods using non-contact devices (laser scanning and photogrammetry). The authors showed that each technique has its field of applica-tion. Contact devices, particularly the roller chain, are ex-cellent for use in field measurements; however, they produce disturbances in the soil and have poor resolution. The laser scanner is excellent when used in lab experiments, but be-cause of light interferences, field operation is very difficult and often inaccurate. The authors suggested that photogram-metry is an interesting technique that could be developed for use in both field and lab work because it consumes less time for data acquisition.
R. Garc´ıa Moreno et al.: Shadow analysis of soil surface roughness 2479 and Popham, 1997, 1998; Hansen et al., 1999; Kamphorst et
al., 2000; Vivas Miranda and Paz Gonzalez, 2002; Vidal et al., 2005, 2006; Garc´ıa Moreno et al., 2008b).
The authors have worked on the development of a new technique for measuring soil surface roughness that would be more reliable, reproducible and convenient to use in the field than existing procedures (Garc´ıa Moreno et al., 2008a, b, and c).
First, the authors (Garc´ıa Moreno et al., 2008a) validated the method in the laboratory. Because the relationship in a controlled situation between coefficient of variation (CV) and standard deviation (SD) and the percentage of shadows would be similar regardless of the geometric shape used, simple prisms were chosen. The test consisted of measur-ing the shadows cast when artificial light was projected on a set of prisms and correlating the percentage of shadows to SD and CV values found for a series of controlled heights and SSR distributions. After the laboratory validation, the method was used in the field and the results of shadow anal-ysis were compared to the SSR values recorded with a pin meter. The tests were conducted on 4 m2 sandy loam and sandy clay loam plots divided into 1 m2subplots tilled with three different tools: chisel, tiller and roller. The roller is the most commonly used tilling tool by farmers in central Spain. Soils had low organic matter content and humidity and were very light in colour. Under the very bright sun-light that characterises the region studied, the rough surface profile of the soil, including any lumps or clods, casts shad-ows which are very dark and readily distinguishable from the much lighter coloured soil, ensuring the generation of a bi-modal histogram.
The highly significant correlation between the statistical indexes and shadow analysis results obtained in both the lab-oratory and the field for all soil – tool combinations proves that both variability (CV) and dispersion (SD) are accommo-dated by the new method, which requires between 1/12 and 1/20 of the field operations time required by the pin meter technique. The relationship between both indexes is well de-veloped in previous studies (Garcia Moreno et al., 2008a), where evaluating the surface roughness generated by prisms, authors found that CV expresses soil surface roughness vari-ability irrespective of height, whereas SD expresses total dis-persion of the height values.
In order to further prove the method, the results of shadow analysis on hemispheres were compared to results obtained from the chain set method and the direct measurements of micro relief using the statistical indexes SD and CV. The hemispheres were chosen in the lab experiments to try more complicated geometries (Garc´ıa Moreno et al., 2008a) and because they are similar in shape to soil particles found in the field. The percentage of shadows as an expression of SSR was compared in the field to the same indexes using the chain method and pin meter, which are the two most com-monly used methods in field, in a darker soil than the one used previously. The validity of the method in the field is
Figures
igure 1 F
Figure 2.
1 Fig. 1. Hemispheres with 40, 85 and 200 mm diameters (top to
bot-tom) for shadows analysis laboratory experiments including (left) images without change, and (right) black and white images used to generate the histogram with percentage of shadows.
independent of the method used, and the time required to ob-tain the data is reduced with the new method by a factor of 4 compared to the chain set method.
2 Methods
2.1 Experimental setup 2.1.1 Laboratory validation
The methodology for measuring surface roughness in the lab-oratory was tested on a 1 m2surface filled with hemispheres with diameters of 200, 85 and 40 mm (Fig. 1). The first tri-als were done with artificial light. The percentage of shad-ows was measured for shadshad-ows cast by a lamp at an angle of 45◦. This angle was chosen to simulate the daylight angle at a fixed daytime and conditions that prevail in the field at the same time each day. Because the source of the artificial light was near to the hemispheres during the laboratory test-ing, more tests were done outdoors using sunlight. Shadow analysis methodology is further explained in Sect. 2.2.
A preliminary study of the influence of solar angle on the shadows was done on various days. Photographs were taken with a Kodak DC 4800 digital camera from a position paral-lel to and at a distance of one metre from the hemispheres. These conditions were kept constant throughout.
2480 R. Garc´ıa Moreno et al.: Shadow analysis of soil surface roughness
Figures
igure 1 F
Figure 2.
1 Fig. 2. Shadow analysis of (left to right) sandy clay loam soil tilled
with chisel, tiller and roller, and untilled.
was subsequently obtained for each pattern. Laboratory mea-surements were also taken with a chain set constructed from ANSI standard roller chains. The methodology is further de-veloped in Sect. 2.4.
2.1.2 Experimental plots
A 4 m2sandy clay loam plot was divided into 1 m2subplots. Three of the subplots were tilled using one of the three tools most commonly used by farmers in central Spain (the chisel, tiller and roller), and the other plot was left untilled as a con-trol. All SSR measurements were taken immediately after tillage with the different tools to preclude interference from other factors.
The soil had a darker colour than in previous work to ver-ify the absence of interference from the soil colour (Garcia Moreno et al., 2008a), without considering either the possi-ble effects of organic matter or the moisture. Soil colour was measured by a Minolta Chromameter calibrated with Mun-sell Colour Charts (MunMun-sell Color Co., 1998).
The experimental field was located on the Campus of the Agricultural Engineering Faculty (E.T.S.I.A.) of the Poly-technic University of Madrid (U.P.M.). The measures SSRs are illustrated in Fig. 2.
During the spring of 2009, when the field experiment was conducted, no rain was recorded, and the percentage of soil humidity was very low. The plots were sufficiently close to each other to ensure that the photos were taken at the same time of the day after each tillage operation, to assure the an-gle of the daylight was the same for all the cases. The main soil characteristics were determined by the Soil Science So-ciety of America (1996) methodology (Table 1).
2.2 Field shadows analysis
In the field, the newly developed shadow analysis technique was used to measure the soil surface roughness index in an area of 4.0 m2, the same plot size used for pin meter trials. The chain method was used in the same plots as the shadows analysis, and the pin meter was used in neighbouring plots. The datasets obtained with the three techniques were com-pared to determine the suitability of shadow analysis.
The measurements for shadow analysis were obtained by taking images during three days with an incident angle of light of 45◦. The exact hour was calculated according to the location and the day of the year, assuring a constant angle
for the incident light, based on the sun declination equation developed by Spencer (1971). This angle was verified before images were taken.
Shadow analysis was developed on the assumption that shadows cast at a given angle in bright daylight are propor-tional to soil micro relief. The 4.0 m2 plots used for each soil and tillage treatment were divided into four 1.0 m2 sub-plots for the digitised photographs, which were subsequently reassembled. Duplicate images were taken to generate suffi-cient data to apply statistical analysis to detect the differences amongst different combinations of soil type and tillage tool. A frame of 1 m2was used to take the images and assure that the same area was chosen for every subplot reading.
The camera was set on a Slik tripod to photograph the en-tire 1.0 m2area in a single frame. This type of tripod was chosen because it provided the required distance. The cam-era lens was placed parallel to the soil surface at a height of 1.65 m. The shadows cast by the soil micro relief were analyzed with byte map histograms using Corel Draw Photo Paint (©Corel Corporation 1992–1996) software. After iden-tification on the histogram, the shaded points were converted to a black surface against a white background. The shadow index was then computed as the percentage of black over the total numbers of pixels (Fig. 3). The focal angle and the dis-tance from the lens to the ground were constant throughout to ensure that the resolution would be the same in all the pictures. The methodology was the same as that used to cal-culate percentage of shadows for the hemispheres.
2.3 Chain method
The laboratory and field measurements were also taken with a chain set constructed from ANSI standard roller chains (Fig. 4). All of the chains were 1 m long. The chains had different links of 0.476 cm, 0.953, 1.91 cm, 3.81 cm, 7.62 cm and 15.24 cm. The last four chains were constructed by weld-ing 2, 4, 8 and 16 of the 0.935 cm links (Fig. 4). The soil sur-face roughness was calculated by CR as a log function of the link length, where L1 is the given length of a chain and L2 is the horizontal distance between chain ends when the same chain is placed across a surface (Merrill et al., 2001; Saleh, 1993).
CR=
1−L2
L1
·100 (1)
[image:4.595.50.285.62.119.2]R. Garc´ıa Moreno et al.: Shadow analysis of soil surface roughness 2481
Table 1. Properties of soil.
Conductivity Organic Analysis of texture Textural Class
Site (dS/m) matter (%) Colour pH USDA (%) USDA
Dry Sand Silt Clay
E.T.S.I.A. – U.P.M. 2.14±0.10 1.76±0.12 0.1 Y 8.04±0.20 57±1 17±2 26±1 Sandy
9.6/0.2 clay loam
[image:5.595.328.526.201.339.2]Three samples per subplot.
Figure 3.
Figure 4 .
2
[image:5.595.82.253.204.355.2]Fig. 3. Black and white image of a sandy loam soil tilled with tiller.
Figure 3.
Figure 4 .
2 Fig. 4. Chain set used to measure soil surface roughness on soil that
has been tilled with a chisel.
associated with oriented and random roughness. Once the differences were measured, only the perpendicular readings were compared to the shadows analysis and the statistical in-dexes obtained from the pin meter because the methods ac-count for total soil surface roughness.
2.4 Experimental pin meter
The pin meter method was selected as a reference for the field shadow analysis measurements because of the reliability of this technique compared to laser technology, which may be
Figure 5.
3
Fig. 5. Pin-meter used to measure soil height every 20 mm.
distorted by other sources of light (Garc´ıa Moreno, 2006). A pin meter was specifically designed on the basis of a review of the literature (Burwell et al., 1963; Podmore and Huggins, 1981; Wagner and Yiming, 1991) and in keeping with the plot size (1 m2)(Fig. 5). The prototype consisted of a row of 35-cm high pins placed in a frame in which they could slide up or down to conform to surface irregularities. The pin heads were marked with a blue band to better visualise their respective positions when in contact with the soil. The device was designed to be moved horizontally without dis-turbing the pin patterns. The total height of the instrument, which was made of aluminium, was 85 cm. The pins were set against a white backing to ensure the visibility of the blue bands. With rows containing 50 pins spaced at 20 mm inter-vals, each x-axis reading covered one full metre of ground. The y-axis readings were taken by sliding the instrument across the one square metre plots. The cells on the resulting grid measured 20×20 mm, and a total of 2500 readings were taken per square metre. An earlier study (Garc´ıa Moreno, 2006) showed this spacing to be sufficient to measure the surface roughness of the three types of soil.
[image:5.595.74.260.395.539.2]2482 R. Garc´ıa Moreno et al.: Shadow analysis of soil surface roughness same camera used for the shadows analysis was used to
record pin positions as micro-topographic readings. The lens was focused on a point at the centre of the pin meter.
The field procedure consisted of placing the pin meter on the surface of a 1.0 m2patch of soil and capturing the initial pin positions and all subsequent positions after each 20 mm shift along the y-axis. The camera was initially placed at a distance of 2 m from the pin meter. The x-axis measurements were the positions of the 50 pins. The instrument was moved along the y-axis over two rails perforated at 20 mm intervals, where the readings were taken, and was fitted with a hand brake to halt the process when soil was suspected to be on a slight grade.
2.5 Statistical indexes
Initially, random roughness (RR) (Allmaras et al., 1966; Cur-rency and Lovely, 1970) was chosen because it is the index most commonly used in SSR studies. This index is defined to be the standard deviation for a line parallel to the direc-tion of tillage. The index is hereafter termed SD (standard deviation) because the goal of the present study is to evalu-ate soil surface roughness for the entire area. The SD index, which reflects both random and oriented soil roughness, is calculated as:
SD=
v u u t
1
N−1
N
X
i=1
[Z(xi)−Z]2 (2)
wherexiis the location of theith measurement andZ(xi)is
the elevation,Zis the average value of setZ(xi)andNis the
number of data points (10 000 in this study).
A second index, the coefficient of variation (CV), was used in addition to standard deviation:
CV=SD
Z
·100 (3)
The SD field results are in cm, and CV is a percentage. Various regressions were applied to compare results from shadows analysis, chain roughness and the statistical indexes from the pin meter. TheR2values for regressions of percent-age of shadows against CV, SD and CR values for individual set members are used to compare the similarity of different expressions. Because duplicate images were taken of each 1 m2 subplot, the statistical design included 8 samples per tillage tool for each method.
3 Results and discussion
3.1 Relationship between roughness indexes and shadows analysis for experimental hemispheres The percentage of shadows projected by hemispheres of dif-ferent diameter (40, 85 and 200 mm) was compared to the measurements obtained with the chain set and to statistical
indexes SD and CV, which represent the direct measurement of micro relief or the digital elevation model.
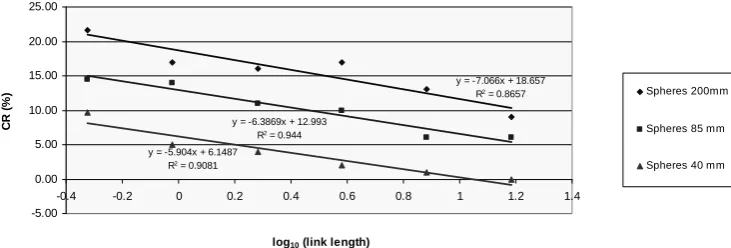
The CR for the different diameter of the hemispheres is plotted against log10of the chain set member linkage length
for each resulting micro relief (Fig. 6) for each diameter of hemispheres. The largest slope values are obtained for the largest hemisphere diameter, and the value of this parameter decreases as the diameter becomes smaller. In this sense, the results obtained with the chain method express incremental increases in roughness as the diameter of the roughness el-ements increases. The results of the chain set method agree with the shadows analysis.
The measurements for shadow analysis were obtained by considering an incident angle of light of 45◦. The exact hour was calculated according to the location and the day of the year, assuring a constant angle for incident light. The angle was always verified before taking images. The results, ex-pressed as percentage of shadows, are compared with the SD and CV index obtained from real micro relief of the hemi-spheres (Fig. 7). The overall results from the three methods are consistent with the micro relief observed from the differ-ent methodologies.
The results for the shadow analysis and the digital eleva-tion model, expressed as the indexes SD and CV, increase as the diameter increases. In both cases, the roughness is the largest with the 200 mm spheres and smallest with the 40 mm spheres. Larger structures produce larger SSR patterns than smaller structures, even if smallest diameter is represented by a larger number of structures. Larger structures show more fractal character according to the slope obtained than smaller structures.
The measurements obtained from the three methods fol-low the same pattern in relation to the expected surface roughness depending on the diameter of the hemispheres as shown by the R2 values of multiple regressions. Table 2 shows the results of regressions for the percentage of shad-ows prediction by SD, CV and CR values for individual chain set members in quadratic binomial form. The values obtained in Table 2 from the direct measurement of micro-relief, ex-pressed as SD and CV indexes, and the chain set results for most of the values are more than 90% or 95% correlated with the values obtained from the shadows analysis when used in controlled reliefs with solar light.
3.2 Field results from chain set methodology
After comparing the indexes and the percentage of shadows with a surface roughness scenario, the same indexes were compared using the resulting surface roughness of a sandy clay loam after tilling with a chisel, tiller or roller. These results were compared to the control.
R. Garc´ıa Moreno et al.: Shadow analysis of soil surface roughness 2483 CR vs. log10 (link length) depending on diameter of spheres
y = -7.066x + 18.657 R2 = 0.8657
y = -6.3869x + 12.993 R2 = 0.944
y = -5.904x + 6.1487 R2 = 0.9081
-5.00 0.00 5.00 10.00 15.00 20.00 25.00
-0.4 -0.2 0 0.2 0.4 0.6 0.8 1 1.2 1.4
log10 (link length)
CR
(
%
) Spheres 200mm
Spheres 85 mm
Spheres 40 mm
Figure 6.
[image:7.595.114.480.64.188.2]4
Fig. 6. The CR, Chain Roughness, obtained by the chain set method in the laboratory as a function of the diameter of the hemispheres and
link length.
Table 2. R2values of indexes for laboratory hemispheres. Results are obtained from regressions between percentage of shadows and the
micro relief statistical indexes, CV and SD, and a single chain set, expressed as chain roughness (CR).
R2values SD CV CR0.47 CR0.95 CR1.91 CR3.81 CR7.62 CR15.24
Percentage 0.99 0.99 0.99 0.91 0.98 0.99 0.99 0.95
of shadows
HEMISPHERES: STATISTICAL INDEXES, CV AND SD, AND % SHADOWS
14.39 17.59 22.35
111.70
120.32
141.99
7.93 8.95 10.48
0.00 20.00 40.00 60.00 80.00 100.00 120.00 140.00 160.00
40 85 200
DIAMETER OF HEMISPHERES (mm)
S
D
(m
m
),
C
V
(%
),
S
H
AD
O
W
S
(%
)
SD CV
[image:7.595.47.289.308.468.2]% SHADOWS
Figure 7.
5
Fig. 7. Shadows analysis and statistical indexes for laboratory tests
including CV, coefficient of variation, and SD, standard deviation, for percentage of shadows as a function of the diameter of the hemi-spheres.
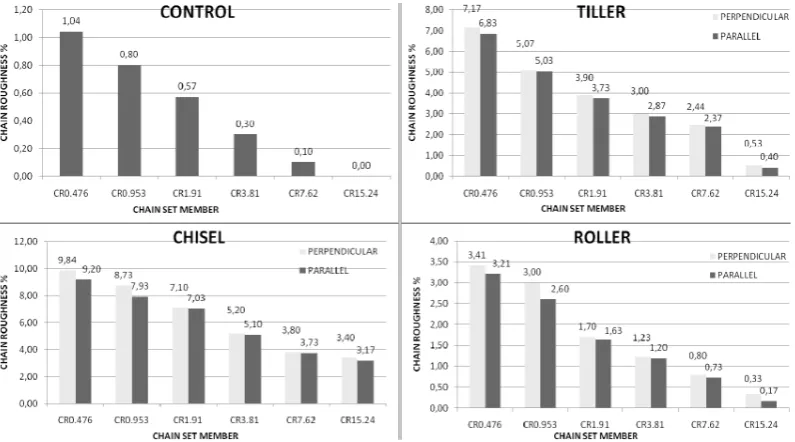
In all the cases, the perpendicular readings are higher than parallel results, but the difference in magnitude is low. The tool seems to be more influence by the random roughness, and the ridges produced by each tool are low. These results can be compared to the images of soil after passing the differ-ent tools (Fig. 2). In all the cases the oridiffer-ented roughness ex-pressed as geometric pattern is only observed when the roller was used. However, in this specific case, the micro relief is not high enough to show a difference in comparison to the random roughness alone.
In order to compare the chain roughness for all the till-ing tools to the percentage of shadows and statistical indexes measured with a pin meter, perpendicular measurements of chain set readings were used to account for random and ori-ented roughness.
Figure 9 shows the chain roughness values plotted against log10 of the chain set member linkage length for the micro
relief resulting from each tillage tool. The regression param-eters are compared for each case, and the value of the slope increases as the soil surface roughness increases. In this par-ticular case, soil tilled with a chisel presented the highest CR value, followed by the tiller, roller and control. A plot of all of the cases shows that as the soil surface roughness in-creases, the value of the chain roughness increases. At the same time, the value of the chain roughness for the chain member set with smaller linkage members is higher than that for the larger chain set members, demonstrating the depen-dence of chain roughness on scale. As the scale decreases, the measures for the roughness increase because the parame-ter is on the order of mm.
3.3 Field results from shadow analysis findings
2484 R. Garc´ıa Moreno et al.: Shadow analysis of soil surface roughness
Figure 8.
[image:8.595.100.498.62.283.2]6
Fig. 8. Chain roughness after tilling with different tools and for the control. Data were measured perpendicular and parallel to tool direction.
CR vs log10 (link length)
y = -4.6411x + 8.3439 R2 = 0.9774
y = -2.1329x + 2.6651 R2 = 0.9606
y = -0.7362x + 0.9889 R2 = 0.9778
y = -3.9829x + 5.3998 R2 = 0.9658
0.00 2.00 4.00 6.00 8.00 10.00 12.00
-0.40 -0.20 0.00 0.20 0.40 0.60 0.80 1.00 1.20 1.40
log10 (link lentgh)
CR
(%
)
Chisel
Tiller
Roller
[image:8.595.112.484.326.475.2]Control
Figure 9.
[image:8.595.47.289.524.617.2]7
Fig. 9. Comparison of chain roughness measured by the chain set method for different tilling methods.
8 Field results. Statistical indexes, CV and SD, and percentage of shadows
60.17
34.58
30.28
15.98
8.93 6.64
44.16
25.64
21.40
15.34
0.00 10.00 20.00 30.00 40.00 50.00 60.00 70.00
Chisel Tiller Roller Control
Tilling tool
SD
(m
m
),
C
V
(%
),
Sh
a
d
o
w
s
(%
)
CV SD % SHADOWS
Figure 10.
Fig. 10. Shadow analysis and pin meter results in the field,
includ-ing percentage of shadows, CV, SD, and surface roughness mea-surements depending on tilling tools. The control was measured using shadows analysis and the chain set method.
The shadow analysis method proved to be valid for the semi-arid soils studied. The moisture and organic matter con-tent of these soils do not impact the soil colour or the shad-ows associated with soil surface roughness. The bright mid-day sunlight guaranteed that the resulting histogram would be bimodal. Image resolution was consistent throughout cause both the angle of incident light and the distance be-tween the camera lens and the soil were kept constant.
The chisel, followed by tiller, roller and control, in that order, generated the most variable micro relief. The results obtained for the two indexes were similar in all cases to each other and to the chain roughness obtained for each tillage treatment.
R. Garc´ıa Moreno et al.: Shadow analysis of soil surface roughness 2485
Table 3. R2values of indexes for sandy clay loam soil. Results obtained from regressions between percentage of shadows and the micro
relief statistical indexes, CV and SD, and a single chain set, expressed as chain roughness (CR).
R2values SD CV CR0.47 CR0.95 CR1.91 CR3.81 CR7.62 CR15.24
Percentage of shadows 0.99 0.97 0.98 0.98 0.98 0.97 0.95 0.97
analysis for each tillage tool is more than 95%, correlated to the results obtained for chain roughness of each individual chain member, and the data show no difference based on the dimension of the linkage of the individual set members.
Overall, the soil surface roughness findings for the differ-ent indexes were as expected for each tillage tool system. The SD and CV indexes found for the pin meter and the chain roughness field measurements constituted the standard used to evaluate the effectiveness of the newly developed shadow analysis method for determining soil surface roughness. The results obtained with the new method are highly correlated to the other well-developed methodologies for evaluating soil surface roughness. An added advantage found for shadow analysis was that data collection with the pin meter technique took from 120 to 200 min, compared to the 10 min needed to obtain the shadow analysis photographs. Data collection with the chain set methodology took a maximum of 40 min. Therefore, the time needed to collect field data with the shad-ows analysis was between 4 and 20 times shorter than the time required for the chain set method, depending on whether pin meter positioning problems were encountered.
4 Conclusions
Understanding soil surface roughness is important for pre-venting wind and water erosion and for assuring an appro-priate environment for the development and maintenance of soil biota. Practices promoting an increase in soil surface roughness are beneficial for developing ecosystems with a wide diversity of microorganisms. With accurate measure-ments, soil surface roughness can be use as an indicator of the health of ecosystems.
This study was conducted to validate the shadow analy-sis method in a darker soil than in previous works and to compare the new method with the chain set and pin meter methods. Comparison to the two well known methodolo-gies provides a basis for using shadows analysis alone in fur-ther studies, although the exact conditions used in the present study may be necessary.
This non-contact method was developed to be as reliable as the traditional methods but with data that is easier to ac-quire and analyse. The new method also has low develop-ment and maintenance costs and is adaptable to climate and soil conditions prevailing in arid and semi-arid regions where
moisture, organic content and weather conditions ensure the generation of a bimodal histogram.
The SSR obtained with this new method, shadow analy-sis, were compared to the results found with a pin meter and a chain set technique. Field and laboratory data show that shadow analysis yields results significantly correlated to re-sults from the pin meter and chain set methodologies, but shadow analysis has the advantage that the time invested in gathering field data was 4 to 20 times shorter. Image inter-pretation is also less time-consuming, and the instruments needed are easier to use and more portable, which is a major advantage when working in difficult field conditions.
The shadows analysis method includes the variability and dispersion components of surface roughness that are highly correlated to CV and SD, respectively. The SSR measure-ments using this new method are also highly correlated to those obtained using the chain set methodology.
Shadow analysis provides a very good measure of surface roughness in soils with properties that generate a bimodal histogram because of their uniform colour with respect to shadows. This uniformity is a result of both the intrinsic soil properties and weather conditions.
The method should be validated prior to measuring surface roughness in soils that have irregularly distributed moisture and organic matter or are located in places with dim daylight. Dark or vivid and unevenly-distributed colours interfere with the roughness-induced shadows and generate a non-bimodal colour distribution. Therefore, the method described in this paper must be verified under the conditions prevailing in each case. The present study constitutes a continuation of the val-idation of the shadow analysis technique, which must be fur-ther studied under more extreme field conditions.
The present study shows that the shadows analysis methodology can be used alone if conditions are similar to those of the present study, and the results offer the same reli-ability as those of the chain set and pin meter methodologies.
Acknowledgements. The authors wish to thank the staff working
on the experimental fields property of the School of Agricultural Engineering, Polytechnic University of Madrid, for his cooperation in conducting the field experiments. This study was possible by the economic support of Xunta de Galicia through the Angeles Alvarino Program.
2486 R. Garc´ıa Moreno et al.: Shadow analysis of soil surface roughness References
Allmaras, R. R., Burwell., R. E., Larson W. E., and Holt, R. F.: Total porosity and random roughness of the interrow zone as in-fluenced by tillage, USDA Conserv. Res. Rep., 7, 1–22, 1966. Boxell, J. and Drohan, P. J.: Surface soil physical and hydrological
characteristics in Bromus tectorum L. (cheatgrass) vs. Artemisia tridentata Nutt. (big sagebrush) habitat., Geoderma, 149, 305– 311, 2009.
Bullock, M. S., Larney, F. J., Izaurralde, R. C., and Feng, Y.: Over-winter Changes in Wind Erodibility of Clay Loam Soils in South-ern Alberta, Soil Sci. Soc. Am. J., 65, 423–430, 2001.
Burwell, R. E., Allmaras, R. R., and Amemiya, M.: A field mea-surement of total porosity and surface microrrelief of soils, Soil Sci. Soc. Am. Proc., 27, 697–700, 1963.
Cihacek, L. J., Sweeney, M. D., and Deibert, E. J.: Characteriza-tion of wind erosion sediments in the Red River Valley of North Dakota, J. Environ. Qual., 22, 305–310,1993.
Currence, H. D. and Lovely, W. G.: The analysis of soil surface roughness, Trans. ASAE, 13, 710–714, 1970.
Darboux, F. and Huang, C.-H.: An instantaneous-profile laser scan-ner to measure soil surface microtopography, Soil Sci. Soc. Am. J, 67, 92–99, 2003.
Diaz-Zorita, M., Perfect, E., and Grove, J. H.: Disruptive methods for assessing soil structure, Soil Till. Res., 64, 3–22, 2002. Dighton, J., Jones, H. E., Robinson, C. H., and Beckett, J.: The
role of abiotic factors, cultivation practices and soil fauna in the dispersal of genetically modified microorganisms in soils, Appl. Soil Ecol., 5, 109–131, 1997.
Flanagan, D. C., Huang, C.-H., Norton, L. D., and Parker, S. C.: Laser scanner for erosion plot measurements, Trans. ASAE, 38, 703–710, 1995.
Garcia Moreno, R.: Desarrollo de una metodolog´ıa para la medici´on de la rugosidad del suelo, Ph.D. Dissertation, Polytechnic Uni-versity of Madrid (UPM), 120 pp., 2006.
Garc´ıa Moreno, R., Saa Requejo, A., Tarquis, A. M., Barrington, S., and D´ıaz ´Alvarez, M. C.: A shadow analysis method to measure soil surface roughness, Geoderma, 146, 201–208, 2008a. Garc´ıa Moreno, R., D´ıaz ´Alvarez, M. C., Saa Requejo, A., and
Tar-quis, A. M.: Soil surface roughness analyzed as a multifractal measure, Vadose Zone J., 7, 512–520, 2008b.
Garc´ıa Moreno, R., D´ıaz ´Alvarez, M. C., Tarquis, A .M., Barring-ton, S., and Saa Requejo, A.: Tillage and soil type effects on soil surface roughness at semiarid climatic conditions, Soil and Till. Res., 98(1), 35–44, 2008c.
Hagen, L. J.: New wind erosion model developments in the USDA. In 1988 Wind Erosion Conference Proceedings, Texas Tech. Uni-versity, Lubbock, 11–13 April, 1988.
Hansen, B., Schjønning, P., and Sibbesen, E.: Roughness indices for estimation of depression storage capacity of tilled soil surfaces, Soil Till. Res., 52, 103–111, 1999..
Huang, C.-H.: Quantification of soil microtopography and surface roughness, Fractals in soil science, edited by: Baveye, P., Par-lange, J. Y., and Stewart, B. A., Advances in Soil Science, CRC, 1998.
Huang, C.-H. and Bradford, J. M.: Applications of a laser scanner to quantify soil microtopography, Soil Sci. Soc. Am. J., 56, 14–21, 1992.
Jester, W. and Klik, A.: Soil surface roughness measurement-methods, applicability, and surface representation, Catena, 64,
174–192, 2005.
Kamphorst, E. C., Jetten, V., Gu´erif, J., Pitk¨anen, J., Iversen, B. V., Douglas, J. T., and Paz, A.: Predicting depressional storage from soil surface roughness, Soil Sci. Soc. Am. J., 64, 1749–1758, 2000.
Knapen, A., Poesen, J., De Baets, J. S.: Seasonal variations in soil erosion resistance during concentrated flow for a loess-derived soil under two contrasting tillage practices, Soil Till. Res., 94, 425–440, 2007.
Langmaack, M., Schrader, S., and Helming, K.: Effect of meso-faunal activity on the rehabilitation of sealed soil surfaces, Appl. Soil Ecol., 16, 121–130, 2001.
Larney, F. J., Cessna, A. J., and Bullock, M. S.: Herbicide trans-port on wind-eroded sediment, J. Environ. Qual., 28, 1412–1421, 1999.
Marques da Silva, J. R. and Soares, J. M. C. N.: Description stan-dards of primary tillage implements, Soil Till. Res., 57, 173–176, 2000.
Merrill, S. D.: Comments on the chain method for measuring soil surface roughness: Use of the chain set, Soil Sci. Soc. Am. J., 52, 1147–1149, 1998.
Merrill, S. D., Black, A. L., Fryrear, D. W., Saleh, A., Zobeck, T. M., Halvorson, A. D., and Tanaka. D. L.: Soil Wind Erosion Haz-ard of Spring Wheat–Fallow as Affected by Long-Term Climate and Tillage, Soil Sci. Soc. Am. J., 63, 1768–1777, 1999. Merrill, S. D., Huang, C.-H., Zobeck, T. M., and Tanaka, D. L.: Use
of the Chain set for scale-sensitive and erosion relevant measure-ment of soil surface roughness, in: Sustaining the Global Farm, edited by: Stott, D. E., Mohtar, R. H., and Steinhardt, G. C., 594–600, 2001.
Munsell Color Co.: Munsell soil color charts, Munsell Color Co., Nueva York, 1998.
Oelze, M. L., Sabatier, J. M., and Raspect, R.: Roughness measure-ments of soil surfaces by acoustic backscatter, Soil Sci. Soc. Am. J., 67, 241–250, 2003.
Or, D., Smets, B. F., Wraith, J. M., Dechesne, A., and Friedman, S. P.: Physical constraints affecting bacterial habitats and activity in unsaturated porous media – a review, Adv. Water Res., 30, 1505–1527.,2007.
Podmore, T. H. and Huggins, L. F.: An automated profile meter for surface roughness measurements, Trans. ASAE, 24, 663–665, 1981.
Potter, K. N., Zobeck, T. M., and Hagen, L .J.: A microrrelief index to estimate soil erodibility by wind, Trans. ASAE, 33, 151–155, 1990
R¨omkens, M. J. M., Singarayar, S., and Gantzer, C. J.: An auto-mated non contact surface profile meter, Soil Till. Res., 6, 193– 202, 1986.
R¨omkens, M. J. M. and Wang, J. Y.: Soil roughness changes from rainfall, Transactions of the American Society of Agricultural Engineers, 30(1), 101–107, 1987.
R¨ohrig , R., Langmaack, M. Schrader, S., and Larink, O.: Tillage systems and soil compaction their impact on abundance and ver-tical distribution of Enchytraeidae, Soil Till. Res., 46, 117–127, 1998.
Saleh, A.: Soil roughness measurement: chain method, J. Soil Wa-ter Conserv., 48, 527–529, 1993.
R. Garc´ıa Moreno et al.: Shadow analysis of soil surface roughness 2487
Saleh, A.: Reply to “Comments on chain method for measuring soil roughness”, Soil Sci. Soc. Am. J., 61, 1533–1535, 1997. Saxton, K. E.: Wind erosion and its impact on off-site air quality
in the Columbia plateau – An integrated research plan, Trans. ASAE, 38, 1031–1038, 1995.
Skidmore, E. L.: Comments on chain method for measuring soil roughness, Soil Sci. Soc. Am. J., 61, 1532–1533, 1997. Spencer, J. W.: Fourier series representation of the position of the
Sun, Search, 2(5), p. 172, USA, 1971.
Soil Science Society of America: Methods of Soil Analysis – Part 3: Chemical Methods, SSSA Book Series, edited by: Sparks, D. L., 5, 1996.
Vidal V´azquez, E., Vivas Miranda, J. G., and Paz G´onzalez, A.: Characterizing anisotropy and heterogeneity of soil surface mi-crotopography using fractal models, Ecol. Model., 182, 337–353, 2005.
Vidal V´azquez, E., Vivas Miranda, J. G., Alves, M. C., and Paz G´onzalez, A.: Effect of tillage on fractal indices describing soil surface microrelief of a Brazilian Alfisol, Geoderma, 134, 428– 439, 2006.
Vivas Miranda, J. G. and Paz Gonz´alez, A.: Fractal models for the description of soil surface roughness, Proceedings of the third International Congress Man and Soil at the Third Millennium, edited by: Rubio, J. L., Morgan, R. P. C., Asins, S., and Andreu, V., Geoforma Ediciones, 2099–2112, 2002.
Wagner, L. E. and Yiming, Y.: Digitization of profile meter pho-tographs, Trans. ASAE, 34(2), 412–416, 1991.
Wagner, W. S.: Mapping a three-dimensional soil surface with handheld 35 mm photography, Soil Till. Res., 34, 187–197, 1995. Young, I. M. and Ritz, K.: Tillage, habitat space and function of soil
microbes, Soil Till. Res., 53, 201–213, 2000.
Young, I. M., Crawford, J. W., and Rappoldt, C.: New methods and models for characterising structural heterogeneity of soil, Soil Till. Res., 61, 33–45, 2001.
Zobeck, T. M.: Soil properties affecting wind erosion, J. Soil Water Conserv., 46(2), 112–118, 1991.
Zobeck, T. M. and Popham, T. W.: Modification of the wind erosion roughness index by rainfall, Soil Till. Res., 42, 47–61, 1997. Zobeck, T. M. and Popham, T. W.: Wind erosion roughness index
response to observation spacing and measurement distance, Soil Till. Res., 45, 311–324, 1998.