JIEM, 2019 – 12(3): 447-457 – Online ISSN: 2013-0953 – Print ISSN: 2013-8423 https://doi.org/10.3926/jiem.2977
Global Supply Chain Network Design Problem with Rules of Origin
Shunichi Ohmori , Qian Huang , Kazuho Yoshimoto
Waseda University (Japan)
[email protected], [email protected], [email protected]
Received: July 2019 Accepted: October 2019
Abstract:
Purpose: This paper aims to incorporate rules of origin into international taxation into firms’ global operations. The purposes of this research are to develop a new model for the global logistics network design of an assembly system with rules of origin and to analyze how the changes of international relationships will affect logistics network design and evaluation functions.
Design/methodology/approach: In this study, we develop a global logistics network design model prescribing allocating amounts for production, assembly, and distribution. A path-based programming model is presented that represents the complexities associated with international and interenterprise issues. The objective is to minimize total costs, which are costs of production, assembly, transportation, and customs duties. In addition to customs duties, rules of origin, which were, not addressed in previous studies, are considered. Several computational experiments with industrial examples are presented to validate the model.
Findings:The results indicate that the tax planning and alignment with the FTA might have a significant impact on the decision-making in the global supply chain for multi-national operating companies. Therefore, the multi-national operating companies need to be aware of importance of what-if simulation before or after FTA changes.
Originality/value: While designing global supply chain, the tax effects and use of free-trade agreements (FTAs), were generally omitted. In this paper, we proposed a global logistics network design model with rules of origin. We show the effectiveness and necessity to consider rules of origin. This model can be used in making an optimal global logistics network for global companies. The results of this model are used as a target for a real optimal logistics network. Companies can make a better logistics network by using this model.
Keywords: global logistics network design, global supply chain, rules of origin, free trade agreement
To cite this article:
1. Introduction
Designing and planning of production-distribution systems in an integrated manner has been an active area of research for many years. There are three levels of decision-makings distinguished depending on the time horizon: strategic (more than a year), tactical (months), and operational (hours, days, weeks).
Among such, the strategic level supply chain planning plays an important role as it is high-level decision-making involving deciding the configuration of the network, i.e., the number, location, capacity, that has a great deal of impact on efficiency of tactical operations on a long-lasting basis.
A large number of optimization-based approaches have been proposed for the design of supply chain networks via mixed-integer programming (MIP). See (Aikens, 1985; Owen & Daskin, 1998; Melo, Nickel & Saldanha-Da-Gama, 2009) for survey.
With the economic development of developing countries such as China and Southeast Asian countries, the center of the market is shifting. For that reason, the supply chain of the manufacturing industry is also globalized, and importance of global supply chain network design has been increased. Considering global features, supply chain models are more complex and difficult to solve than single country model. (Vidal & Goetschalckx, 1997; Meixell & Gargeya, 2005) identify additional issues arise in the global settings, such as different taxes and duties, trade barriers, transfer prices, and duty drawbacks.
Rules of origin are important issues arisen in the global manufacturing, which are rules to decide the place of origin of a product, which determines whether to impose customs duties. As global sourcing or manufacturing, similar products can be sourced or produced from more countries and trading groups. Rules of origin become more important, because the procurement cost is quite different from a trading group or not. Moreover, as the production of products in multiple stages using parts produced in different places all over the world, using rules of origin is an effective way to decrease production costs. Therefore, the paper focuses on the global supply chain network design problem with rules of origin.
Transfer pricing is one of the main mechanisms for allocating profit among different divisions of a firm (Shunko, Do & Tsay, 2017). Multiple papers have investigated the interaction of transfer prices and operating decisions for a firm that operates across multiple tax jurisdictions. Vidal and Goetschalckx (2001) consider a global supply chain model with transfer pricing and transportation cost allocation. They present a model for the optimization of a global supply that maximizes the after-tax profits of a multinational corporation and that includes transfer prices and the allocation of transportation costs as explicit decision variables. Goetschalckx, Vidal and Dogan (2002) review the modeling and design of global logistics systems with the focus on demonstrating the savings potential generated by the integration of the design of strategic global supply chain networks with the determination of tactical production–distribution allocations and transfer prices. Miller and De Matta (2008) present a global supply chain profit maximization and transfer pricing model that explicitly evaluates decisions such as where to incur tax liabilities and how to set intra-company prices. Huh and Park (2013) study a decentralized supply chain of a multinational firm consisting of a manufacturing division and a retail division and analyze the impact of transfer pricing methods for tax purposes on supply chain performance under demand uncertainty under the newsvendor framework. Shunko, Debo and Gavirneni (2014) study transfer pricing and sourcing strategies for multinational firms and compare and analyze a single transfer pricing system and the dual transfer pricing system. Xiao, Hsu and Hu (2015) study the manufacturing capacity decisions with demand uncertainty and tax cross-crediting. They show that the optimal capacity decision under the effects of tax cross-crediting can behave very differently from that of the traditional newsvendor model. Shunko et al. (2017) addressed an issue of supply chain strategies and international tax arbitrage.
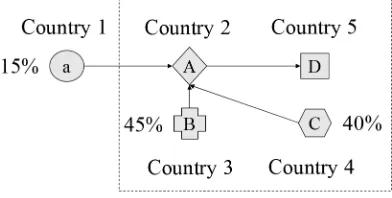
country 1 and the country 2, and between the country 2, 4, 5, and 6. However, if the parts A is processed in the country 3 and assembled in the country 5, customs duties are imposed on the parts A.
Rules of origin are rules to decide the place of origin of a product, which determines whether to impose customs duties. If the rate of origin qualifications exceeds a specified value in a country or a region, the product is exempted from customs duties. If a company meets rules of origin requirements and makes efficient use of FTA, they can trade at low total cost. For example, Figure 2 illustrates an example the FTA is concluded between the two countries. In this example, customs duties are exempted for the export from the country 1 to country 3, because the value-added rate in the country 1 is 85% and exceeds the 40% threshold. Figure 3 illustrates an example the FTA is concluded within a region that includes country 2,3,4, and 5. In this example, tax is exempted for the export from country 2 to country 5, because value-added rate in the region is 85% and exceeds 40%. Taking advantage of low tax rates using the FTA is an important strategy for the multi-national firms. However, incorporate such a decision makes global logistics network is extremely difficult.
Because of this gap, this paper aims to incorporate rules of origin into international taxation into firms’ global operations. The purposes of this research are to develop a new model for the global logistics network design of an assembly system with rules of origin and to analyze how the changes of international relationships will affect logistics network design and evaluation functions.
Figure 1. An example illustrating FTA
Figure 2 An example illustrating rule of origin for the FTA between two countries
2. Proposed Model
2.1. Assumption
Let N = {i = 1, …, n} denote a set of countries. Let M = {s = 1, …, m} denote a set of nodes. We assume
s = 1, …, m – 1 is the node for products/parts manufacturing and s = m is the node for the demand point. Let Φst
is if the subparts t is needed per one finished part s. We set the diagonal element as Φss = 1, for the calculation to
derive the rules of origin described in the next section. Let yisdenote the binary variable to take one if the parts s is
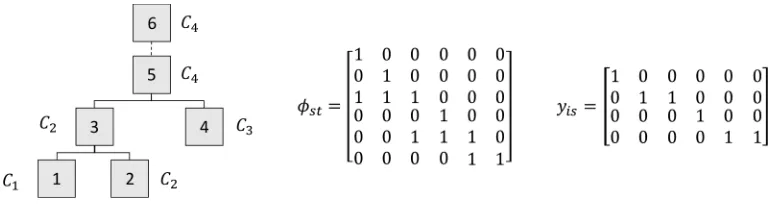
manufactured in the country i; zero otherwise. Figure 4 illustrates an example of Φst and yis with n = 4, m = 6. In
this example, the parts 3 is assembled with subparts 1 and 2, and parts 5 is assembled with parts 3 and 4. After assembled, the parts 5 is transported to the demand point 6. In this figure, each country is labeled as Ci. The parts 1
is manufactured in the country 1, parts 2 and 3 are manufactured in the country 2, parts 4 is manufactured in the country 4, and the parts 5 is manufactured in the country 4, and transported to the demand point in the country 4. There is the capacity of the factory to manufacture parts s in the country i, denoted by qis.
Figure 4. An example illustrating Φst and yiswith n = 4, m = 6
The total cost is calculated as in the Equation (1),
(1)
where Cprod is the production cost, Ctrans is the transportation cost, and the Ctax is the tax for customs duties. The
production cost Cprod is calculated as in the Equation (2),
(2)
where cisprod is the production cost of parts s manufactured in the country i. The transportation cost Ctrans is calculated
as in the Equation (3)
(3)
where cijtransdenote the unit transportation cost from the country i to the country j. The tax cost Ctax is calculated by
the existence of the FTA between countries and rules of origin, described in the next section.
2.2. Rules of Origin
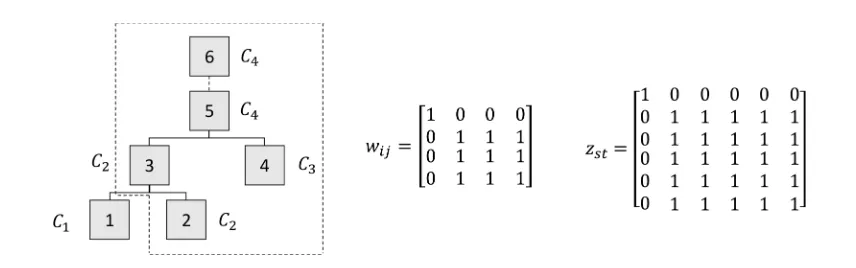
Rules of origin are used to determine whether to levy customs duties and value-added criteria to determine the origin. In the value-added criteria, when the value added to a good through its production satisfies some value content, the good can qualify as an originating good. If the value-added rate exceeds a specified value in one’s country (FTA) or region (regional cooperation association: RTA), the product is exempted from customs duties. Let wij denote the binary indicator if there is a free trade agreement between country i and j. Let zst denote the
binary variable to take one if the parts s and the parts t is manufactured in the same region. zst can be calculated as
. Figure 5 illustrates an example of Φst and yiswith n = 4, m = 6. In this example, there is
Figure 5. An example illustrating Φst and yiswith n = 4, m = 6
The tax cost Ctax is calculated as in the Equation (4)
(4)
where csttaxis the tax imposed to export the parts s to the country where the parts t is manufactured. csttax is calculated
by the Equation (5),
(5)
where αij is the duty rate from the country i to the country j, vs is the value of the parts s, and os is he binary
indicator to take one if the rule of origin of the parts s is satisfied. The value of vs is evaluated by the cumulative
production cost described in the Equation (6).
(6)
Further oscan be calculated by the Equation (7).
(7)
where ρsis the relative value of the in-region parts, and R is the predetermined threshold value to impose the tax.
ρscan be calculated by the Equation (8),
(8)
For example, in the Figure 5, ρ3is calculated by the Equation (9).
(9)
Since z35 = 1, if ρ3 ≥ R is satisfied, c35tax= 0, otherwise c35tax= α24v3.
3. Optimization Problem
The total cost (1) can be minimized by finding the optimal combinations of yip. However, the cost component of
Cprod, Ctrans, Ctax cannot be expressed in an explicit mathematical form.
because there is a decision variable for every transportation arc and product combination. In the second class of models, there exists a decision variable for every flow path from supplier to customer. This flow path may traverse zero, one, or more internal facilities. This class of models will be called path-based. Figure 6 illustrates the decision variable used in each of the two models.
(a) arc-based modeling (b) path-based modeling Figure 6. Arc-based modeling versus path-based modeling
Since the rules of origin is path-dependent, we applied the path-based modeling. We enumerate all possible paths, each of which is indexed by p. Note that there are as nm paths, each of which has a different set of y
ip. Let cp is the
unit cost of path p. Let apimdenote the binary indicator to take one if the parts s is manufactured in the country i in
the path p; take zero otherwise. The decision variable is xp that denotes amount of flow being transported via the
path p.
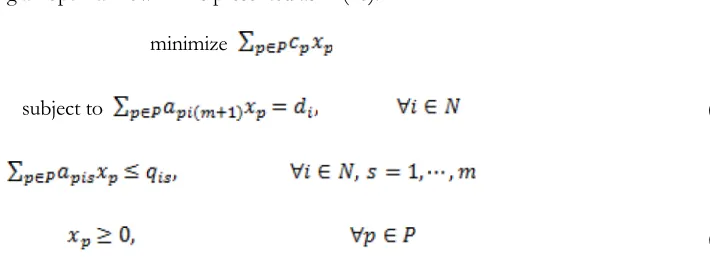
The formulation of finding an optimal flow mix is presented as in (10):
minimize (10a)
subject to (10b)
(10c)
(10d)
The objective function (10a) is to minimize the total cost of flow of all paths. The constraint (10b) ensures that all the demand for a product is delivered to the customers in each country. The constraint (10c) ensure that the capacity of the factory to manufacture each part in each country must be satisfied. The constraint (10d) ensures that the flow is nonnegative. The model can be reduced to the linear-programming problem, and thus, can be easy to solve by off-the-shelf solver.
4. Numerical Examples
To demonstrate the applicability of the proposed model, in this section, the numerical experiments are carried out. We consider the test problem motivated by the real-world manufacturing company. This situation typically arises in the automotive industry and the processing machine industry
4.1. Experimental Setting and Datasets
There are 9 countries, i.e., N = {1, … 9}. There are 5 parts, i.e., M = {1, … 6}. Final product is m = 6. The BOM is presented as in Figure 4.
wij 1 2 3 4 5 6 7 8 9
1 1 0 1 1 0 1 0 0 0
2 0 1 1 0 0 1 0 0 0
3 1 1 1 1 1 0 0 0 0
4 1 0 1 1 1 0 0 0 0
5 0 0 1 1 1 0 0 1 1
6 1 1 0 0 1 1 1 1 1
7 0 0 0 0 1 1 1 1 1
8 0 0 0 0 1 1 1 1 0
9 0 0 0 0 1 1 1 0 1
Table 1. The free trade agreement between countries
αij 1 2 3 4 5 6 7 8 9
1 0 0.2 0.04 0.04 0.16 0.04 0.08 0.08 0.06
2 0.2 0 0.04 0.04 0.16 0.08 0.08 0.08 0.06
3 0.04 0.04 0 0.04 0.1 0.04 0.08 0.08 0.06
4 0.04 0.04 0.04 0 0.1 0.08 0.08 0.08 0.06
5 0.16 0.16 0.1 0.1 0 0.08 0.08 0.08 0.06
6 0.04 0.08 0.04 0.08 0.08 0 0.08 0.08 0.06
7 0.08 0.08 0.08 0.08 0.08 0.08 0 0.08 0.06
8 0.08 0.08 0.08 0.08 0.08 0.08 0.08 0 0.06
9 0.06 0.06 0.06 0.06 0.06 0.06 0.06 0.06 0
Table 2. The duty rate between countries
cisprod 1 2 3 4 5
1 400 450 250 350 210
2 320 380 220 400 200
3 320 380 220 400 200
4 300 320 200 400 200
5 450 500 300 400 260
6 400 450 270 400 240
7 600 600 400 400 350
8 600 600 400 400 350
9 600 600 400 400 350
Table 3. The production cost of each parts manufactured in each country
qis 1 2 3 4 5 di
1 15 15 15 15 15 13
2 15 15 15 15 15 11
3 15 15 15 15 15 2
4 8 8 8 8 8 2
5 10 10 10 10 20 5
6 10 10 10 10 20 3
7 10 10 10 10 20 3
8 10 10 10 10 20 9
9 10 10 10 10 20 6
cijtrans 1 2 3 4 5 6 7 8 9
1 0 18 36 36 18 108 108 108 108
2 18 0 27 36 18 117 117 117 99
3 36 27 0 27 36 108 108 108 81
4 36 36 27 0 36 108 108 108 90
5 18 18 36 36 0 108 108 108 108
6 108 117 108 108 108 0 36 27 72
7 108 117 108 108 108 36 0 27 72
8 108 117 108 108 108 27 27 0 72
9 108 99 81 90 108 72 72 72 0
Table 5. The unit transportation cost between countries
The model described above is implemented in Gurobi Optimizer called from MATLAB2018b run on the personal computer with Intel (R) Core (TM) i7-8700 CPU, 3.20GHz, 3.19GHz with 32.0GB memory.
4.2. Results
In this section, the results of experiments are demonstrated. To compare the result, we solve the problem with dropping Ctax and minimize over Cprod+ Ctrans and impose the tax cost after obtaining the flow, which is termed the
production-transportation cost minimization (PTCM), as opposed to the total cost minimization (TCM) for the proposed model.
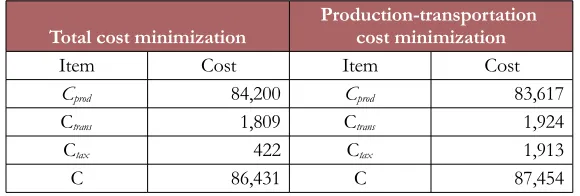
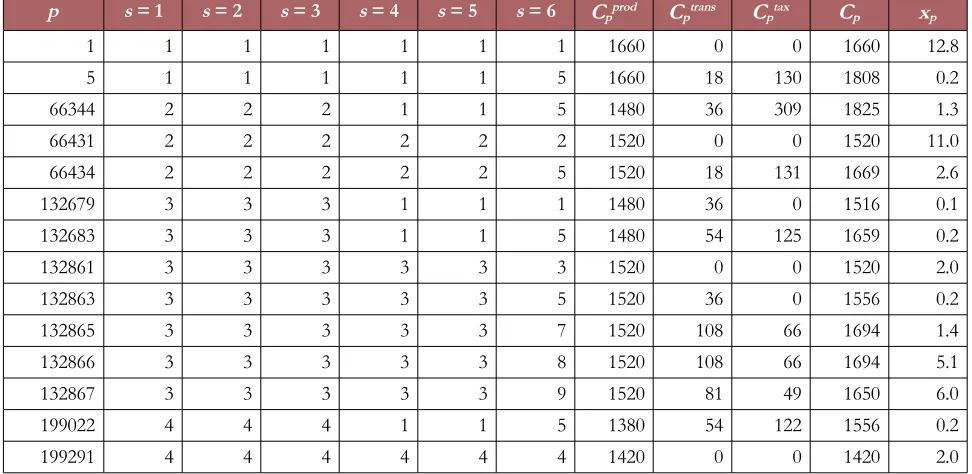
The obtained cost is summarized as in Table 6. The list of non-zero flows for each model is summarized in Table 7 and Table 8 respectively. In Tables 7 and 8, and minimize over Cpprod, Cptrans,Cptax denotes Cprod, Ctrans,Ctax for each path
p respectively.
From Table 6, the total cost of TCM is lower than that of PTCM. While the sum of the production cost and the transportation cost of TCM (86,009) is higher than that of PTCM (85,541), the tax cost of TCM (422) is much lower than that of PTCM (1,913). This result indicates that considering the FTA to reduce the tax has a financial impact.
From Tables 7 and 8, the number of non-zero flows in TCM (14) is smaller than that in PTCM (18). This is to avoid the flow with tax. The number of flows without tax in TCM (3) is smaller than that in PTCM (8). The flows of the path p = 1, 66431, 132679, 132861, 132863, 132867, 199291 appear both in TCM and PTCM. However, the rest of paths are different between TCM and PTCM. All of flows in TCM are either flows in single country or flows across two countries. On the other hand, there are some flows across more than three countries in PTCM. The results indicate the importance of tax considerations in global supply chain management. These results indicate that the tax planning and alignment with the FTA might have a significant impact on the decision-making in the global supply chain for multi-national operating companies. Therefore, the multi-national operating companies need to be aware of importance of what-if simulation before or after FTA changes. Considering the quantitative implications jointly, the analysis provides a valuable tool to support rational decision-making and implementation in practice.
Total cost minimization Production-transportation cost minimization
Item Cost Item Cost
Cprod 84,200 Cprod 83,617
Ctrans 1,809 Ctrans 1,924
Ctax 422 Ctax 1,913
C 86,431 C 87,454
p s = 1 s = 2 s = 3 s = 4 s = 5 s = 6 Cpprod Cptrans Cptax Cp xp
1 1 1 1 1 1 1 1660 0 0 1660 6.0
66431 2 2 2 2 2 2 1520 0 0 1520 11.0
66435 2 2 2 2 2 6 1520 117 0 1637 3.0
66436 2 2 2 2 2 7 1520 117 66 1703 1.0
132679 3 3 3 1 1 1 1480 36 0 1516 5.3
132861 3 3 3 3 3 3 1520 0 0 1520 2.0
132863 3 3 3 3 3 5 1520 36 0 1556 1.7
132867 3 3 3 3 3 9 1520 81 49 1650 6.0
199018 4 4 4 1 1 1 1380 36 0 1416 1.7
199024 4 4 4 1 1 7 1380 144 61 1585 1.0
199291 4 4 4 4 4 4 1420 0 0 1420 2.0
199292 4 4 4 4 4 5 1420 36 0 1456 3.3
332152 6 6 6 6 6 7 1760 36 0 1796 1.0
332153 6 6 6 6 6 8 1760 27 0 1787 9.0
Table 7. The list of non-zero flows for total cost minimization
p s = 1 s = 2 s = 3 s = 4 s = 5 s = 6 Cpprod Cptrans Cptax Cp xp
1 1 1 1 1 1 1 1660 0 0 1660 12.8
5 1 1 1 1 1 5 1660 18 130 1808 0.2
66344 2 2 2 1 1 5 1480 36 309 1825 1.3
66431 2 2 2 2 2 2 1520 0 0 1520 11.0
66434 2 2 2 2 2 5 1520 18 131 1669 2.6
132679 3 3 3 1 1 1 1480 36 0 1516 0.1
132683 3 3 3 1 1 5 1480 54 125 1659 0.2
132861 3 3 3 3 3 3 1520 0 0 1520 2.0
132863 3 3 3 3 3 5 1520 36 0 1556 0.2
132865 3 3 3 3 3 7 1520 108 66 1694 1.4
132866 3 3 3 3 3 8 1520 108 66 1694 5.1
132867 3 3 3 3 3 9 1520 81 49 1650 6.0
199022 4 4 4 1 1 5 1380 54 122 1556 0.2
199291 4 4 4 4 4 4 1420 0 0 1420 2.0
Table 8. The list of non-zero flows for production-transportation cost minimization
5. Conclusions
International trade increases the chosen of similar products from different countries or regions and decrease the total cost of final products. However, all of these effects seem not beneficial to all countries and timely changing. For example, the Trump administration introduced billions of dollars in new tariffs on Chinese imports and threatened tariffs on other countries. And China also announced a tariff on some kinds of U.S. products. The global factors are significantly changeable from politics, economics and emergency. Therefore, the consideration of regulation as rules of origin is more necessary and important in both industry and academic.
For future research, the decision of transfer price should be incorporated. Transfer prices can adjust some degree of profit for players in a supply chain. Since the incorporation of more variables, potential profit can be acquired. At the same time, the solution process would become complex. Another interesting topic is the development of efficient algorithm to solve the problem, as the number of subscripts and flow path variables are so large in the path-based-model, only a very limited number of echelons can be considered for industrial sized problems. The algorithm for large size problem should be considered in both speed and accurate. It is also necessary to consider another global factor such as trade barriers, and duty drawbacks, currency exchange rate.
Declaration of Conflicting Interests
The authors declared no potential conflicts of interest with respect to the research, authorship, and/or publication of this article.
Funding
The work on this paper has been partially supported by Waseda University Grants for Special Research Projects (2019E-047).
References
Aikens, C.H. (1985). Facility location models for distribution planning. European Journal of Operational Research, 22(3), 263-279. https://www.sciencedirect.com/science/article/pii/0377221785902462
https://doi.org/10.1016/0377-2217(85)90246-2
Goetschalckx, M., Vidal, C.J., & Dogan, K. (2002). Modeling and design of global logistics systems: A review of integrated strategic and tactical models and design algorithms. European Journal of Operational Research, 143(1), 1-18.
https://www.sciencedirect.com/science/article/pii/S037722170200142Xhttps://doi.org/10.1016/S0377-2217(02)00142-X Goetschalckx, M. (2011). Supply chain engineering (161). Springer Science & Business Media.
https://doi.org/10.1007/978-1-4419-6512-7
Huh, W.T., & Park, K.S. (2013). Impact of transfer pricing methods for tax purposes on supply chain performance under demand uncertainty. Naval Research Logistics (NRL), 60(4), 269-293.
https://onlinelibrary.wiley.com/doi/full/10.1002/nav.21533https://doi.org/10.1002/nav.21533
Meixell, M.J., & Gargeya, V.B. (2005). Global supply chain design: A literature review and critique. Transportation Research Part E: Logistics and Transportation Review, 41(6), 531-550.
https://www.sciencedirect.com/science/article/pii/S1366554505000487https://doi.org/10.1016/j.tre.2005.06.003 Melo, M.T., Nickel, S., & Saldanha-Da-Gama, F. (2009). Facility location and supply chain management–A review.
European Journal of Operational Research, 196(2), 401-412.
https://www.sciencedirect.com/science/article/pii/S0377221708004104https://doi.org/10.1016/j.ejor.2008.05.007 Miller, T., & De Matta, R. (2008). A global supply chain profit maximization and transfer pricing model. Journal of
Business Logistics, 29(1), 175-199. https://onlinelibrary.wiley.com/doi/full/10.1002/j.2158-1592.2008.tb00074.x https://doi.org/10.1002/j.2158-1592.2008.tb00074.x
Owen, S.H., & Daskin, M.S. (1998). Strategic facility location: A review. European Journal of Operational Research,
Shunko, M., Debo, L., & Gavirneni, S. (2014). Transfer pricing and sourcing strategies for multinational firms.
Production and Operations Management, 23(12), 2043-2057. https://onlinelibrary.wiley.com/doi/full/10.1111/poms.12175 https://doi.org/10.1111/poms.12175
Shunko, M., Do, H.T., & Tsay, A.A. (2017). Supply chain strategies and international tax arbitrage. Production and Operations Management, 26(2), 231-251. https://onlinelibrary.wiley.com/doi/full/10.1111/poms.12629
https://doi.org/10.1111/poms.12629
Vidal, C.J., & Goetschalckx, M. (1997). Strategic production-distribution models: A critical review with emphasis on global supply chain models. European Journal of Operational Research, 98(1), 1-18.
https://www.sciencedirect.com/science/article/pii/S037722179780080Xhttps://doi.org/10.1016/S0377-2217(97)80080-X Vidal, C.J., & Goetschalckx, M. (2001). A global supply chain model with transfer pricing and transportation cost
allocation. European Journal of Operational Research, 129(1), 134-158. https://doi.org/10.1016/S0377-2217(99)00431-2 Xiao, W., Hsu, V.N., & Hu, Q. (2015). Manufacturing capacity decisions with demand uncertainty and tax
cross-crediting. Manufacturing & Service Operations Management, 17(3), 384-398.
https://pubsonline.informs.org/doi/abs/10.1287/msom.2015.0526https://doi.org/10.1287/msom.2015.0526
Journal of Industrial Engineering and Management, 2019 (www.jiem.org)
Article’s contents are provided on an Attribution-Non Commercial 4.0 Creative commons International License. Readers are allowed to copy, distribute and communicate article’s contents, provided the author’s and Journal of Industrial Engineering and