0 INTRODUCTION
The autonomous operation of modern metal-forming processes is essential. An appropriate response of the flexible sheet metal forming lines can only be provided if the properties of the incoming material can be identified online. All deviations of the finished part from the design are coming from the uncertainties of the forming process. Allwood et al. [1] have described in an overview paper of this research field those uncertainties in metal forming processes and divided them into model errors and disturbances. According to this classification, the model errors include all process design errors (necessary forces, friction, etc.) while disturbances include all those uncertainties that are not included in model errors
(variations in input material thickness, equipment vibration, temperature differences, differences in the material forming properties, etc.). One of the major goals in designing modern metal forming processes is to have the majority of all influential parameters described as model errors and to minimize the amount of disturbances. To follow major goals in designing the modern metal forming processes, we need to move uncertainties caused by the changes of metal forming properties from disturbance to model errors. This transition can be made with the implementation of the indentation test.
A spherical indentation test is commonly used for determining the hardness of the material. However, with special approaches, we can also make evaluations with its constitutive properties, fracture toughness,
Study of Influential Parameters of the Sphere Indentation
Used for the Control Function of Material Properties
in Forming Operations
Satošek, R. – Valeš, M. – Pepelnjak, T.
Roman Satošek1 – Michal Valeš2 – Tomaž Pepelnjak1,*
1University of Ljubljana, Faculty of Mechanical Engineering, Slovenia
2Czech Technical University in Prague, Faculty of Mechanical Engineering, Czech Republic
The uncertainties of modern, adaptable sheet metal forming systems are classified into model errors and disturbances. To improve the control of production, disturbances in the forming process need to be reduced. For this purpose, a new data flow system was introduced. It connected the data flow of all influencing material parameters into the “material property control function”. To control on-line the forming production line and acquire necessary material data, an indentation test was implemented. The main parameters to follow in this test are pile-up or sink-in values after the embossing of the ball-shaped tool into the material where the innovative approach of fully anisotropic material description was used. To set-up an optimal indentation test, parametric studies were performed with material data of AW 5754-H22. Finite element simulations were used to evaluate the influences of indenter diameter, contact friction and forming history of used the material. Fully anisotropic material behaviour was considered. Novel to this approach were a) the linking of the linear correlation of pile-up with the indentation depth described by gradient k, and b) the linking of gradient k with different pre-strains by a new power function.
Keywords: indentation test, anisotropy, on-line control system, forming process, parametric study
Highlights
• A new set-up of the control function influenced by the material properties, which is intended for the direct control of the sheet metal-forming production process via on-line indentation testing.
• Influential parameters of indentation testing at different indentation depths shows following scientific innovations: • The pile-up effect is dominant when the spherical indenter is embossed into AW 5754-H22.
• A linear relationship exists between pile-up and indentation depth at different indenter diameters, in which the pile-up value has a smaller gradient in the case of a bigger indenter diameter and vice versa.
• If no elastic region exists under indentation, the observed relationship between indenter diameter and pile-up value is not linear.
• The relationship between Coulomb friction coefficient µ and pile-up value expresses larger values of the linear gradient at a smaller value of friction coefficient µ.
• A linear relationship exists between the pile-up and indentation depth at various values of normal anisotropy. Examining the cold roller anisotropic material, it was found that the pile-up at θ = 45° has the nearest slope to the isotropic one while at θ = 0° the slope is increased and, vice versa, at θ = 90° it is lower as in the case of isotropic material..
residual stresses, and creep properties. The indentation test is classified as a non-destructive [2] or quasi-non-destructive [3] localized test that can be used for non-standard specimens. Indentation test is a simple test but extracting the aforementioned properties from a specimen is far from easy. The biggest challenge is non-uniform strain beneath the indenter. This paper evaluates the constitutive properties of the material based on the indentation test. Such evaluations with similar methods have been done by several authors [4] to [17], and they have used the strain-hardening coefficient n based on the Hollomon hardening power law (Eq. (1)).
σf = ⋅C εe,p
n , (1)
where C and εe,p are Hollomon material constant and true equivalent plastic strain, respectively.
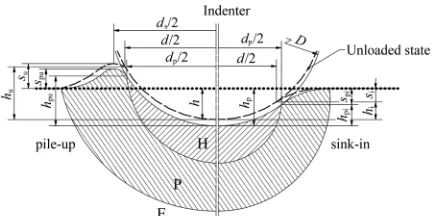
The first comprehensive study of the correlation between indentation test and material flow stress was done by Tabor [4], which proposed the proportionality between the mean contact pressure, the product of the flow stress, and the factor of the plastic material constant with values in the range between 2.6 and 3. Sonmez et al. [5] demonstrated analytical relations between hardness and strain for cold-forming parts. Their model requires only flow curve constants, which can be obtained through a simple compression test, and effective strain distribution, which can be obtained through a finite element (FE) analysis of the cold-forming process. Determining the plastic properties of the structural steel using spherical indentation with a reverse algorithm was studied by Pham et al. [6]. Fig. 1 shows geometrical relations between indenter and material’s embossing during the indentation test. In the Fig. 1, the expansion cavity model (ECM) and the pile-up or sink-in effect are also presented. The basis of the ECM was set by Hill [7] based on Lamé’s solution, while Johanson [8] added the relation of the mean contact pressure regarding the observed plastic strain. Pile-up and sink-in was investigated by Hill et al. [9] determining the so-called c2 function to relate the Hollomon hardening exponent and pile-up or sink-in effect. Yonezu et al. [10] proposed an indentation method to estimate the out-of-plane plastic anisotropy, with the aid of dimensional analysis and the representative strain concept. In their proposed method, the material is assumed to obey the work-hardening law and has out-of-plane anisotropy of plasticity governed by Hill’s yield criterion. With the help of the finite element simulation. Taljat et al. [11] have shown that pile-up and sink-in during spherical indentation of elastoplastic materials
depend not only on the strain hardening exponent, but also on the relative amount of elastic and plastic deformation as characterized by the non-dimensional material parameter E/σf, the non-dimensional depth
of penetration, h/(D/2), and the friction coefficient. In Fig. 1, the horizontal dotted line represents the material condition before conducting the indentation test. The first step of the indentation test is the loading process. During this step, the force F to the indenter is applied (also known as contact force) which presses the indenter into the material. At indenter depth hp, the equilibrium of forces is achieved. The contact edge between indenter and material define the projected contact diameter dp. The next step is the material unloading where indenter moved upwards. Due to the elasticity of the indenter and material, the contact between them persists and can be measured with indenter force. At the separation, the contact force drops to the value of 0. The location of the indenter at this moment is marked in Fig. 1 by dashed lines. Now the indentation depth h and corresponding diameter d can be measured. During the penetration of the indenter into the material, material flows in the indenter’s vicinity. If the extruded material forms a hill, then this is considered to be the pile-up (su) effect. In the opposite situation, the phenomenon is described as “sink-in” (si) (Fig. 1). Pile-up (sink-in) is influenced by the area under the indentation that consists of three characteristic zones. The hydrostatic region (H) lies directly below the contact surface and is not subject to the plastic strain, but it significantly affects the plastic strain of the next region (P) being plastic deformed. The furthest distance from the indentation is the region being only elastically loaded (E).
With the indentation test, we can collect all needed input data (F, d or dp, h or hp, su or si) to define the material properties. If the material property is assumed to be isotropic, then the true stress versus true equivalent plastic strain (σf – εe,p) curve is obtained
from the indenter force versus indenter depth diagram (F – hp). This transformation was studied by Karthik et al. [12] and described in an ISO/TR 29381 standard [13]. The determination of the anisotropic material properties demands, additionally to the F – hp curve, the measurement of the indentation-surrounding region, especially the areas with maximum pile-up (or sink-in) values. Yonezu et al. [10] have proposed a method with contour mapping on the indentation’s surrounding area. Alternatively to this method, the residual imprint was introduced by Wang et al. [14]. Shen et al. [15] have demonstrated a novel method for measuring residual stresses both in uniaxial and biaxial stress states. Petryk et al. [16] developed a method to estimate the power-law hardening exponent of an anisotropic fcc single crystal from the spherical indentation test. The focus of their method was on residual pile-up/sink-in topography without the need to solve the relevant inverse problem afterwards. Wu et al. [17] used 3D roughness measurement equipment for scanning of the indentation’s surrounding. For rolled materials used in sheet metal forming, Banabic [18] described the anisotropy as orthotropic, with the following orientations: longitudinal (rolling direction), transversal (perpendicular to rolling direction) and normal direction. The best way to describe this phenomenon is Langford r-values, which can be obtained by the uniaxial tension test [19]. During testing, force as well as strain in all three directions (longitudinal, transversal and normal) have to be acquired.
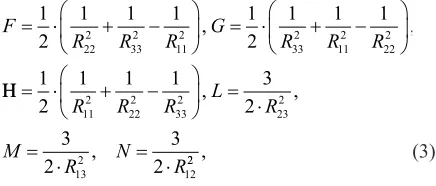
In the numerical program ABAQUS, a material’s anisotropy can be described with Hill’s yield criterion [17] and [20], as expressed in Eq. (2).
σ σ σ σ σ σ σ τ τ f 22 33 = ⋅
(
−)
+ ⋅(
−)
+ ⋅(
−)
+ ⋅ ⋅ + ⋅ ⋅ F G H L M 2 33 11 2 11 22 2 23 2 31 22 22 12
2 2 + ⋅ ⋅ N τ
, (2)
where F, G, H, L, M and N are anisotropic parameters. They describe the current state of the anisotropy of used sheet metal material and are calculated as follows:
F
R R R G R R R
= ⋅ + − = ⋅ + − 1 2
1 1 1 1
2
1 1 1
22 2 33 2 11 2 33 2 11 2 22 2 , , H
H= ⋅ + − = ⋅ = ⋅ = ⋅ 1 2
1 1 1 3
2 3 2 3 2 11 2 22 2 33 2 23 2 13 2 12
R R R L R
M
R N R
, ,
, 22 , (3)
where R are parameters of the stress ratios. In Eq. (3), Rii are ratios of normal stresses while Rij represent anisotropic yield ratios for shear stresses (Eq. (4)):
R R R
R R R
11 11 22 22 33 33 12 12 13 13 23 23 = = = = = = σ σ σ σ σ σ σ τ σ τ σ
0 0 0
0 0
, , ,
, ,
ττ0 , (4)
where σ0 is used normal stress considered as flow stress at the rolling direction implemented in the FE simulation and asthe corresponding shear stress.
The majority of modern sheet metal-forming lines are automated and have several control functions [21] and [22] implemented into the production processes in order to assure quality of the products [1]. However, the spherical indentation test is a novel approach used for the on-line control of forming parameters directly on the production lines. Therefore, a new set-up of the control function data-flow presented in next chapter is to be determined. It has to be emphasized that the ball indentation, as known in various hardness testers, is the only design basis for the present study. The main purpose of the analyzed indentation here is entirely distinct from common hardness measurements.
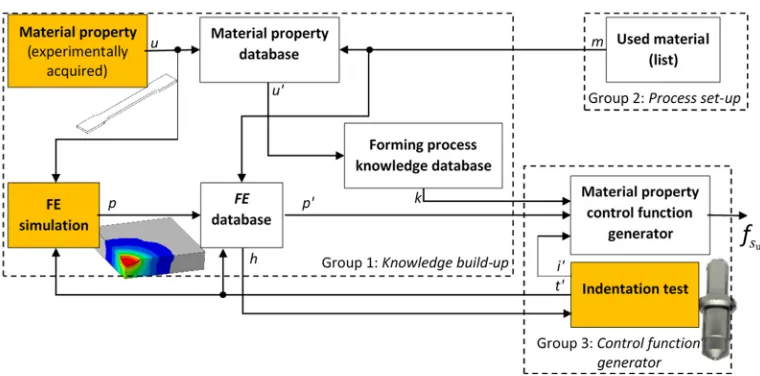
1 DATA FLOW OF MATERIAL PROPERTY CONTROL FUNCTION (DFMCF)
are measured before the forming process, using the proposed indentation test. Such a concept is similar to some newly developed feed-forward control loops, as presented by Heingärtner et al. [23] however, the mechanical properties of the input material are not defined by the on-line measurements of those authors.
At the beginning of each production, the setting-up of the process is needed. During this period, all relevant equipment and necessary information (including the material’s properties) have to be inserted into the sheet metal forming line. In DFMCF, the material properties are selected in the module used material in the process set up group. Inside of this module is the database with a list of all materials for which the relations between FE simulation and forming process knowledge is known. Output information from this module is material designation m (Fig. 2), and it goes into the material property database and FE database.
After material selection, all relevant data from the forming process knowledge database and FE database are transferred into the control function generator group. This group consists of material property control function generator and indentation test. The group is integrated into the sheet metal-forming process, and it is constantly active. The function of the indentation test is to emboss the indenter into the material and measure in case of analysed AW 5754-H22 the value of the pile-up. In this article, the influence of indenter diameter and material parameters on pile-up was studied. The main design rule for the indentation test is to find a suitable indenter diameter to obtain the highest pile-up value. However, the influence of the material thickness and coefficient of friction between
both objects in contact also has to be considered. The design rule is stored in the FE database, and, during setting-up, the process is transferred to the indentation test module as indentation design parameters h (Fig. 2). It can be observed that the pile-up value and gradient of it are small and so the immense challenge is how to measure the pile-up. This is even more complex in the case of anisotropic material properties. The output from the indentation test is indentation test parameter t’ and pile-up measurement i’ (Fig. 2). The pile-up measurement i’ is plugged into the material property control function generator module. Other inputs for this module are forming process knowledge database and FE database. In the module control function generator, all inputs are compared. The output from the control function generator is control function (Fig. 2) being integrated into the control function of the sheet metal-forming process.
However, the forming limit diagram, chemical composition, crystallographic composition, as well as thermal data, have to be considered in the extended version of this data set. The material property data set is stored in the material property database and also used as input for FE analyses. During setting-up of the process in material property database module, the collection of needed data according to selected material m is done, and this set of data is sent as selected material property data set u’ (Fig. 2) to the forming process knowledge base module. This module is a storage for all relationships between material-forming properties and material-forming process parameters collected during the forming history, dedicated FE simulations, and other studies. Now that the selected material property data set u’ is received into the forming process knowledge base module, the module collects proper forming relationship data and sent it as selected forming process parameter k (Fig. 2) to the control function generator. From the knowledge build-up module, the FE simulation data set p’ (Fig. 2) is also going as input into the material property control function generator module. This data set is coming from FE database that store all FE simulation data. When material designation m (Fig. 2) comes into the FE database as input module collect needed data and sent into the material property control function generator module.
In the presented article, into the FE simulation module, the function to find the relationship between pile-up values and all influential parameters (D, μ, s, σf – εe,p, Lankford’s r-values) is included. The FE simulation module needs two parameters: material property data u and indentation test parameter t’. Material property data u is here needed for material and its thickness and indentation test parameter t’ for boundary conditions of the FE simulation. In the first phase, the optimal indentation test is unknown. In this phase, the indenter diameter, its embossing speed, and support surface are determined. The second phase is dedicated to the evaluation of material influence at fixed parameters of the indentation test. Finally, the influence of contact friction is to be evaluated as well. In the literature overview, it was presented that material properties are determined by using F – hp or/ and su – hp curves, and the main purpose of the FE simulations is to find the relationship between these curves and material properties. The output from the FE simulation module is the FE simulation data set p (Fig. 2).
2 MATERIALS AND METHODS
2.1 Material Data
In the material property module of the knowledge build-up group are included all needed experiments to describe the material-forming properties [24] and [25]. In the presented paper, the uniaxial tension test was conducted. The selected material is cold-rolled 3 mm thick strain-hardened sheet aluminium alloy AW 5754-H22 with basic mechanical properties (Table 1) in line with the standard EN 485-2 [26].
Table 1. The basic mechanical properties of the AW 5754-H22
[26]
ρ
[kg/m3] [GPa]E Rp0.2,min[MPa] [MPa]Rm
2700 68 130 220 to 270 To obtain the true stress σf versus true plastic strain εe,p relationship, we have conducted the uniaxial tension test according to ISO 6892-1 [27] for three typical rolling directions (0°, 45°, and 90°). The material was tested using an AMSLER universal testing machine with 30 kN nominal force, an Applied Measurement Systems transducer with 25 kN nominal load for force measurement, and optical strain data acquisition system. Since high strains are to be expected with ball indentation, the difference between the Hollomon and Swift hardening power laws was examined for the stress flow in the rolling direction. The maximum achieved values of tensile test at rolling direction 0° were for true stress 274.3 MPa at 0.108 true plastic strain, respectively. If we are using the Hollomon hardening power law (Eq. (1), then both parameters C and n are obtained by fitting the curve in σf – εe,p diagram or using log(σf) – log(εe,p) approach
[28]. In our case, the Hollomon power law (Eq. (1)) is not the best material hardening approximation. As an alternative to the Hollomon power law approximation, the Swift hardening power law can be used [29] (Eq. (5)):
σf ε εe,p
s
Table 2. AW 5754-H22 forming parameters Tested
direction [o] [MPa]K [-]ε0 ns[-] [-]r
0 403.4 0.009 0.174 0.565 45 383.4 0.009 0.171 0.677 90 383.2 0.007 0.163 0.794
2.2 FE Simulation
The second important module in the knowledge build-up group is the FE simulation module. To define the material parameters of the anisotropic materials with an indentation test, we need to analyse the material response under indenter load and define needed measurements after embossing the indenter into the material.
Each performed FE simulation [24] consists of geometry, mesh, material mechanical and formability properties, contact interactions between indenter and material, boundary conditions and applied load. The material parameters have already been discussed, and for the majority of the FE simulations, the isotropic material properties were used.
If the anisotropic material is simulated, Hill’s potential function has to be considered (Eq. (2)).
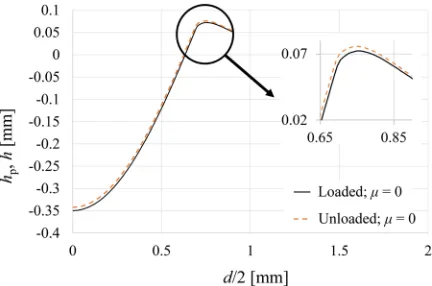
Fig. 3. Difference between loaded state (hp versus d) and unloaded state (h versus d) at frictionless contact conditions
(μ = 0)
Preliminary FE simulations of the indentation were addressed to the understanding of material response under the indenter load. It was noticed that for aluminium alloy AW 5754-H22, the dominant effect is pile-up. FE simulation shows that at the unloaded state, the value of pile-up su is 5 % higher than in the loaded state (Fig. 3). On the other side, the pile-up diameter after unloading ds is 1 % smaller in comparison to the loaded state. Furthermore, the
difference between indenter depth hp and indentation depth h is only 2 %. Consequently, all our studies were validated to the amount of pile-up at the unloaded state, which will also can be measured in future research work.
2.2.1 Model, Mesh and Loads
The FE model of sheet metal during the indentation process was described with 3D elastic-plastic elements. To shorten the computer time required for the numerical FE simulation of the indentation test, a model symmetry with one-quarter of the entire analysed problem was used. For the majority of performed FE simulations, an indenter diameter of 1 mm and 3 mm thick AW 5754-H22 deformable sheet material was used. The cross-section with a size of 4.5 mm × 4.5 mm is sufficiently large that at maximum indenter depth hp is an elastic region supporting the plastic one after the embossing with the indenter is present.
The selected mesh density has 79405 linear hexahedral (C3D8R) elements describing the elastic-plastic sheet metal while the indenter consists of 1852 linear quadrilateral (R3D4) and 10 linear triangular (R3D4) elements, respectively. The mesh size ranges from 0.007 mm × 0.007 mm × 0.01 mm to 0.2 mm × 0.2 mm × 0.2 mm.
exceed 0.1 degrees. At the indentation speed of 0.05 mm/s, the heat conduction dominates the thermal state during the indentation, leading it towards isothermal conditions. Through this, the heat generation and corresponding temperature rise due to work hardening and friction among both objects in contact were neglected in the selected constitutive model.
Fig. 4. Mesh and boundary conditions
3 EXPERIMENT
To design the indentation test module properly in the proposed control function generator, first the indentation test needs to be experimentally performed (Fig. 5). Through this, the indenter load for the selected AW 5754-H22 material at known tool displacements are to be acquired. These measurements are indispensable for the determination of the friction coefficient among both objects in contact. To indent the spherical shape into the AW 5754-H22 aluminium alloy, the LaborTech Lab Test 5.100SP1 100 kN uniaxial testing machine was used (Fig. 5a). The spherical indenter was mounted in a specially designed indentation tool, enabling the flexible mounting of different indenters. On both parts of the indentation tool, reflective tape was placed to enable the laser measurement of the indenter displacement in the vertical direction. The measurement was done with an LE-05 laser extensometer from Electronic Instrument Research the accuracy of this device is 1 µm.
A Brinell spherical indenter with a 1 mm diameter was mounted into the indentation tool. A specimen of AW 5754-H22 aluminium alloy was polished
with 3 μm polishing paste to obtain an optimal flat
measurement surface. After polishing, the specimen was placed into the indentation tool. During the indentation test, the indenter vertical speed was set to 50 µm/s, while the tool’s position was monitored with the laser extensometer. The initial contact between the spherical indenter and specimen was defined at the contact force of 5 N where the laser extensometer was set to 0. The selected indenter displacements for particular tests were from 100 µm to 350 µm with step
increments of 50 µm. At this point, the force F acting on indenter and indentation depth hp were acquired.
Fig. 5. Equipment used to perform a) indentation test, and b) measurement of the indentation
The formed cavity and its vicinity were measured with a Keyence VHX-6000 optical microscope (Fig. 5b). The microscope was set to 300× magnification,
and the samples were scanned with a pitch of 2 μm.
Based on the conducted measurement, the indentation depth h and pile-up value su were determined, and correlations with indenting forces were evaluated for further comparison with numerical results.
4 RESULTS AND DISCUSSION
The usability of the DFMCF depends on proper design of each module inside the groups of the DFMCF (Fig. 2). With the plotting of different diagrams and analyzing the corresponding correlations at the indentation process, its optimal set-up parameters were determined.
4.1 Indenter Diameter D
pile-up and indentation depth for different indenter diameters at the material thickness of 3 mm. Four different indenter diameters ranging from 1.0 mm to 2.5 mm were numerically simulated. The influence of the thickness is measured by the curve deviation from the line. At straighter curves, lower influence can be expected, being the smallest in the case of linear correlation.
Fig. 6. Relations between the indenter diameter and the material thickness (s)
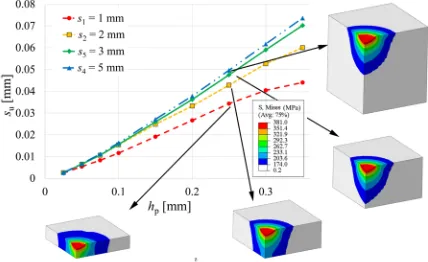
Fig. 7. Correlation of the indenter diameter versus material thickness (s) at diameter D = 2.5 mm
To explain into the detail the behaviour of the material at indentation into different sheet thicknesses, the indentation diameter of 2.5 mm was selected. The diagram su – hp (Fig. 7) was plotted at an unloaded state. Additional to the su – hp relationship, von Mises stresses at loaded state are plotted (Fig. 7). To distinguish the difference between elastics and plastic regions, the minimum at the stress scale was set to yield stress of the observed AW 5754-H22 material.
The elastic region is shown as grey in Fig. 7, and the coloured area is the plastic region. At indenter depth of 0.25 mm, the elastic region of the sheet metal below the plastic one can be observed only in the case of 5 mm thick material. In the case of 1 mm thick
material, the curve on the diagram in Fig. 7 deviates from the line due to the fully plastic deformed sheet metal in the vicinity of the embossed shape across its entire thickness. However, the sheet thickness also influences the inclination of the observed line or curve. In the case of material thicknesses of 3 mm and 5 mm, the correlation is linear up to hp = 0.35 mm, and the difference between gradients of these lines are small. By decreasing the material thickness down to 1 mm and 2 mm, the plotted curve has a visible deviation from linear correlation and the inclination is smaller than in the case of the 3 mm thick material. The optimal value of indenter diameter at the dedicated material thickness and planned indenter depth is when these two rules are followed:
• The plotted trend line of the su – hp relationship is linear at the observed thickness si
• If the plotted trend line of the su – hp relationship at su,i(si) ≈ su,i+1(si+1) ≈ su,i+n(si+n) (si+1 is thicker material) then the indenter diameter is selected properly.
• The difference among two consecutive lines at the observed value of the indenter depth hp is less than the accuracy of used measurement equipment.
4.2 Friction Coefficient
Syngellakis et al. [30] have analysed influence of friction coefficient on the pile-up effect however, they used a rotational-symmetric FE model and isotropic material, and they have analysed the influence of friction coefficient on one pile-up value only. The interaction between the friction coefficient and the pile-up as a function over a range of various indenter depths has not yet been found in the literature. Therefore, the friction influence on pile-up values at unloaded state has been numerically simulated for five different Coulomb friction coefficients (μ = 0, 0.05, 0.1, 0.2 and 0.45). From the diagram in Fig. 8, it is evident that friction influences the pile-up value. Through all points of the diagram (Fig. 8) with the same friction coefficient, a line can be drawn. The relationship between friction coefficient and pile-up value results in an increase of pile-pile-up at lower friction coefficients. Fig. 8 shows the values of pile-up regarding different friction coefficients with the values presented in Table 3, and at friction μ = 0.45, the pile-up value is 49 % lower as in the case of frictionless contact.
effect is determined by the strain-hardening exponent. In the case of material delivering a dominant pile-up effect, the increase of friction coefficient diminishes, the pile-up and can shift it even towards the sink-in.
Fig. 8. Influence of the contact friction
Table 3. Different pile-up value at different coefficient of the friction
hp = 0.25 mm μ = 0 μ = 0.05 μ = 0.1 μ = 0.2 μ = 0.45 pile-up su [mm] 0.0665 0.0608 0.0530 0.0439 0.0340
4.3 Experimental Calibration of Friction Coefficient μ Used in FE Models
The relationship between the force F acting on the indenter versus indenter depth h as well as value of the pile-up versus indentation depth h were plotted and presented in the discussion about FE indentation tests and experimentally obtained shapes of the cavities.
To determine the real friction among the indenter and the specimen, it is necessary to implement the measured values of force F and indenter depth h onto the calibration curves obtained with the FE simulations, as shown in the Fig. 9. The relationship F versus h shows that the measured values of indentation test fits well with the FE data using the friction coefficient of μ = 0.20. The so-defined coefficient of
the friction is aligned with Trzepieciński and Lemu [31] and slightly lower value as defined by Duran [32]. The limiting values of the diagram in Fig. 9a are μ = 0.45 and μ = 0.10, respectively. A slight deviation among the FE-obtained curves and experimental results, which may be caused due measurement accuracy of the used experimental equipment at low indentation depths, may be observed.
The same procedure was used for the su – h relationship (Fig. 9b). The comparison among numerical and experimental results also interact in this case at most for the friction coefficient of μ = 0.20.
Therefore, in the FE simulations described in chapters Influence of the strain history of used material and Anisotropic material, the coefficient of the friction with the value of μ = 0.20 was selected.
Fig. 9. Relationship between FE simulation and experiment: a) according to the F – h diagram and b) according to the su – h
diagram both with various friction coefficients
4.4 Anisotropic Material
If we are simulating the indentation test of the isotropic material, all six Hill’s ratios are equal to 1. Yonezu et al. [10] and Wu et al. [17] have analysed anisotropy of material in two perpendicular directions only (σ0 and σ90). They used in their simulations of the indentation test the material properties with five equal Hill’s ratios having the value 1 and only the parameter R22 differed from 1. Considering the material’s anisotropy, the Hill’s ratios based on Lankford’s coefficients are calculated according to Eq. (6) [33]. The remaining three Hill’s ratios are equal to 1.
none-equal to 1, and two anisotropic material with different parameters R22, R33 and R12. The differences among anisotropic materials “II” and “III” are described below.
R r r
r r R
r r r r
R r
22
90 0
0 90
33
90 0
0 90
12
90
1 1
1
3 = ⋅
(
+)
⋅
(
+)
=⋅
(
+)
+(
)
= ⋅ ⋅
, ,
rr r r r
0
45 0 90
1
2 1
+
(
)
⋅ +
(
)
⋅(
+)
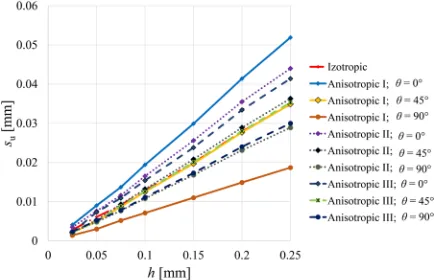
. (6)The differences among all four materials and, in particular, the influence of anisotropy on the level of the pile-up versus indentation depth were visualised with simulations of ball indentation, as shown in Figs. 10 and 11, respectively. For all simulations, Young’s modulus, Poisson’s ratio, density, coefficient of friction, and flow curve were fixed. The variable parameters among performed simulations are Hill’s ratios values, according to Table 4. In the case of material designated “aniso I”, anisotropic properties were taken from Wu et al. [17]. Hill’s ratios for the material “aniso II” is calculated from the set of anisotropic Lankford’s r-values r0 = 0.565, r45 = 0.677 and r90= 0.794 being measured on actual AW-5754-H22 material. The material designated as “aniso III” is an example of rolled sheet metal [34] used for deep drawing. In this case, Lankford’s r-values are r0 = 0.81, r45 = 0.58, and r90 = 1.08. The main difference between the material “aniso III” and the material “aniso II” is the consecutive rising values of Lankford’s coefficients from r0 over r45 to r90 by the later one.
Fig. 11 shows pile-up value at indenter depth 0.2 mm and at different main direction θ. Fig. 10 shows su – h relationships for all three main directions θ = 0°, θ = 45°, and θ = 90°. For isotropic material properties, the su– – h relationships for all three main directions are aligned. The su – h relationships at θ = 45° direction of “aniso I”, “aniso III” and the isotropic are aligned. In case of the “aniso II” material, the su – h curve is slightly higher regarding other lines at θ = 45°. This may be caused due to the steadily increasing values of Lankford’s coefficients. Furthermore, with the material “aniso III”, the su – h relationships at θ = 0° and θ = 90° are not aligned with the θ = 45° curve. Observing the gradients k of linear relationship in the su – h diagram (Fig. 10), the differences between k0 and k90 are the largest with material “aniso I”, while they are the smallest with the material “aniso III”..
4.5 Influence of the Strain History of Used Material
To reduce disturbances defined by Allwood et al. [1] and to enable the feed-forward controls in a manner similar to those described by Heingärtner et al. [23] during sheet metal forming, the indentation test can Table 4. Hill’s ratios of selected materials*
Name R22 R33 R12 Source
Iso 1 1 1 well known
Aniso I 1.254 1 1 [17]** Aniso II 1.107 0.956 1.079 AW 5754-H22 Aniso III 1.077 1.017 1.198 [34]*** * Ratios R11, R12 and R23 are in all cases equal to 1
** Wu et al. [17] used bulk material
*** Inal et al. [34] analysed deep drawing process, not ball indentation
Fig. 10. Diagram su – h for different angles to rolling directions and with different anisotropic material properties
be used for the evaluation of the strain history of the material used, as represented in Fig. 12a. The light gray flow curve represents the material properties for annealed material (e.g. AW 5754-O condition) in the entire range from Rp to σf100 reached at εe,max. After sheet metal rolling of such material, the initial value of flow stress Rp is raised to σfi (beginning of the continuous curve). The same flow stress changes are also expected to happen during the deep draw forming process however, the flow stress after the forming is σfi+1 (end of the continuous curve). The values of flow stress at σfi are important for setting-up the forming process, while the stresses after the forming process and all subsequential forming operations can be digitally determined with FEM simulations. However, on automated production lines, the process uncertainties causing variation of material flow stress at particular part areas after the forming operation are to evaluate on-line in the future. For this purpose, the indentation test is to integrate into the process lines.
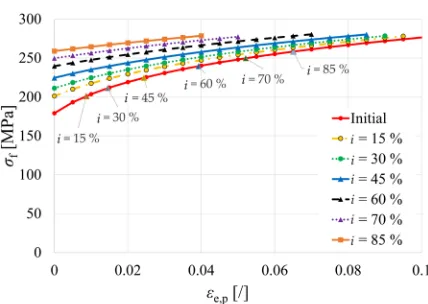
To understand the influential testing parameters and to design optimal indentation test, FE simulations of different pre-hardened material states were performed. As already discussed, for this study, the as-delivered AW 5754-H22 material is used. Therefore,
the entire flow stress range Δσf from yield stress
Rp = 174.9 MPa up to true stress σf = 274.3 MPa at εe,max (Eq.7) was experimentally acquired. In this step, each executed FE simulation was done with different starting true stress σfi (Eq.8) representing the rise of flow stress due to various cold rolling operation in the production of sheet metal. Index i is the percentage of flow stress range rise before the sheet metal forming stage where the values of i = 15 %, 30 %, 45 %, 60 %, 70 %, and 85 % were used. For the purpose of analysis, the unknown pre-strain shifting of initial coordinate point of strain axis (virtual shift) as shown in Fig. 12b for the case of εi45 is performed. Fig. 13 shows the σf – εe,p flow curves of virtual pre-hardened material used in FE simulations of the indentation test compared to the flow curve of initial material.
∆σf =σf100−Rp, (7) σfi=R ip+ ⋅∆σf. (8)
As mentioned, when defining material properties of the AW 5754-H22, the presented paper uses the Swift approximation power low due to better fitting of its material properties. Finally, no indentation test method considering the Swift hardening power law was found in the literature.
The indentation test at different forming steps i was simulated using the Swift hardening law. Since at
compression loading significantly higher strains can be reached prior to material failure, as in the case of tensile loading, the maximal plastic strain of the initial material in all FE simulations of indentation test were set to εe,p,max = 1. The su versus h correlations at rolling direction (θ = 0°) obtained from FE simulations are presented in Fig. 14a. The maximum values of each obtained line correspond to the obtained value of selected maximal plastic strain. However, the factors
Fig. 12. Material property σf – εe,p curve: a) production life cycle b) usage in FE simulation
i are connected to the percentage of pre-strain values presented in Fig. 14a for these pre-strain values, the maximal attainable plastic strain was decreased, as shown in Fig. 14a. It can be observed that the indenter depth depends on percentage i of the pre-strain, where at higher forming percentages i lower indentation depth h is reached. The present study shows that percentage of the pre-strain i increases the gradient of the linear correlation describing the su–h relationship (steeper slope). Fig. 14b is an example of the increased gradient of the su–h line due to the pre-strain difference between initial and i = 45 % pre-strained material. It is also evident that anisotropy does not influence the gradient increase if pile-up in different directions (θ = 0°, θ = 45° and θ = 90°) was observed (Fig. 14b).
Fig. 14. Influence of strain history on ball indentation test a) complete pre-strain range and b) only initial and i = 45 %
For each FE simulated set of data points at particular pre-strain, the linear trendline was approximated in order to obtain the parameters of linear correlation, and the gradient k was extracted. Fig. 15 presents the relationship between gradient k and pre-strain values. It is evident that the relationship k versus εe,p can also be described with a power
function. An entirely new correlation is introduced, as shown in the Eq. (9):
k a f= ⋅
(
0+εe,p)
b, (9)where a is the constant of the introduced power function, f0 initial shift regarding the coordinate system and b the function’s exponent. Particular parameters of the determined power function are shown in Table 5 for all three directions regarding the material rolling. The introduced function is valid for the AW 5754-H22 material and its generalization needs to be further analysed. However, this function can be introduced into the DFMCF system.
Table 5. Power function parameters
θ [°] a [-] f0 [-] b [-] 0 0.372 0.0214 0.186 45 0.339 0.0239 0.222 90 0.3 0.0211 0.242
Fig. 15. Relations between the k (gradient of the linear trendline) and true strain εe,p
5 CONCLUSIONS
The following conclusions can be stated from the presented study:
aluminium alloy AW 5754-H22 was conducted and approximated with Swift hardening power law.
b) The pile-up effect is influenced by indenter diameter D and corresponding indenter depth hp. The combination of indenter diameter D, indenter depth hp and material thickness s was analysed to select proper dimension D for experimental work, for which the existence of the elastic area under the indenter must be present. The relation between indenter depth hp and the value of the pile-up su have to belinear for quality measurements. The slope of the linear relationship su – hp depends on indenter diameter D its smaller value leads to a steeper line. In the case of the missing elastic area under the contact surface (e.g., when the material thickness s is too small), the relationship between indenter depth hp and pile-up value su becomes non-linear, and the gradient of the curve starts to decrease. Material AW 5754-H22 with a thickness of s = 3 mm and the indenter with diameter D = 1 mm were selected for experimental verification. c) Friction has significant influence on the
pile-up effect, and it decreases the pile-pile-up value su. Therefore, for the numerical simulations a proper friction coefficient needs to be inserted into the FE models. Comparative analyses among FE simulations of the indentation process and experimental work have shown good fit for friction coefficient of µ = 0.2 being used for all consecutive numerical analyses.
d) The anisotropic behaviour of material properties plays a significant role in pile-up mapping. In the case of anisotropic material, the pile-up values are directional dependent. Evaluating the relationship su – h, it was found that the pile-up at θ = 45° has the nearest slope to the isotropic one while at θ = 0° the slope is increased and, vice versa, at θ = 90° it is lower as in the case of isotropic material. In the future research work, the indentation test will be integrated into the sheet metal forming process, and the relation between pile-up values and Lankford’s r-values will be determined.
e) The forming history can be recorded with the indentation test shown on the case of aluminium alloy AW 5754-H22. Various material pre-strains caused by cold rolling deliver steeper su – hlines, and the target true equivalent plastic strain εe,p is reached at smaller indentation depth h.
f) An entirely new correlation of the slope of the linear relationship of su versushas a function of pre-strain was introduced, leading the AW
5754-H22 material to the potential equation correlating the factors k, εe,p and new introduced parameters a, f0 and b.
g) Further research work is oriented towards the design of an experiment to establish the connection between the knowledge build-up group and control function generator group and experimentally prove the presented on-line forming process feed-forward control function.
6 ACKNOWLEDGMENTS
This paper is part of research work within the program Nr. P2-0248 entitled Innovative Production Systems financed by the Slovene Ministry of Education, Science and Sport. The authors are very grateful for the financial support. The authors express also thanks to the CEEPUS programme, which enabled the authors’ mobility in the frame of the network Nr. CEEPUS III - HR 0108.
7 REFERENCES
[1] Allwood, J.M., Duncan, S.R., Cao, J., Groche, P., Hirt, G., Kinsey, B., Kuboki, T., Liewald, M., Sterzing, A. ,Tekkaya, A.E. (2016). Closed-loop control of product properties in metal forming.
CIRP Annals - Manufacturing Technology, vol. 65, no. 2, p. 573-596, DOI:10.1016/j.cirp.2016.06.002.
[2] Kim, M., Marimuthu, K.P., Lee, J.H., Lee, H. (2016). Spherical indentation method to evaluate material properties of high-strength materials. International Journal of Mechanical Sciences, vol. 106, p. 117-127, DOI:10.1016/j. ijmecsci.2015.12.008.
[3] Schindler, H.-J. (2005). On quasi-non-destructive strength and toughness testing of elastic-plastic materials. International Journal of Solids and Structures, vol. 42, no. 2, p. 717-725, DOI: 10.1016/j.ijsolstr.2004.06.029.
[4] Tabor, D. (2000). The hardness of metals. Clarendon Press. [5] Sonmez, F.O., Demir, A. (2007). Analytical relations between
hardness and strain for cold formed parts. Journal of Materials Processing Technology, vol. 186, no. 1-3, p. 163-173, DOI:10.1016/j.jmatprotec.2006.12.031.
[6] Pham, T.-H., Phan, Q.-M., Kim, S.-E., (2018). Identification of the plastic properties of structural steel using spherical indentation. Materials Science and Engineering: A, vol. 711, p. 44-61, DOI:10.1016/j.msea.2017.10.097.
[7] Hill, R. (1998). The Mathematical Theory of Plasticity. Clarendon Press, Oxford.
[8] Johnson, K.L. (1985). Contact Mechanics. Cambridge University Press, Cambridge.
[9] Hill, R., Storakers, B., Zdunek, A. B. (1989). A Theoretical Study of the Brinell Hardness Test. Proceedings of the Royal Society A Mathematical, Physical and Engineering Sciences, vol. 423, p. 301–330, DOI:10.1098/rspa.1989.0056. [10] Yonezu, A., Tanaka, M., Kusano, R., Chen, X. (2013). Probing
A numerical approach. Computational Materials Science, vol. 79, p. 336-344, DOI:10.1016/j.commatsci.2013.05.020. [11] Taljat, B., Pharr, G.M. (2004). Development of pile-up during
spherical indentation of elastic-plastic solids. International Journal of Solids and Structures, vol. 41, no. 14, p. 3891-3904, DOI:10.1016/j.ijsolstr.2004.02.033.
[12] Karthik, V., Visweswaran, P., Bhushan, A., Pawaskar, D. N., Kasiviswanathan, K. V., Jayakumar, T., Raj, B. (2012). Finite element analysis of spherical indentation to study pile-up/ sink-in phenomena in steels and experimental validation.
International Journal of Mechanical Sciences, vol. 54, p 74– 83, DOI:10.1016/j.ijmecsci.2011.09.009.
[13] ISO / TR 29381.2008. Metallic materials — Measurement of Mechanical Properties by an Instrumented Indentation Test — Indentation Tensile Properties. International Organization for Standardization, Geneva.
[14] Wang, M., Wu, J., Hui, Y., Zhang, Z., Zhan, X., Guo, R. (2017). Identification of elastic-plastic properties of metal materials by using the residual imprint of spherical indentation.
Materials Science and Engineering: A, vol. 679, p. 143-154, DOI:10.1016/j.msea.2016.10.025.
[15] Shen, L., He, Y., Liu, D., Gong, Q., Zhang, B., Lei, J. (2015). A novel method for determining surface residual stress components and their directions in spherical indentation.
Journal of Materials Research, vol. 30, no. 8, p. 1078-1089, DOI:10.1557/jmr.2015.87.
[16] Petryk, H., Stupkiewicz, S., Kucharski, S. (2017). On direct estimation of hardening exponent in crystal plasticity from the spherical indentation test. International Journal of Solids and Structures, vol. 112, p. 209-221, DOI:10.1016/j. ijsolstr.2016.09.025.
[17] Wu, J., Wang, M., Hui, Y., Zhang, Z., Fan, H. (2018). Identification of anisotropic plasticity properties of materials using spherical indentation imprint mapping.
Materials Science and Engineering: A, vol. 679, p. 143-154, DOI:10.1016/j.msea.2018.02.001.
[18] Banabic, D. (2010). Sheet Metal Forming Processes. Springer, Berlin, Heidelberg.
[19] Aleksandrović, S., Stefanović, M., Dragan, A., Lazić, V. (2009). Variation of normal anisotropy ratio “r” during plastic forming.
Strojniški vestnik - Journal of Mechanical Engineering, vol. 55, no. 6, p. 392-399.
[20] Starman, B., Vrh, M., Halilovič, M., Štok, B. (2014). Advanced modelling of sheet metal forming considering anisotropy and young’s modulus evolution. Strojniški vestnik - Journal of Mechanical Engineering, vol. 60, no. 2, p. 84-92, DOI:10.5545/sv-jme.2013.1349.
[21] Gusel, L., Boskovic, V., Domitner, J., Ficko, M., Brezocnik, M. (2018). Genetic programming method for modelling of cup height in deep drawing process. Advances in Production Engineering & Management, vol. 13, no. 3, p. 358-365, DOI:10.14743/apem2018.3.296.
[22] Senveter, J., Balic, J., Ficko, M., Klancnik, S. (2016). Prediction of technological parameters of sheet metal bending in
two stages using feed forward neural network. Tehnički
vjesnik - Technical Gazette, vol. 23, no. 4, p. 1155-1161, DOI:10.17559/TV-20141201225004.
[23] Heingärtner, J., Fischer, P., Harsch, D., Renkci, Y., Hora, P. (2017). Q-Guard – an intelligent process control system.
Journal of Physics: Conference Series, vol. 896, p. 012032, DOI:10.1088/1742-6596/896/1/012032.
[24] Balasubramanian, M., Ganesh, P., Ramanathan, K., Kumar, V.S.S. (2017). An Experimental Investigation and Numerical Simulation in SPF of AA 5083 Alloy using Programming Logic Control Approach. Strojniški vestnik - Journal of Mechanical Engineering, vol. 63, no. 4, p. 255-264, DOI:10.5545/sv-jme.2016.3721.
[25] Keran, Z., Kondić, Ž., Piljek, P., Runje, B. (2018). Accuracy of model force prediction in closed die coining process. Strojniški vestnik - Journal of Mechanical Engineering, vol. 64, no. 4, p. 225-232, DOI:10.5545/sv-jme.2017.5103.
[26] EN 485-2.2016. Aluminium and Aluminium Alloys - Sheet, Strip and Plate - Part 2. Mechanical Properties. European Standards, Brussels.
[27] ISO 6892-1.2016. Metallic Materials - Tensile Testing - Part 1. Method of Test at Room Temperature. International Organization for Standardization, Geneva.
[28] EN ISO 10275.2014. Metallic Materials - Sheet and strip - Determination of Tensile Strain Hardening Exponent. European Standards, Brussels.
[29] Atzema, E.H. (2016). Formability of Auto Components. Elsevier, Amsterdam.
[30] Syngellakis, S., Habbab, H., Mellor, B.G. (2017). Finite element simulation of spherical indentation experiments. International Journal of Computational Methods and Experimental Measurements, vol. 6, no. 4, p. 749-763, DOI:10.2495/CMEM-V6-N4-749-763.
[31] Trzepieciński, T., Lemu, H.G. (2014). Frictional conditions of AA5251 aluminium alloy sheets using drawbead simulator tests and numerical methods. Strojniški vestnik - Journal of Mechanical Engineering, vol. 60, no. 1, p. 51-60, DOI:10.5545/sv-jme.2013.1310.
[32] Duran, D., Karadogan, C. (2016). Determination of Coulomb’s friction coefficient directly from cylinder compression tests.
Strojniški vestnik - Journal of Mechanical Engineering, vol. 62, no. 4, p. 243-251, DOI:10.5545/sv-jme.2015.3141.
[33] Yamashita, T. (1996). Analysis of Anisotropic Material. Russ College of Engineering and Technology, Ohio University, Athens.
![Table 1. The basic mechanical properties of the AW 5754-H22 [26]](https://thumb-us.123doks.com/thumbv2/123dok_us/8947948.1857316/5.598.316.533.269.303/table-basic-mechanical-properties-aw-h.webp)