Patron: Her Majesty The Queen Rothamsted Research Harpenden, Herts, AL5 2JQ Telephone: +44 (0)1582 763133 Web: http://www.rothamsted.ac.uk/
Rothamsted Repository Download
A - Papers appearing in refereed journals
Chambers, W. E. 1953. Nutrient composition of the produce of the
Broadbalk continuous wheat experiment I. Changes over seventy years.
The Journal of Agricultural Science. 43 (4), pp. 473-478.
The publisher's version can be accessed at:
•
https://dx.doi.org/10.1017/S0021859600057944
The output can be accessed at:
https://repository.rothamsted.ac.uk/item/96y0v/nutrient-
composition-of-the-produce-of-the-broadbalk-continuous-wheat-experiment-i-changes-over-seventy-years.
© Please contact [email protected] for copyright queries.
NUTRIENT COMPOSITION OF THE PRODUCE OF THE
BROADBALK CONTINUOUS WHEAT EXPERIMENT
I. CHANGES OVER SEVENTY YEARS
BY W. E. CHAMBERS Rothamsted Experimental Station, Harpenden, Herts*
(With One Text-figure) The Broadbalk wheat experiment was started by
Lawes and Gilbert in 1843; since then wheat has been grown continuously on the same land under a variety of manurial conditions. Prior to 1843 Broadbalk had long been farmed as an arable field, and the last manuring, before the experiment began, was in 1839. During the first 8 years of the experi-ment the fertilizer treatexperi-ments were changed con-siderably, but since 1852 the treatments have remained substantially the same. In later years weed infestation increased and in 1925 fallowing of part of the field each year was introduced.
Lawes & Gilbert (1884) examined the crop yield data and analysed many samples of plant ash for the years 1852 to 1871. In order to determine the slow changes in crop composition they analysed 10-year bulked samples of the ash of grain and of straw from ten plots. They also investigated the changes in crop composition in different seasons by analysing the produce of the same ten plots for two good and two bad seasons, and the produce of three plots for ten consecutive seasons. These results showed that the composition of straw ash varied with fertilizer treatment and with the season, but the composition of the grain ash was remarkably constant and only varied slightly with fertilizer treatment and with the degree of maturity.
Lawes and Gilbert subsequently analysed bulked samples for the years 1872-81 and 1882-91, but these results have never been published in full. In the present paper analyses are given for the grain and straw produce from nine plots for the years 1892 to 1901. These results are not strictly com-parable with the previous decades, as some of the samples had been destroyed or contaminated by mice. Annual samples of the produce from the same nino plots for each year from 1901 to 1921 have also been analysed. Thus analytical results are available for the seven complete decades before fallowing was introduced.
COMPARISON OF ANALYTICAL METHODS All the analysis results given in the present paper have been obtained by the Lundegardh flame method of spectrographic analysis (Lundegardh, 1934; Mitchell, 1948). This method is especially * Now at Royal Agricultural College, Cirencester, Gloucestershire.
suitable for the analysis of solutions containing the chlorides of potassium, magnesium, calcium, sodium and manganese. Hale (1947) found that these elements could be extracted quantitatively with 1-0 N-HC1 from dried and ground plant material.
In the analysis of Broadbalk produce 2-5 g. of dried and ground plant material were extracted with 50 ml. of 1-0 N-HC1 for 24 hr. with occasional stirring. Solutions obtained in this way were used directly for the determination of sodium and magnesium, but were diluted for potassium and calcium determinations. Some organic matter was extracted, and this caused frothing in the atomizer vessel with the undiluted solutions. This did not appear to affect the performance of the atomizer since comparisons of the extraction procedure with dry ashing at 450° C. (the method used by Lawes and Gilbert) gave differences which were within the limits of accuracy of the analytical method (Table 1). The Lundegardh method was also compared with gravimetric analysis of potassium as perchlorate (A.O.A.C., 1945). Again the differences between the two methods were very small.
Table 1. Comparisons of analytical methods
Wheat grain: Ashed Extracted Wheat straw:
Ashed Extracted Wheat straw:
Ashed Extracted Gravimetric
o /oK % C a % M g % N a
0-45 0-026 0-08 0-004 0-45 0030 009 0004
0-46 0-34 009 0030 0-44 0-36 0-09 0-033
1-11 0-19 005 0-009 1-09 0-21 0-05 0-010 1-08 — — — Wheat straw: Repeated analysis of the same sample. Mean 0-71 0-34 007 0-022 S.D. 0-02 0-024 0-005 0-0016 S.D. as % of mean 3-0 7-0 7-1 7-3
474
The Broadbalk continuous wheat experiment
CHANGES IN CROP COMPOSITION, 1852 TO 1921
In the first few years of the experiment yields diminished rapidly on the plots not receiving nitrogen, but on the other plots the effects of un-balanced manuring appeared more slowly. These changes have been described by Russell & Watson (1940), and are summarized in Table 2.
The effect of fertilizer treatment on the nutrient concentration in the grain was always small. On the plots which received potassium the concentra-tion of potassium in the grain was slightly in-creased and on the plots which did not receive potassium, the calcium concentration was slightly increased. Magnesium and sodium concentrations in the grain were unaffected by fertilizer treatment. During the seven decades there was a gradual
Table 2. Yield and composition of Broadbalk produce
(a, mean value 1852-1921 (omitting decade 1892-1901); 6, mean change per decade)
'lot 2 3 5 7 10 11 12 13 14 2 3 5 7 10 11 12 13 14 Treatment
14 tons dung Nil PKNaMg NPKNaMg N N P NPNa NPK NPMg
14 tons dung Nil PKNaMg NPKNaJlg N N P NPNa N P K NPMg Fertilizer treatment
Yield (ewt/acre) K % of dry matter Ca % of dry matter Mg % of dry matter
a 19-8 6-9 8-0 17-9 11-2 12-7 161 17-3 15-9 34-6 10-0 11-7 32-2 18-4 21-8 27-3 311 27-3 per acre: N P K
> t b
-0-07 - 0 4 6 -0-44 -0-61 -0-68 -1-03 -0-88 -0-56 -1-12 0-64 -0-96 -0-85 -0-98 -1-31 -1-48 -1-52 -0-65 -1-92
= 3-5 cwt. = 3-5 cwt. = 2-0 cwt. Na = l-0 cwt. Mg = 1-0 cwt.
a 0-50 0-52 0-53 0-50 0-48 0-48 0-50 0-51 0-49 1-18 0-82 1-04 112 0-63 0-51 0-68 110 0-70 b Grain - 0 0 1 2 -0-019 -0-014 -0026 -0-015 -0-012 -0-015 -0-010 - 0 0 1 4
a
i 0 0 4 0 0 4 0-04 0-04 0 0 5 0-05 0-04 0-04 0 0 4
Straw 0064 0014 0-015 0015 -0-027 - 0 0 4 0 -0-058 0009 -0-051 ammonium sulphate superphosphate (0-28 0-19 0-23 0 1 8 0-22 0-29 0-31 0-26 0-21 0-25 6
- 0 0 0 1 -0-002 -0-002 -0-002 -0-002 -0-002 0 0 0 0 -0-001
- 0 0 0 1 - 0 0 0 5 -0-005 - 0 0 0 6 0-008 0-007 0-005 - 0 0 0 3 0-004
and chloride (0-77 ! cwt.P)
potassium sulphate (0-74 cwt. K) sodium sulphate (0-14 cwt. magnesium sulphate(0-10 cwt. Mg). Na) Except plot 12, NPNa, Na = 3-25 cwt. sodium
Except plot 14, NPMg, Mg =
a
0 1 3 0-12 0-12
0 1 2
0 1 1 0 1 1 0 1 1 0-12 0 1 2
0 0 6 0 0 6 0-06 0 0 5 0 0 6 007 0 0 6 0 0 5 007
cwt. N)
sulphate (0-46 cwt. Na = 2-5 cwt. magnesium sulphate (0-25 cwt.
6
-0-006 -0-005 -0-004
- O O O 3
-0-005 -0-002 -0-004 -0-005 -0-004 0-002 0001 0-001 0 0 0002 0-002 0-003 0 0 0-004 )•
Mg)-Na parts per million of dry
matter A a 3 4 3 3 3 4 4 3 3 7 11 8 9 29 54 48 5 26 6 0-41 0-40 0-42 0-59 0-64 0-74 0-62 0-60 0-53 0-67 0 1 5 0-45 -0-37 -1-25 1-69 9-73 0-32 3-54
The mean yields varied considerably with fertilizer treatment, the lowest mean yield (nil plot) was about one-third of the best yield (dung plot). The nil and P K Na Mg plots always yielded much less than the other plots, and in the first year of the experiment these two plots demonstrated the need for nitrogen. Other differences were also apparent in the early years. The yields with N, NP, and NPK showed responses to phosphorus and potassium. The yields on the NPNa and NPMg plots in the first few years were nearly the same as the NPK yield, but in later years the deterioration was much greater with both NPNa and NPMg. Similarly, the initial benefit from the smaller amounts of sodium and magnesium supplied on the NPKNaMg plot was not maintained, and the reduction in yield on this plot was more rapid than on the NPK plot.
reduction in the potassium, calcium and magnesium concentrations in the grain. This change, which was very similar on all plots, occurred gradually and very regularly. There is evidence that the early analyses for sodium were unreliable and the same trend might have occurred with sodium.
The concentrations of the other bases, calcium, magnesium and sodium, appeared to be controlled by the potassium supply. On the plots which received potassium the concentrations of these bases changed very little in 70 years. On the plots where potassium was omitted the concentrations in the straw of calcium, magnesium and sodium were greater in the first decade and increased in subsequent decades. The increases in calcium con-centration, expressed in equivalents, were much greater than the increases in magnesium and sodium concentrations, and it seemed that calcium became more important than sodium and magnesium when the supply of potassium was reduced. The reduced potassium concentrations in the straw were not compensated by increased concentrations of calcium, magnesium, and sodium, and the total bases in the plant were reduced. The concentration of sodium in the straw was very small but was increased several times on the plots where potassium was not supplied, indicating some similarity between sodium and potassium to the wheat plant. There was no appreciable replacement of potassium by sodium as occurs with some other plants, e.g. sugar beet.
decades, but on all the other plots the decline in yield resulted in a reduction in nutrient uptake in the later decades, even when the nutrient concentra-tion increased.
The data of Tables 2 and 3 show remarkable similarities between the nil plot and the PKNaMg plot. In the absence of nitrogen, PKNaMg in the fertilizer did not alter yield or composition appre-ciably, except that the potassium content of the straw was increased to very high levels. The phosphorus content was probably affected similarly. The use of nitrogen alone increased the yield and also increased the uptake of nutrients when com-pared with the nil plot. In fact, the potassium removed in the crop was almost the same on the N plot as on the PKNaMg plot. On the N plot the crop also contained more calcium, magnesium and sodium. On the NP plot the crop contained more nutrients than the N only crop, while the crop on the NPNa and NPMg plots contained more nutrients still.
Sodium and magnesium in the fertilizer also increased nutrient uptake in the presence of nitrogen, phosphorus and potassium. Compared with the NPK plot the NPKNaMg plot produced
Table 3. Total nutrient content of Broadbalk produce, grain + straw
(a, mean value for six decades, 1852-1921 (omitting decade 1892-1901); b, mean change per decade.)
lb. K per acre lb. Ca per acre lb. Mg per acre lb. Na per acre
Plot
2 3 5 7 10
11 12
13 14
Treatment 14 tons dung
Nil
PKNaMg NPKNaMg
N NP
NPNa NPK NPMg
a
474 111 156 425 158
170 256
411 267
6 2 6 0
- 8-7 -10-4 -12-0 -13-4
-21-6 -30-5
- 9-2
-33-8 a 67-6 24-2 23-6 68-8 51-6 69-1 74-2 67-4 70-6
b
0-6
- 2 - 5 -2-6 -4-9 - 1 - 5 -3-4 -2-2 -2-8 - 3 - 5
a 42-8 13-3 15-8 36-4 21-8 27-8 32-6 33-2 35-8
b
0-5
-1-2 - 1 - 3 -1-9
- 1 0
-1-9
-1-8
-1-7 -1-9
a
2-7 1-3 1 1 3 1 5-3
11-9 12-9
2-1 6-8
b
0-3 - 0 1 0-0 - 0 1
- 0 - 3 - 0 - 3
2 1
0 1 0-4
On the plots where large quantities of sodium or magnesium were supplied the straw contained the highest concentrations of these elements. The main effect of sodium or magnesium in the fertilizer appeared to be on the potassium concentration in tho straw. The NPNa and NPMg plots not only yielded more than the NP plot but also produced straw with a higher concentration of potassium. Consequently, the total potassium in the crop was much greater.
The total nutrient content of the crop (grain + straw) varied with the season, and variations still persisted in the 10-year totals. The mean values of the 10-year totals and the mean change per decade in these values have been calculated (Table 3). On the dung plot the crop contained more nutrients in the later decades. On the NPNa and NPMg plots the uptake of sodium was greater in the later
a little more crop with slightly higher concentra-tions of potassium, calcium, magnesium and sodium in the straw.
RECOVERY OF APPLIED FERTILIZER
476
The Broadbalk continuous wheat experiment
figures a potassium balance sheet can be drawn up for each plot (Table 4).
On the two plots receiving nitrogen, phosphorus and potassium approximately half the fertilizer potassium was recovered in the crop. When nitrogen was omitted, and consequently the yield was very low, the recovery fell to about 20 %. The percentage recovery was also small on the dung plot, but this
After evaporation the solutions were analysed by the Lundegardh flame method. All these analyses have been calculated as cwt. potassium per acre by taking the weight of an acre of soil 9 in. deep as 2,590,000 lb. (Table 5).
The various methods of extraction displaced different amounts of potassium, but each method gave results which reflected fertilizer treatment.
Table 4. Potassium in the fertilizer and in the crop (lb per acre)
i
Plot number.. Treatment .. 1843-51 1852-1921 Total 1843-51 1852-1921 Total 2. 14 tons dung 9-8 105-2 1150 1-7 30-6 32-3 3 Nil cwt. 0-0 0-0 0-0 5 PK NaMg 7 NPK NaMg 10 N 11 NP
potassium in fertilizer per acre
5-0 52-9 57-9 3-7 52-8 56-5
cwt. potassium in the 1 0 6-9 7-9 1-9 9-8 11-7 1-7 27-0 28-7 0-5 0-0 0-5 0 1 0 0 0 1
crop per acre
1-8 9-4 110 1-7 10-3 120 28 —
Percentage recovery in crop 20 51 —
-12 4-4 0-0 4-4 1-7 15-3 17-0 13 1-7 25-4 27-1 14
NPNa NPK NPJIg
5-4 4-9 53-0 0 0 58-4 4-9
1-7 15-8 17-5
46 —
Table 5. Potassium extracted from Broadbalk soil (cwt. per acre)
Plot Treatment 2 3 5 7 10 11 12 13 14
14 tons dung Nil PKNaMg NPKNaMg N NP NPNa NPK NPMg
Samples taken September 1944, 0-9 in. Acetic acid 10-9 2-0 5-6 5-0 1-5 1-3 1-3 5-6 1-5 Ammonium acetate 12-4 2-8 8-0 6-7 2-0 1-9 2-0 6-1 2-0
N - H C I
150 3-3 8-7 7-5 2-4 2-1 2-2 7-3 2-5
Page and Williams analyses 0-9 in. 12-3 3-8 9-8 10-2 2-7 2-9 2-9 8-0 3-8 9-18 in. 9-4 3 1 10-2 8-2 3 1 2-2 2-9 8-3 2-7
K in fertilizer less K in crop 1843-1944 (extrapolated) 106-9 - 9-4 62-2 38-4 - 1 3 0 -13-7 -15-7 41-4 -15-7
was probably due to the very large amount of potassium supplied in the manure. Very little potassium was contained in the drainage water (Voelcker, 1871; Russell, 1950) and therefore nearly all the fertilizer potassium not recovered in the crop must have remained in the soil.
Page & Williams (1925), using Hissink's method, determined the exchangeable potassium in samples of soil taken from Broadbalk plots. Other samples of the top 9 in. of soil taken after harvest in 1944 have been analysed by three different methods:
(1) Leaching 6-25 g. air-dry sieved soil (2 mm.) with 250 ml. 0-5 N-acetic acid.
(2) Leaching 8 g. air-dry sieved soil (2 mm.) with 250 ml. 1-0 N-neutral ammonium acetate.
(3) Leaching 8 g. air-dry sieved soil (2 mm.) with
250 ml. 1-ON-HCI.
On the plots which had received potassium, only a fraction of the residual potassium could be accounted for in an exchangeable form in the soil. On the plots which had received little or no potas-sium the crop had extracted 3 or 4 times as much potassium as was contained in the soil in an ex-changeable form.
W. E. CHAMBERS
Table 6. Relation between net gain or loss of potassium and
readily soluble soil potassium
Extracting reagent 0-5 N-acetio acid 1-0 u-ammonium acetate
1-0 N-HCI
Extractable soil
Slope (cwt. K net gain K when no gain Potential by soil per cwt. or loss (cwt. K. K reserve extractable K) per acre) (cwt. per acre)
13-4±0-87 2-36 31-6 12-0±0-38 3-21 38-5 10-0±0-48 3-68 36-8
greater depths, and also, probably, to the crop taking potassium from greater depths. Unless both processes continuod down to 100 in. or more, fertilizer potassium was held in the soil in a form not extracted by the reagents used, and the crop must have extracted potassium which was not extracted chemically.
120-J
1008 0
60
40
2 0
-
o20 4 0 o20
-111J2
-A
/
/
^•3
,14
| 1
y
/
i i
/
i
0 2 4 6 8 10 12 Potassium extracted by N. ammonium acetate
(cwt./acre)
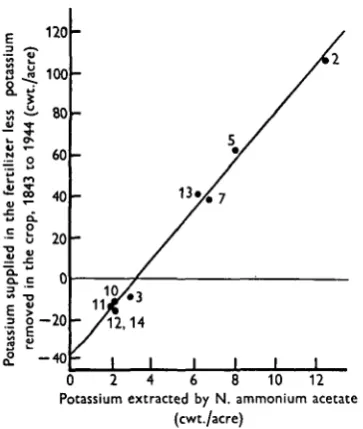
Fig. 1. Relation between exchangeable soil potassium and net gain or loss of potassium.
All three regressions indicated that there would be no exchangeable potassium in the top 9 in. of soil on a plot where about 36 cwt. potassium per acre had been removed in the crop. Even on the most exhausted plot, less than half this potential potassium supply had been used by 1944. It was also possible to calculate from the regressions the extractable potassium in the soil from a plot where fertilizer supply equalled uptake by the crop. The composition of this hypothetical soil was not necessarily the composition of Broadbalk soil at the start of the experiment, since potassium might have been liberated or leached to lower levels during the 102 years of the experiment.
Journ. Agric. Sci. 43
SODIUM AND MAGNESIUM SULPHATES AS FERTILIZERS
The NPNa and NPMg plots gave higher yields than the NT plot and the crops from these two plots contained more potassium than the crop from the NP plot. The remarkable result was the similarity between the NPNa and NPMg plots.
The higher yields appeared to be due to the higher potassium status of the crops and not to the small increases in the sodium and magnesium concentra-tions in the crop (Table 2). This indicated that the sodium and magnesium sulphates increased the availability of soil potassium. The similarity between the two plots might have been due to an exchange reaction, since the sodium and magnesium sulphates were supplied in chemically equivalent amounts. Soil analyses showed that sodium and magnesium were not retained to the same extent. The amount of sodium extracted by ammonium acetate was increased only slightly by sodium sulphate in the fertilizer, while the amount of ex-changeable magnesium was considerably increased by magnesium sulphate (Table 7). Voelcker's analyses (1871) of the drainage water from Broad-balk also showed that magnesium was retained by the soil much more strongly than sodium.
Table 7. Cations displaced from Broadbalk soil
by N-ammonium acetate
Treat- Exchangeable Exchangeable Exchangeable Plot ment K Mg Na
11 NP 0-21 0-44 0-20 12 NPNa 0-22 0-42 0-26 13 NPK 0-67 0-40 015 14 NPMg 0-22 1-37 0-19
Comparison with t h e N P plot shows t h a t sodium a n d magnesium sulphates did n o t deplete t h e exchangeable soil potassium, a n d t h e increased availability of potassium on t h e N P N a a n d N P M g plots m u s t have been due to increased mobilization of non-exchangeable forms of potassium. Evidence h a s been obtained t h a t Broadbalk soil contained large reserves of potentially available potassium held in non-exchangeable forms. The exhaustion of these reserves was shown b y t h e more r a p i d
478
The Broadbalk continuous wheat experiment
deterioration in yield and in the potassium status of the crop on the NPNa and NPMg plots when compared with the NP plot.
It is unlikely that the sulphate ion increased the availability of potassium. Both the nitrogen and the phosphorus constituents of the fertilizer con-tained large amounts of sulphate, and little effect would be expected from the additional sulphate supplied as sodium or magnesium sulphates. It appears that in spite of the dissimilarity between sodium and magnesium ions in exchange reactions, these ions are equally effective, when supplied in equivalent amounts, in liberating potassium from non-exchangeable forms.
SUMMARY
1. A rapid extraction procedure of dried and ground plant material has been used in conjunction with the Lundegardh flame method of spectro-graphic analysis. The accuracy of the analysis has been estimated, and the method has been shown
to be comparable with ashing and gravimetric analysis.
2. The effect of fertilizer treatment on yield and on the nutrient composition of the crop has been outlined. The changes which occurred in the period 1852 to 1921 have been summarized by linear regressions fitted to 10-year means.
3. The recovery of potassium was estimated, and the exhaustion or accumulation of potassium was shown to be related to exchangeable potassium in the surface soil.
4. Sodium and magnesium sulphates used as fertilizers were shown to increase crop yield by increasing the potassium supply to the crop. It has been shown that the extra potassium came from non-exchangeable forms.
The author wishes to express his indebtedness to Dr E. M. Crowther and the late Dr J. B. Hale for much help and many valuable discussions. Part of this paper is based upon a portion of a thesis approved for the Ph.D degree of London University.
REFERENCES
A.O.A.C. (1945). Methods of Analysis of the Association
of Official Agricultural Chemists, 6th ed. p. 122.
HALE, J. B. (1947). J. Agric. Sci. 37, 236.
LAWES, J. B. & GILBERT, J. H. (1884). J. Chem. Soc. 45,
305.
LTJNDEGAKDH, H. (1934). Die qualitative Spektralanalyse
der Elemente, vol. n. Jena: Gustav Fischer.
MITCHELL, R. L. (1948). The spectrographic analysis of soils, plants and related materials. Tech. Commun.
Bur. Soil Sci., Harpenden, no. 44.
PAGE, H. J. & WILLIAMS, W. (1925). Trans. Faraday
Soc. 20, 573.
RUSSELL, E. J. (1950). Soil Conditions and Plant
Growth, 8th ed. p. 502. London: Longmans. RUSSELL, E. J. & WATSON, D. J. (1940). Rothamsted
experiments on the growth of wheat. Tech. Commun.
Bur. Soil Sci., Harpenden, no. 40.
VOELCKEK, A. (1871). J. Chem. Soc. 24, 276.