DEMOGRAPHIC RESEARCH
VOLUME 30, ARTICLE 60, PAGES 1639
−
1652
PUBLISHED 23 MAY 2014
http://www.demographic-research.org/Volumes/Vol30/60/ DOI: 10.4054/DemRes.2014.30.60
Descriptive Finding
Three-generation family households in early
childhood: Comparisons between the United
States, the United Kingdom, and Australia
Natasha V. Pilkauskas
Melissa L. Martinson
©2014 Natasha V. Pilkauskas & Melissa L. Martinson.
This open-access work is published under the terms of the Creative Commons Attribution NonCommercial License 2.0 Germany, which permits use, reproduction & distribution in any medium for non-commercial purposes, provided the original author(s) and source are given credit.
1 Introduction 1640
2 Data and methods 1641
2.1 Data 1641
2.2 Measures 1642
2.3 Method 1643
3 Results 1643
4 Discussion 1648
5 Acknowledgments 1649
Three-generation family households in early childhood:
Comparisons between the United States, the United Kingdom, and
Australia
Natasha V. Pilkauskas1
Melissa L. Martinson2
Abstract
BACKGROUND
Shifting demographic trends in the United States (US) have resulted in increasing numbers of three-generation family households, where a child lives with a parent(s) and grandparent(s). Although similar demographic trends have been occurring in the United Kingdom (UK) and Australia, very little research has studied three-generation coresidence in these countries and no research has documented trends cross-nationally.
OBJECTIVE
We investigate differences in the rates of three-generation coresidence in early childhood cross-nationally.
METHOD
This study uses three longitudinal birth cohort studies to investigate cross-national differences in three-generation coresidence in early childhood: the Early Childhood Longitudinal Study – Birth Cohort for the US, the Millennium Cohort Study for the UK, and the Longitudinal Study of Australian Children – Birth Cohort.
RESULTS
We find that nearly one-quarter of US children live in a three-generation household during early childhood, compared to 8% of children in the UK and 11% in Australia. Although there are large differences in the frequency of coresidence cross-nationally, we find that similar demographic groups live in three-generation households across contexts. In general, younger, less educated, lower income, and minority mothers are more likely to live in three-generation households in all three countries.
1 Columbia Population Research Center and Columbia University’s School of Social Work, Columbia
University, USA. E-Mail: [email protected].
1. Introduction
Demographic shifts over the last 40 years, away from marriage, toward increased cohabitation and non-marital childbearing, have resulted in increasingly complex living arrangements. The simultaneous aging of the population is likely to increase reliance between generations (Bengtson 2001), leading to more three-generation family households, in which a child lives with their parent(s) and one or more grandparents. In the United States, three-generation households have increased in prevalence over the last decade (Dunifon 2013; Kreider and Ellis 2011), but less is known about peer countries such as the United Kingdom and Australia, and research documenting these households cross-nationally is lacking.
Understanding the prevalence of three-generation households is important, as family structure is closely linked with family wellbeing. Although three-generation coresidence is associated with lower levels of material hardship (Mutchler and Baker 2009), evidence about the effects of these households on child wellbeing is mixed (Dunifon 2013). As living arrangements affect the resources available for child development, such as income or supervision, we focus on the prevalence of three-generation households in early childhood, when coresidence is most common (Fields 2003) and the family context is most strongly linked with child development (Demo and Cox 2000).
Using data from three nationally representative longitudinal birth cohort studies, we document the cross-national prevalence of three-generation family households in early childhood (from birth to age five) in the US, the UK, and Australia. Cross-national studies of household structure put demographic trends within countries into context within the broader scope of differences in social and cultural norms, housing preferences (availability and cost), and social policies that may encourage or discourage independent living arrangements. In addition, understanding the cross-national prevalence of three-generation households may also help researchers understand variation in child development across contexts. We study the US, the UK, and Australia because although all three countries are increasingly diverse English-speaking countries with large immigrant populations, they vary in terms of social policies and benefits available to families. These three countries have also experienced similar demographic shifts toward non-marital childbearing and have aging populations.
however, excluding individuals under 65 omits many three-generation households where the oldest generation is younger (Mutchler and Baker 2004). In the US, three-generation households have been increasing in prevalence since the 1980s (Taylor et al. 2010) and about 8% of children lived in a three-generation household in 2011 (Kreider and Ellis 2011). Studies of the UK have found that three-generation family households have declined in England and Wales since 1981 (Glaser and di Gessa 2012), with 3.4% of UK children living in a three-generation family household in 2007 (Iacovu and Skew 2010). Figures from Australia show that multigenerational coresidence increased by 27% between 1981 and 2001 (Liu and Easthope 2012) and about 60,000 Australian children lived in a three-generation family household in 2001 (Brandon 2004).
Cross-sectional estimates of prevalence provide point-in-time estimates of the number of children in three-generation family households but they cannot capture the significance of this family structure in the lives of children over time. Studies conducted in the US have found prevalence rates that are three to four times higher over time than in a cross-section (Beck and Beck 1984, 1989), and a recent study found that 43% of urban children lived in a three-generation household by age nine (Pilkauskas 2012). This paper extends earlier research by studying the cross-national prevalence of three-generation living arrangements in early childhood using longitudinal data.
2. Data and methods
2.1 Data
Data come from the Early Childhood Longitudinal Study – Birth Cohort (ECLS-B) for the US, the Millennium Cohort Study (MCS) for the UK, and the Longitudinal Study of Australian Children – Birth Cohort (LSAC) for Australia. The ECLS-B is a nationally representative sample of approximately 10,700 children who were born in the US in 2001. In accordance with the National Center for Education Statistics, all sample sizes are rounded to the nearest 50. Children were sampled from birth certificates and data were collected when children were approximately nine months old, two years old, four years old, and five and a half years old – the start of kindergarten (Bethel et al. 2005). Approximately 6,850 respondents participated in all survey waves.
The MCS is a nationally representative survey of approximately 20,000 children born in the UK between 2000 and 2002. Data were collected when children were approximately ten months old, three years old, and five years old (Hansen 2010). Approximately 13,300 respondents completed all three surveys.
Medicare database (Australian Institute of Family Studies 2009). Data were collected when children were approximately nine months old, two-three years old, and five years old. Approximately 4,300 respondents participated in each survey wave.
2.2 Measures
Although the timing of the surveys varied slightly between the three datasets, we aimed to construct each measure to be comparable across countries. Where possible, measures are coded identically, and where it is not possible, differences are noted below.
Three-generation Family Household Structure. Three-generation family structure, or coresidence between a child, one or more parents, and one or more grandparents, is measured in three ways. First, we construct measures of coresidence with a grandparent (either one or both grandparents) at each survey wave. Second, we generate a measure indicating whether the child ever lived with a grandparent and parent at any of the survey waves. Finally, we construct a variable that captures both the stability of and transition patterns into or out of three-generation households in early childhood. We code households as stable generation (coresident all survey waves), never three-generation, those that start out three-generation and later move out, those that do not start out generation but later move in, and those with two or more three-generation transitions.
Demographic Characteristics. We study the characteristics of three-generation family households, compared to households that are not three-generation, using a number of demographic characteristics found to be important in previous research (Kamo 2000; Brandon 2012). In the US data, mother’s race/ethnicity is coded as non-Hispanic White, non-non-Hispanic Black, non-Hispanic, Asian (mostly East Asian), or other race. Data in the UK are coded as White, Black, Asian (mostly South Asian), or other. In the Australian data, race is not explicitly collected; however, information about immigrant status and whether the mother was indigenous can be combined to generate a racial/ethnic variable and is coded as Australian non-Indigenous, Australian Indigenous, English-speaking immigrant, Asian immigrant (largely East Asian), and other immigrant.
survey wave. Income at the first survey wave is divided into quintiles within each country.
2.3 Method
As this paper is descriptive in nature, we conduct simple bivariate analyses. In all three datasets, we weight the data to produce nationally representative estimates, to adjust for complex sampling design, and to produce robust standard errors (for t-tests).
3. Results
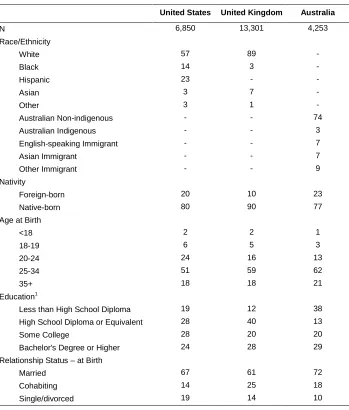
Table 1 provides a descriptive overview of the samples for each country. The countries are quite different in terms of mother’s racial/ethnic make-up. The UK and Australia are more White than the US and neither has Hispanic populations. About 7% of the population in the UK and Australia are Asian, whereas only 3% of the US population are Asian. Australia and the US have similar numbers of immigrants (about 20% of the population), whereas only 10% of the population in the UK are immigrants. Mother’s age distribution at the birth is similar cross-nationally. In terms of educational attainment, mothers in the UK are more likely to complete the equivalent of a high school degree compared to the US or Australia, but higher education levels are similar cross-nationally.
Table 1: Sample characteristics for US, UK, and Australia (%)
United States United Kingdom Australia
N 6,850 13,301 4,253
Race/Ethnicity
White 57 89 -
Black 14 3 -
Hispanic 23 - -
Asian 3 7 -
Other 3 1 -
Australian Non-indigenous - - 74
Australian Indigenous - - 3
English-speaking Immigrant - - 7
Asian Immigrant - - 7
Other Immigrant - - 9
Nativity
Foreign-born 20 10 23
Native-born 80 90 77
Age at Birth
<18 2 2 1
18-19 6 5 3
20-24 24 16 13
25-34 51 59 62
35+ 18 18 21
Education1
Less than High School Diploma 19 12 38
High School Diploma or Equivalent 28 40 13
Some College 28 20 20
Bachelor's Degree or Higher 24 28 29
Relationship Status – at Birth
Married 67 61 72
Cohabiting 14 25 18
Single/divorced 19 14 10
Note: Sample is restricted to children who participated in all survey waves. Percents are weighted to be nationally representative of births in each country. Ns are unweighted and for the US rounded to the nearest 50 as per IES requirements.
1
Figure 1: Three-generation households by child’s age: US, UK, and Australia
Note: Data are weighted to be nationally representative.
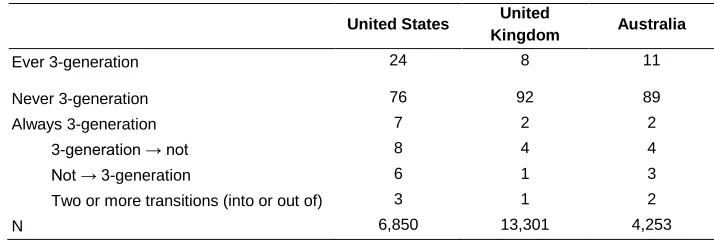
To study exposure to three-generation coresidence in early childhood, Table 2 documents the share of children who ever lived in a three-generation family household in early childhood and patterns of coresidence. Over the first five years of life, 24% of US children have spent some time in a three-generation family. In Australia a relatively large share of children have spent time in a three-generation household (11%) at some point in early childhood, whereas in the UK only 8% of children have lived in a generation family household by age five. In the UK nearly one-quarter of three-generation households (or 2% of children) stably coreside in a three-three-generation household over early childhood, whereas in the US and Australia only one-fifth of children in three-generation households stably coreside (or 5% and 2% of children respectively) over early childhood.
15
14
13
11
8
4 4
7
6
5
0 2 4 6 8 10 12 14 16 18
1 2 3 4 5
P
er
cen
t
Child's Age
Table 2: Prevalence, stability, and transitions patterns over early childhood (%)
United States United
Kingdom Australia
Ever 3-generation 24 8 11
Never 3-generation 76 92 89
Always 3-generation 7 2 2
3-generation → not 8 4 4
Not → 3-generation 6 1 3
Two or more transitions (into or out of) 3 1 2
N 6,850 13,301 4,253
Note: Data are weighted to be nationally representative of births. Sample is restricted to children who participated in all survey waves. Ns are unweighted and in the US are rounded to the nearest 50 as per IES requirements.
The cross-national rates of three-generation coresidence by key demographic characteristics are presented in Table 3. We find that in each country Asian households are significantly more likely to include three-generations than White households. In the US all minority groups are significantly more likely to be three-generation than White households, and in Australia indigenous populations are more likely than non-indigenous native-born households or English-speaking immigrants to include three-generations. When we focus on nativity status, foreign-born mothers are equally likely to live in a three-generation household as native-born mothers in the US. In comparison, in Australia and the UK foreign-born mothers are significantly more likely to live in a three-generation household than native-born mothers.
Table 3: Percent ever lived in a three-generation household by demographic characteristics for US, UK, and Australia
United States United Kingdom Australia
N 6,850 13,301 4,253
Race/Ethnicity
White 18 6 -
Black 34 7 -
Hispanic 31 - -
Asian 30 31 -
Other 34 18 -
Australian Non-indigenous - - 10
Australian Indigenous - - 22
English-speaking Immigrant - - 11
Asian Immigrant - - 20
Other Immigrant - - 12
Nativity
Foreign-born 23 18 14
Native-born 25 7 10
Age at Birth
<18 83 43 44
18-19 63 25 46
20-24 40 16 21
25-34 15 5 9
35+ 9 3 5
Education1
Less than High School Diploma 38 14 14
High School Diploma or Equivalent 30 9 14
Some College 24 8 11
Bachelor's Degree or Higher 7 4 6
Relationship Status – at Birth
Married 14 6 8
Cohabiting 31 7 13
Single/divorced 55 21 32
Income Quintile – at Birth
Bottom quintile 35 21 21
2nd quintile 30 10 11
3rd quintile 29 6 7
4th quintile 18 5 6
Top quintile 12 3 6
Note: Sample is restricted to children who participated in all survey waves. Percents are weighted to be nationally representative of births in each country. N's are unweighted and for the US rounded to the nearest 50 as per IES requirements.
1
4. Discussion
The goal of this study was to compare the prevalence of three-generation family households during early childhood cross-nationally and to compare differences in the characteristics of these households. We found that three-generation family households are most common in the US, but that in all three countries coresidence is most common during infancy and that over early childhood the percentage of families in three-generation family households declines.
Differences in the rates of coresidence across countries are likely to be the result of both different public policies and varying population compositions. Policies that support independent residence may reduce the need to live in a three-generation family household. For example, there are differences in the proportion of each country’s population living in social or publicly subsidized housing. In the UK 25% of all housing stock is social housing, whereas in the US and Australia only about 5% of the housing is publicly subsidized or social housing (Stone 2003; Australian Bureau of Statistics 2007). If lack of public housing leads to more three-generation coresidence, then public housing availability may partly explain higher rates of coresidence in the US. In addition, if public housing is more stable in the UK than the US and Australia, this could help explain why three-generation coresidence in the UK is slightly more stable than in those countries. Other government policies can affect the propensity to coreside. If US mothers under the age of 18 wish to receive welfare benefits, they are required to live with their parents. However, in the UK tax benefits and universal child benefits are provided to families with children, perhaps making independent living more feasible among the economically disadvantaged (Waldfogel 2010).
Population differences and cultural preferences may also drive differences in the propensity to coreside. We find in all three countries that minority groups (especially Asian families) are more likely to live in a three-generation household. The one exception is Black families in the UK, perhaps due to differences between US and UK Black populations (such as immigration history and income disparities). Minorities make up a larger share of the US population than that of the UK or Australia and this may partly explain differences in coresidence across countries. In addition, differences in nuclear family structure may also drive differences in three-generation living arrangements. Although rates of non-marital births in the US and the UK are relatively similar (and slightly lower in Australia: see de Vaus 2005), rates of cohabitation are much higher in the UK, and somewhat higher in Australia, than in the US. If single motherhood predicts coresidence, this might also explain the higher prevalence in the US.
three-generation coresidence in all three countries. Minority groups, younger mothers, single mothers, and mothers with lower levels of education and lower incomes had higher rates of three-generation coresidence across country contexts (with some minor differences).
This research has some limitations. The periodic nature of the data means we are likely to be underestimating the number of children in three-generation living arrangements. The timing and frequency of the surveys vary slightly cross-nationally, which may partly explain the higher rates of three-generation family households found in the US. The analyses are restricted to children who were in all survey waves, so we may overestimate the stability of these living arrangements. Lastly, attrition over time may influence the findings. Future research that can further elucidate the role of policy in determining three-generation coresidence would be helpful in understanding cross-national differences. Longitudinal research documenting three-generation living arrangements among older children is another important area for research. As the population ages in these countries, three-generation coresidence is likely to increase in prevalence, and it is important that we understand the frequency of these living arrangements as well as the implications for children and families.
5. Acknowledgments
References
Australian Bureau of Statistics. (2007). 2006 Census of Population and Housing, ABS Views on Census Output Strategy. Commonwealth of Australia.
Australian Institute of Family Studies. (2009). Longitudinal Study of Australian Children: An Australian government initiative data user guide. Melbourne, Australia: Australian Institute of Family Studies.
Beck, S.H. and Beck, R.W. (1984). The formation of extended households during middle-age. Journal of Marriage and the Family 46(2): 277−287. doi:10.2307/352459.
Beck, S.H. and Beck, R.W. (1989). The incidence of extended households among middle-aged black and white women – Estimates from a 15-year panel study.
Journal of Family Issues 10(2): 147−168. doi:10.1177/019251389010002001. Bengtson, V.L. (2001). Beyond the nuclear family: The increasing importance of
multigenerational bonds. Journal of Marriage and the Family 63(1): 1−16. doi:10.1111/j.1741-3737.2001.00001.x.
Bethel, J., Green, J.L., Nord, C., Kalton, G., and West, J. (2005). Early Childhood Longitudinal Study, Birth Cohort (ECLS-B) methodology report for the 9-Month data collection (2001-02): Vol. 2. Sampling. Washington D.C.: National Center for Education Statistics.
Brandon, P.D. (2004). Identifying the diversity in Australian children’s living arrangements: A research note Journal of Sociology 40(2): 179–192.
doi:10.1177/1440783304042872.
Brandon, P.D. (2012). The rise of three-generation households among households headed by two parents and mothers only in Australia. Journal of Family and Economic Issues 33(3):376−388. doi:10.1007/s10834-012-9284-5.
Choi, K.H., Tienda, M., Cobb-Clark, D., and Sinning, M. (2012). Immigration and status exchange in Australia and the United States. Research in Social Stratification and Mobility 30(1): 49−62. doi:10.1016/j.rssm.2011.08.002. de Vaus, D.A. (2005). Ex-nuptual children in Australia: An empirical analysis of
Demo, D.H. and Cox, M.J. (2000). Families with young children: A review of research in the 1990s. Journal of Marriage and Family 62(4): 876−895. doi:10.1111/j.1741-3737.2000.00876.x.
Dunifon, R. (2013). The influence of grandparents on the lives of children and adolescents. Child Development Perspectives 7(1): 55−60. doi:10.1111/cdep. 12016.
Fields, J. (2003). Children’s living arrangements and characteristics: March 2002.
Current Population Reports June 2003.
Glaser, K. and di Gessa, G. (2012). Grandparenting in Europe: Main study preliminary findings briefing. Lisbon: Calouste Gulbenkian Foundation.
Glaser, K., Ribé, E., Montserrat, U.W., Price, D., Stuchbury, R., and Tinker, A. (2010). Grandparenting in Europe. Lisbon: Calouste Gulbenkian Foundation.
Hansen, K. (2010). Millennium Cohort Study: First, second, third and fourth surveys. London, UK: Centre for Longitudinal Studies, Institute of Education, University of London.
Iacovou, M. and Skew, A. (2010). Household structure in the EU. Luxembourg: Institute for Social and Economic Research, University of Essex.
Kamo, Y. (2000). Racial and ethnic differences in extended family households.
Sociological Perspectives 43(2): 211−229. doi:10.2307/1389794.
Kreider, R. and Ellis, R. (2011). Living arrangements of children: 2009. Current Population Reports June 2011.
Liu, E. and Easthope, H. (2012). Multi-generation households in Australian cities. Melbourne: Housing and Urban Research Institute (AHURI Final Report No.181).
Martinson, M.L. (2012). Income inequality in health at all ages: A comparison of the United States and England. American Journal of Public Health 102(11): 2049−2056. doi:10.2105/AJPH.2012.300929.
Mutchler, J.E. and Baker, L.A. (2004). A demographic examination of grandparent caregivers in the Census 2000 Supplementary Survey. Population Research and Policy Review 23(4): 359–377. doi:10.1023/B:POPU.0000040018.85009.c1. Mutchler, J.E., & Baker, L.A. (2009). The implications of grandparent coresidence for
Pilkauskas, N.V. (2012). Three-generation family households: Differences by family structure at birth. Journal of Marriage and Family 74(5): 931−943. doi:10.1111/j.1741-3737.2012.01008.x.
Smeeding, T., Gao, Q., Saunders, P., and Wing, C. (2008). Elder poverty in an aging world: Conditions of social vulnerability and low income for women in rich and middle-income nations. Luxembourg Income Study (Working Paper 497). Stone, M.E. (2003). Social housing in the UK and US: Evolution, issues and prospects.
London, UK: Goldsmiths College.
Taylor, P., Passel, J.,Fry, R., Morin, R., Wang, W., Velasco, G., and Dockterman, D.(2010). The return of the multi-generational family household. Washington, DC: Pew Research Center.