BREEDING AND GENETICS
Testing Locations in Regional High Quality Tests for Cotton Seed Quality Traits
Linghe Zeng*, William C. Bridges Jr., and Fred M. Bourland
L. Zeng*, USDA-ARS, Crop Genetics Research Unit, Stoneville, MS 38776, USA; W.C. Bridges, Jr., Clemson University, Clemson, SC; and F.M. Bourland, Northeasat Research and Extension Center, University of Arkansas, Keiser, AR. *Corresponding author: linghe.zeng@ars.usda.gov
ABSTRACT
Significant genotype (G) × environment (E) ef -fects for cotton (Gossypium hirsutum L.) seed qual -ity traits have been identified in previous studies. Significant G × E interactions necessitate multiple-location tests to evaluate seed quality traits, which add cost to the tests. Reduction of testing locations could trim costs if the analysis of G × E interactions and the efficiency in breeding are not dramatically affected. The objectives of this study were: 1) to determine an appropriate reduction of testing loca -tions without significant loss in power for detect -ing G × E effects; 2) to determine an appropriate reduction of testing locations without significant loss in accuracy for estimating strain means; and 3) to identify a possible mega-environment for evaluation of seed traits using GGE biplot. His -torical data of Regional High Quality (RHQ) tests from 2005 through 2013 were used to address the objectives for three seed quality traits including oil content, N content, and free-gossypol. Significant G × location (L) interactions were detected in most cases. However, with averages of the three traits, less G × L interactions were detected with 7.3% and 9.1% non-significance, when two and three locations were omitted, respectively. Reduction of locations up to three, increased standard error to 25% of those with zero locations omitted. There was no clear mega-environment identified for seed traits. However, the locations of Lubbock, TX, Stoneville, MS, Florence, SC, and Portageville, MO were identified as being more representative than others for evaluation of the N content.
I
n general, genotype by environment interaction (G × E) can be defined as differential performance of genotypes across environments. There are two typesof G × E in breeding with ranking changes in cultivar performance across environments, i.e., crossover, or without ranking change across environments (De Leon et al., 2016). The impact of G × E in plant breeding can be negative because it complicates breeding designs and reduces genetic gain and heritability when tests are conducted across broad geographic regions (Kang, 1998). Possibilities also exist for breeders to take advantage of G × E to develop cultivars with specific adaptation to environments when ‘crossover’ interactions are significant. The successful application of this strategy relies on some repeatability of the ‘interaction patterns’ (Cooper, 1999). In other cases, when there was no significant crossover, breeders can select a superior genotype across diverse environments. If G × E effects are large, the testing environments can be divided into regions to reduce G × E effects and superior genotypes can be selected for the targeting regions.
Genotype x Environment effects on lint yield and fiber quality have been analyzed extensively as summa -rized below. United States (U.S.) breeders now spend more effort in developing cultivars with adaptability across environments. In earlier periods, i.e., 1970-1980, breeders focused more on selecting for locally superior genotypes (Meredith, 1984). In a few studies of G × E for lint yield, the ratio of the G × L variance component to the G variance component ranged from 0.12 to 3.3 (Abou-El-Fittouh et al., 1969; Miller et al., 1959; Murray and Verhalen, 1970). In contrast, a study
components of G and G × E for seed protein content contributed 10.8 and 7.7% to total variance, respec-tively. Zeng et al. (2015) observed highly significant G × L for seed oil content, protein content, and free gossypol content in six three-year testing cycles of the RHQ tests from 1996-2013. In another study over 11 location-year environments in North Carolina, South Carolina, Georgia, and Mississippi, G × E was highly significant for oil content, but not significant for protein content (Campbell et al., 2016).
Significance of G × E effects for cotton seed quality traits necessitates multiple location tests which results in increased cost. Reduction of testing locations may be a feasible solution to reduce costs if the statistical power to detect G × E will not be significantly reduced with fewer test locations. In this study, historical data of cotton seed quality traits in the RHQ tests were used to determine how reducing testing locations could possibly reduce the F-statistics for detecting significant G × E effects, and/or increase the strain standard errors. The data were also used to analyze testing locations to identify possible mega-environments for seed quality traits using GGE biplot.
MATERIALS AND METHODS
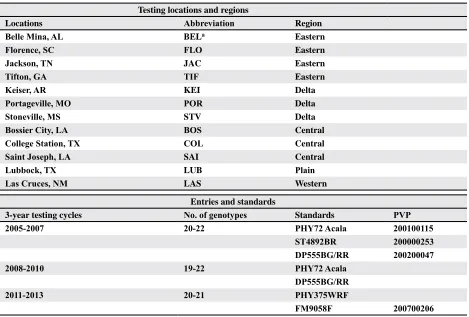
Historical data of RHQ tests conducted from 2005 through 2013 were used for this study. The RHQ tests are part of the United States Department of Agriculture-Agricultural Research Services (USDA-ARS) National Cotton Variety Test (NCVT) program, which evaluates cotton cultivars, elite strains, and exotic germplasm lines for yield and fiber quality across different locations in the U.S. Cot -ton Belt. The RHQ sites of tests between 2005 and 2013 involved 12 locations from five agric-climatic regions of the U.S. identified as Eastern, Delta, Cen -tral, High Plains, and Western (Table 1). These loca-tions differed substantially in geographic localoca-tions, temperature, and rainfall (Zeng et al., 2014). In the RHQ tests, the same sets of entries were evaluated at different locations each year, but different sets of strains were tested in different years. Two to three cultivars were planted at all locations as national standards in a three-year cycle. The tests between 2005-2013 were divided into three three-year cycles with 19 to 22 strains tested in each cycle (Table 1). Table 1. Testing locations, regions, and standards of the Regional High Quality tests from 2005 through 2013
Testing locations and regions
Locations Abbreviation Region
Belle Mina, AL BELa Eastern
Florence, SC FLO Eastern
Jackson, TN JAC Eastern
Tifton, GA TIF Eastern
Keiser, AR KEI Delta
Portageville, MO POR Delta
Stoneville, MS STV Delta
Bossier City, LA BOS Central
College Station, TX COL Central
Saint Joseph, LA SAI Central
Lubbock, TX LUB Plain
Las Cruces, NM LAS Western
Entries and standards
3-year testing cycles No. of genotypes Standards PVP
2005-2007 20-22 PHY72 Acala 200100115
ST4892BR 200000253 DP555BG/RR 200200047
2008-2010 19-22 PHY72 Acala
DP555BG/RR
2011-2013 20-21 PHY375WRF
FM9058F 200700206
a BEL, Belle Mina, AL; BOS, Bossier City, LA; COL, College Station, TX; FLO, Florence, SC; JAC, Jackson, TN;
Experimental design at all locations was a ran-domized complete block with four to six replicates for evaluation of lint yield and two replicates for fiber quality and seed quality traits (Meredith et al., 2012). Boll samples were obtained from 50 to 150 hand-picked bolls per plot from each replicate. Plants were grown in about 12 m × 1 m, two-rows plots. Boll samples from individual plots at each location were ginned separately using laboratory saw gins. Seed were sent to Eurofins Scientific4
(Memphis, TN) for measurements of seed quality traits. Oil content was measured from fuzzy seed by the American Oil Chemists’ Society (AOCS) recommended practice Aa 4-38 (AOCS, 2001). Nitrogen was measured from fuzzy seed by the AOCS Method Ba 4-38 (AOCS, 1976). Gossypol was measured from dehulled seed which were dried in a forced-draft oven at 82oC for 4 h. The
method was the AOCS recommended practice Ba 8a-99 (AOCS, 1998). The isomers of the (+) and (-) gossypol were determined by high performance liquid chromatography (HPLC).
The statistical analysis was conducted in two steps. The first step was to determine the appropriate reduction in the number of locations from the RHQ tests. A statistical model was developed within each year such that genotype × location F-tests could be conducted, and genotype standard errors could be estimated. The form of the model was
Yijk = μ + Li + R(L)ij + Gk + GLik + GR(L)ilk
where Yijk is the dependent variable for seed
quality traits; μ is the overall mean; Li is the
term of location i; R(L)ij is the replication j
within location i as random effect; Gk is the
term of genotype k; GLik is the interaction term
of genotype k and location i; GR(L)ijk is the interaction term of genotype k and replication j within location i as random effect. Then for each of the nine years (2005-2013), a series of datasets were created by the elimination of one location at a time, i.e., each of the nine testing locations in that year. For the three seed traits, there were a total of 243 datasets for one location elimination (Supplemental Table 1). Similarly, a series of datasets were created by elimination of two or three locations, i.e., each of two or three location combinations among all locations in that year. For the three seed traits, there were a total of 972 and 2268 datasets for the elimination of two and three locations, respectively (Supplemental Table 1).
For each of these datasets, the G ×L F-tests were conducted, and the genotype standard errors were estimated again, using the same linear model as above; the only difference being a reduced number of locations. Then the F-tests with p-values and standard errors could be compared as a measure of the impact of the location reduction. To decide which locations to eliminate from the RHQ tests for seed quality traits, G × E effects in multiple location-year tests from 2005 through 2013 were analyzed using GGE biplot software4 (Yan, 2001).
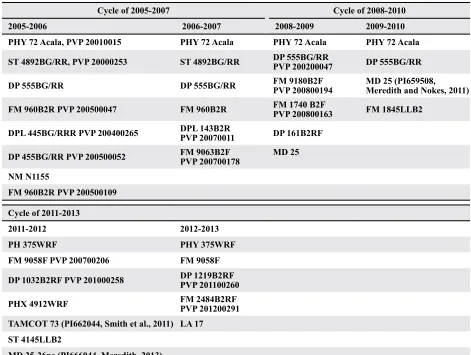
The experimental years between 2005-2013 were artificially separated into six two-year periods, 2005-2006 and 2006-2007 for the testing cycle of 2005-2007, 2008-2009 and 2009-2010 for the testing cycle of 2008-2010, and 2011-2012, and 2012-2013 for the testing cycle of 2011-2013. Common genotypes in each of these periods were identified and described in Table 2. In GGE biplot analysis, G and G × E were partitioned into the first principle component (PC1) and the second principle component (PC2) of singular values and eigenvectors. A polygon was drawn to contain all genotypes within it. A set of lines perpendicular to each side of the polygon divided the biplot into sectors with environments falling into these sectors. A ‘winning’ genotype could be viewed at each corner of the polygon which represented the genotype with best performance among the environments falling into that sector. In this way, a group of environments could be viewed in a sector with a ‘winning’ genotype at the corner of that sector. In GGE biplot, the genotypes ranking high for seed traits were distributed to the right side of the y-axis and the genotypes ranking high for stability were distributed near the x-axis.
The most representative testing locations were identified by the highest repeatability in grouping with other locations in two-year periods of the RHQ tests. The repeatability was calculated in the equation:
Repeatability = [(number of a location in the first year in grouping with other environments /total number of environments) + (number of a location in the second year in grouping with other locations /total number of environments)] / 2.
When P-values of genotype × location interac-tions of free gossypol content were plotted against number of locations omitted in each year during 2005 through 2013, reduction of two to three loca-tions dramatically affected the detection of G × L interactions only in 2005 and 2010 whereas the
RESULTS AND DISCUSSION
The effects of G ×L for seed quality traits were analyzed within each year during 2005 through 2013 (Table 3). Highly significant G × L interactions were identified in all cases except for N content in 2009. These results confirmed that multiple-location tests are required for evaluation of cotton seed quality traits in order to detect G × E interactions.
The appropriate reduction of testing locations in the RHQ tests was determined by the F-test and P-values of the G × L interactions with different numbers of locations omitted (Supplemental Table 1). Signifi -cant G × L interactions were detected in most cases. However, when two or three locations were omitted with averages of the oil content, N content, and free-gossypol, fewer G × L interactions were detected with 7.3% and 9.1% non-significant incidences for two and
three location omissions, respectively.
Table 2. Genotypes common in the consecutive years of the 2-year periods of RHQ tests from 2005 through 2013
Cycle of 2005-2007 Cycle of 2008-2010
2005-2006 2006-2007 2008-2009 2009-2010
PHY 72 Acala, PVP 20010015 PHY 72 Acala PHY 72 Acala PHY 72 Acala ST 4892BG/RR, PVP 20000253 ST 4892BG/RR DP 555BG/RRPVP 200200047 DP 555BG/RR
DP 555BG/RR DP 555BG/RR FM 9180B2FPVP 200800194 MD 25 (PI659508, Meredith and Nokes, 2011)
FM 960B2R PVP 200500047 FM 960B2R FM 1740 B2FPVP 200800163 FM 1845LLB2
DPL 445BG/RRR PVP 200400265 DPL 143B2RPVP 20070011 DP 161B2RF
DP 455BG/RR PVP 200500052 FM 9063B2FPVP 200700178 MD 25 NM N1155
FM 960B2R PVP 200500109 Cycle of 2011-2013
2011-2012 2012-2013
PH 375WRF PHY 375WRF
FM 9058F PVP 200700206 FM 9058F DP 1032B2RF PVP 201000258 DP 1219B2RFPVP 201100260
PHX 4912WRF FM 2484B2RFPVP 201200291 TAMCOT 73 (PI662044, Smith et al., 2011) LA 17
ST 4145LLB2
MD 25-26ne (PI666044, Meredith, 2013)
Table 3. Significance (<P-values) of genotype × location
interactions for seed quality traits from 2005 through 2013 Year Oil content N content Free-gossypol
2005 0.001 0.001 0.001
2006 0.001 0.001 0.001
2007 0.001 0.001 0.001
2008 0.001 0.001 0.001
2009 0.001 0.232 0.001
2010 0.001 0.001 0.011
2011 0.001 0.001 0.001
2012 0.001 0.005 0.001
Figure 1. P values of genotype × location vs. number of locations omitted in RHQ tests of free gossypol (2005-2013). increase of non-significant incidences of G × L
interactions with reductions of locations was mini-mum in other years (Fig 1). For nitrogen content, the reduction of two to three locations affected de -tection of G × L interactions only in 2007 and 2012 while the influence was minimal in other years (Fig.
Figure 3. P values of genotype × location vs. number of locations omitted in RHQ tests for oil content (2005-2013). Significant G × E interactions affect efficiency
in selection and reduce repeatability in breeding. Therefore, the estimation of standard errors of the genotypic means is another critical factor when G × E interactions are significant. In order to maintain the efficiency in breeding, reduction of testing locations is only feasible when there is no dramatic increase in standard errors of genotypic means. When the stan-dard errors of genotypic means for the three seed traits was plotted against the number of locations omitted
and other factors such as sample size, techniques of measurements, and replicate number, etc., can also influence standard errors. These findings contrast with those reported by Bourland et al. (2016) for fiber quality and yield component traits using the same approach. They evaluated data from nine years and four Arkansas locations of six strain tests to determine if accurate data could be obtained from boll samples taken from fewer than all locations. F-tests indicated that over 90% of the incidence of G × L interactions for yield were significant. Their results suggested that boll samples should be taken from all four locations of the tests in that study.
Figure 5. Standard error of genotype means vs. number of locations omitted in RHQ tests for nitrogen content.
Figure 4. Standard error of genotype mean vs. number of locations omitted in RHQ tests for free-gossypol content.
Figure 6. Standard error of genotype means vs. number of locations omitted in RHQ tests for oil content.
Table 4. Grouping of locations for N content based on GGE biplot analysis of RHQ tests of 2005-2013
Years Grouping Locationsa Best performer
2005-2006 1 BEL-05, BEL-06, COL-06, FLO-05, FLO-06, KEI-05, KEI-06, LAS-06, LUB-05, LUB-06, POR-05, POR-06, STV06 DP 455BG/RR
2 COL-05, LAS-05 DP 555BG/RR
2006-2007 1 BOS-07, LAS-06, LUB-06, POR-06 ST 4892RR
2 BEL-06, BEL-07, COL-06, COL-07, LAS-07, LUB-07, POR07, STV-06 DP 555BG/RR
2008-2009 1 BEL-08, FLO-08, FLO-09, KEI-09, LAS-08, POR-08 PHY 72 Acala
2 BOS-09, COL-08, COL-09, JAC-08, JAC-09, LUB-08, LUB-09, POR-09, STV-08, STV09 DP 555BG/RR
3 BEL-09, BOS-08, KEI-08, LAS-09 FM 1740B2F
2009-2010 1 COL-09, FLO-10, KEI-09, KEI-10, LAS-09, STV-09 MD 25
2 BEL-09, BOS-09, COL-10, FLO-09, POR-09 PHY 72 Acala
3 BEL-10 DP 555BG/RR
4 JAC-09 FM 1845LLB2
2011-2012 1 BEL-11, COL-12, KEI-12 MD 25-26ne
2 BEL-12, COL-11, FLO-11, FLO-12, LAS-11, LUB-11, LUB-12, POR-11, POR-12, STV-12 DP 1032B2RF
3 KEI-11, LAS-12 PHY 375WRF
2012-2013 1 COL-12, FLO-13, LAS-12, LAS-13, STV-12 DP 1219B2RF
2 BEL-12, COL-13, FLO-12, LUB-12, LUB-13, POR-12, SAI-12, SAI-13, STV-13 PHY 375WRF
3 KEI-12, KEI-13, POR-13 FM 2484B2F
a BEL, Belle Mina, AL; BOS, Bossier City, LA; COL, College Station, TX; FLO, Florence, SC; JAC, Jackson, TN; KEI,
In order to decide which testing locations to eliminate in future RHQ tests, it would be ideal if mega-environments for seed quality traits could be identified. Seed N content in the RHQ tests from 2005 through 2013 were used to analyze relation-ships among testing locations using GGE biplot. To analyze G × E interactions in multiple location-year tests, common genotypes in consecutive years were selected in the three three-year testing cycles (Table 2). Each of the three cycles was further divided into two two-year periods and the relationships among testing locations were analyzed in a total of six two-year periods in 2005-2013 (Table 4).
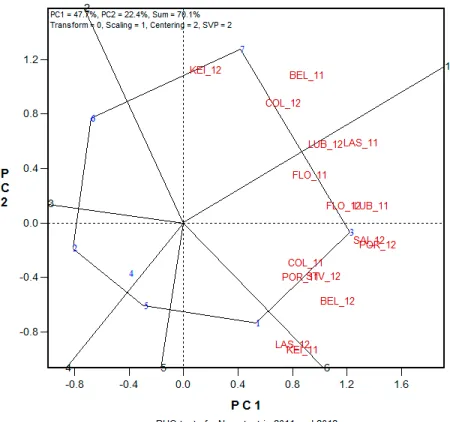
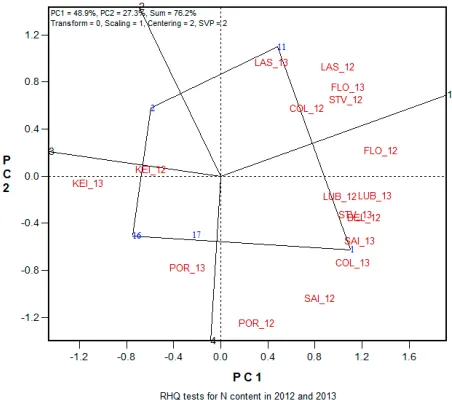
In the analysis of relationships among testing locations in 2011-2012 and 2012-2013, there were five and four sectors in polygon views, respectively, with three groups of locations in each of the two two-year periods (Fig. 7, 8). In 2011 and 2012, there were three groups of locations as Belle Mina-2011, College Station-2012, and Keiser-2012 with MD 25-26ne as the best performer; Keiser-2011 and Las Cruces-2012 with PHY 375WRF as the best performer; and Belle Mina-2012, College Station-2011, Florence-2011, Florence-2012, Las Cruces-2011, Lubbock-2011, Lubbock-2012, Portageville-2011, Portageville-2012, Saint Joseph-2012, and Stoneville-2012 with DP 1032B2RF as the best performer (Fig. 7). In 2012 and 2013, there were three groups of locations as College Station-2012, Florence-2013, Las Cruces-2012, Las Cruces-2013, and Stoneville-2012 with DP 1219B2RF as the best performer; Keiser-2012, Keiser-2013, Portageville-2013 with FM 2484B2F as the best per-former; and Belle Mina-2012, College Station-2013,
Table 5. Frequency of testing locations in grouping with other locations in GGE biplot in the tests for N content of 2005-2013
3-year cycles Years Testing locations
BELa BOS COL FLO JAC KEI LAS LUB POR SAI STV
2005-2007 2005-2006 0.800 ---b 0.433 0.800 --- 0.800 0.433 0.800 0.800 --- 0.800
2006-2007 0.583 0.250 0.583 --- --- --- 0.417 0.417 0.417 --- 0.583
2008-2010 2008-2009 0.200 0.300 0.450 0.250 0.450 0.200 0.200 0.450 0.350 --- 0.450
2009-2010 0.154 0.308 0.346 0.345 --- 0.385 0.385 --- 0.308 --- 0.385
2011-2013 2011-2012 0.367 --- 0.367 0.600 --- 0.100 0.333 0.600 0.600 --- 0.600
2012-2013 0.471 --- 0.353 0.353 --- 0.118 0.235 0.471 0.294 0.471 0.353
averages 0.43 0.29 0.42 0.47 0.45 0.32 0.33 0.55 0.46 0.47 0.53
a BEL, Belle Mina, AL; BOS, Bossier City, LA; COL, College Station, TX; FLO, Florence, SC; JAC, Jackson, TN; KEI,
Keiser, AR; LAS, Las Cruces, NM; LUB, Lubbock, TX; POR, Portageville, MO; Saint Joseph, LA; STV, Stoneville, MS.
b Data are not available.
Figure 7. Relationships among testing locations in Regional High Quality tests of 2011 and 2012 for cotton seed N con
-tent. The Arabic numbers in blue color represent strains: 1, PHY 375WRF; 2, FM 9058F; 3, DP 1032B2RF; 4, PHX 4912WRF; 5, Tamcot 73; 6, ST 4145LLB2; 7, MD 25-26ne. Uppercase letters in red color represent testing locations as shown in Table 1. The letters with Arabic number 11 are environments of 2011 and those with number of 12 are environments of 2012. PC1 and PC2 are first and second principal component, respectively. Model parameters: Transform=0, no transformation; Scaling=1, the data were scaled by the standard deviation of genotype means within environments (Yan and Holland, 2010); centering=2, tester centered (G + G×E); SVP=2, tester metric (f=0).
Figure 8. Relationships among testing locations in Regional High Quality tests of 2012 and 2013 for cotton seed N con
-tent. The Arabic numbers in blue color represent strains: 1, PHY 375WRF; 2, FM 9058F; 11, DP 1219B2RF; 16, FM 2484B2F; 17, LA 17. Uppercase letters in red color repre
-sent testing locations as shown in Table 1. The letters with Arabic number 12 are environments of 2012 and those with number of 13 are environments of 2013. PC1 and PC2 are first and second principal component, respectively. Model parameters: Transform=0, no transformation; Scaling=1, the data were scaled by the standard deviation of genotype means within environments (Yan and Holland, 2010); centering=2, tester centered (G + G×E); SVP=2, tester metric (f=0).
Although the purpose of a mega-environment analysis is to identify environments with repeat-ability, a lack of repeatability for the grouping of locations between the two consecutive years in those two-year trials was observed (Table 4). These results did not support the existence of possible mega-environments for seed traits. The failure to identify a mega-environment is understandable be-cause the environmental factors between years such as weather conditions, insect and disease pressure, and other abiotic stresses at different locations would be unpredictable. A similar result was reported in a previous study of G × E interactions on lint yield among testing locations in RHQ tests in 200-2009 when mega-environments were not observed (Zeng et al., 2014). Nevertheless, some testing locations are more representative than others with higher fre-quency in grouping with locations (Table 5). When averaged over the three testing cycles, Lubbock, TX, Stoneville, MS, Florence, SC, and Portageville, MO locations had the highest repeatability of 0.55, 0.53, 0.47, and 0.46, respectively, which compared
to the others ranged from 0.29 to 0.43. Jackson, TN and Saint Joseph, LA were excluded because of low participation in 2005-2013. The locations of Las Cruces, NM, Keiser, AR, and Bossier City, LA were most unique with the lowest repeatability, 0.33, 0.23, and 0.29, respectively. In GGE biplot analysis of oil content and free-gossypol content, the groupings were less obvious than those of N content when the environmental factor of ‘year’ was included in the GGE analysis, and thus, not feasible for analysis of mega-environments (data not shown).
In conclusion, reduction of two to three testing locations from the RHQ tests from 2005 through 2013 did not affect detection of G × L interactions for seed traits. It was determined also that the testing locations could be reduced by three from the RHQ tests without dramatic sacrifice to accuracy for breed -ers. The testing locations of Lubbock, Stoneville, Florence, and Portageville were most representative in the RHQ tests for N content and these locations should remain in future multiple-location RHQ tests for seed traits.
ACKNOWLEDGMENTS
This research was funded by USDA-ARS, Proj-ect No. 6066-21000-051-00D. USDA is an equal
opportunity provider and employer
. DISCLAIMERMention of trade names or commercial products in this article is solely for the purpose of providing specific information and does not imply recommen -dation by the US Department of Agriculture.
REFERENCES
Abou-El-Fittouh, H.A., J.O. Rawlings, and P.A. Miller. 1969. Genotype by environment interactions in cotton – their nature and related environmental variables. Crop Sci. 9:377- 381.
AOCS, 1976. Official and tentative methods, method Ba 4-38.
American Oil Chemists Society, 3rd edn. AOCS Press,
Champaign, IL.
AOCS, 1998. Official method Ba 8a-99. p. 3. In D. Firestone
(ed) Official methods and recommended practices of the
AOCS, 2001. AOCS official method Aa 4-38. Revised 2001:
oil. In Official methods and recommended practices of
the AOCS, 5th edn. AOCS Press, Champaign, IL.
Bourland, F., D. Jones, and W. Bridges. 2016. Perspectives on boll sampling. p. 819-826. In Proc. Beltwide Cotton
Prod. Res. Conf., New Orleans, LA. 5-7 Jan. Nat’l, Cot -ton Counc. Am., Memphis, TN.
Campbell, B.T., K.D. Chapman, D. Sturtevant, C. Kennedy, P. Horn, P.W. Chee, E. Lubbers, W.R. Meredith, Jr., J. John-son, D. Fraser, and D.C. Jones. 2016. Genetic analysis of cottonseed protein and oil in a diverse cotton germplasm. Crop Sci. 56:2457-2464.
Cooper, M. 1999. Concepts and strategies for plant adapta-tion research in rainfed lowland rice. Field Crops Res. 64:13-34.De Leon, N., J.L. Jannink, J.W. Edwards, and S.M. Kaeppler. 2016. Introduction to a specialissue on genotype by environment interaction. Crop Sci. 56:2081-2089.
Kang, M.S. 1998 Using genotype-environment interaction for crop cultivar development. Adv. in Agron. 62:199-245. Meredith, W.R. Jr. 1984. Quantitative genetics. p. 131-150.
In R.J. Kohel and C.F. Lewis (ed.) Cotton. ASA, CSSA, and SSSA, Madison, WI.
Meredith, W.R. Jr. 2013. Registration of 26ne, MD25-27, and MD25-87 germplasm lines of cotton with
superior yield, fiber quality, and pest resistance. J. Plant
Regist. 7:327-333.
Meredith, W.R. Jr., and W.S. Nokes. 2011. Registration of
MD 9ne and MD 25 high fiber quality germplasm lines
of cotton. J. Plant Regist. 5:202-206.
Meredith, W.R., Jr., D.L. Boykin, F.M. Bourland, W.D. Caldwell, B.T. Campbell, J.R. Gannaway, K. Glass, A.P. Jones, L.M. May, C.W. Smith, and J. Zhang. 2012. Genotype × environment interactions over seven years
for yield, yield components, fiber quality, and gossypol
traits in the Regional High Quality tests. J. Cotton Sci. 16:160-169.
Miller, P.A., J.C. Williams, and H.F. Robinson. 1959. Variety × environment interactions in cotton variety tests and
their implications in testing methods. Agron. J. 51:132-134.
Murray, J.C., and L.M. Verhalen. 1970. Genotype by environ-ment interaction study of cotton in Oklahoma. Crop Sci. 10:197-199.
Smith, C.W., S. Hague, and D. Jones. 2011. Registration of
‘Tamcot 73’ upland cotton cultivar. J. Plant Regist.
5:273-278.
Yan, W. 2001. GGE biplot – A Windows application for graphical analysis of multienvironment trial data and other types of two-way data. Agron. J. 93:1111-1118.
Yan, W., and J.B. Holland. 2010. A heritability-adjusted GGE biplot for test environment evaluation. Euphytica. 171:355-369.
Zeng, L., W.R. Meredith, Jr., B.T. Campbell, J.K. Dever, J. Zhang, K.M. Glass, A.S. Jones, G.O. Myers, and F.M.
Bourland. 2014. Genotype-by-environment effects on
lint yield of cotton cultivars across major regions in the U.S. Cotton Belt. J. Cotton Sci. 18:75-84.
Zeng, L., B.T. Campbell, E. Bechere, J.K. Dever, J. Zhang, A.S. Jones, T.B. Raper, S. Hague, W. Smith, G.O. Myers, and F.M. Bourland. 2015. Genotype and environmental
effects on cottonseed oil, nitrogen, and gossypol contents in 18 years of regional high quality tests. Euphytica.