Pipistrel Taurus G4: on Creation and Evolution of the
Winning Aeroplane of NASA Green Flight Challenge 2011
Tomažič, T. – Plevnik, V. – Veble, G. – Tomažič, J. – Popit, F. – Kolar, S. – Kikelj, R. – Langelaan, J.W. – Miles, K.
Tine Tomažič1,* – Vid Plevnik1 – Gregor Veble1 – Jure Tomažič1 – Franc Popit2 – Sašo Kolar3 –
Radivoj Kikelj4 – Jacob W. Langelaan5 – Kirk Miles5 1 Pipistrel d.o.o. Ajdovščina, Advanced Light Aircraft, Slovenia 2 Aeroidea s.p., Slovenia; 3 Aerotech s.p., Slovenia; 4 Lupina s.p., Slovenia 5 The Pennsylvania State University, Aerospace Engineering Department, United States
The paper presents the journey of the Pipistrel’s Taurus G4, the World’s first four-seat electric aeroplane and winner of the NASA Green Flight Challenge 2011, sponsored by Google, from idea to completion of competition. At the beginning, the race event and qualification requirements are presented. The selection of the aeroplane’s configuration and sizing is discussed, and emphasis given to the unique twin-fuselage configuration. Next, the architecture of the electrical systems on board the aeroplane, including the large battery pack and propulsion elements is presented. In the second part of the paper, authors give an insight to the 40-hour flight test, the challenges encountered and the preparation to the race event itself. A non-linear mathematical performance model was developed to predict performance of the Taurus G4 during the two race events and used for flight planning and in-flight online performance optimisation. Instead of the conclusion, the results of the NASA Green Flight Challenge 2011 are presented and discussed, together with a comparison to other participating teams’ results.
© 2011 Journal of Mechanical Engineering. All rights reserved.
Keywords: electric aeroplane, structural efficiency, NASA Green Flight Challenge 2011, large battery pack, performance modelling, flight test
0 INTRODUCTION
NASA organises Centennial Challenges [1] as part of their commitment to on-going innovation and spreading-out engineering efforts
to small businesses to tackle large problems. The Green Flight Challenge 2011 [2], sponsored by Google (GFC 2011) was the first challenge
organised after the Personal Air Vehicle 2007 [3]
challenge, where Pipistrel won with the Prototype of Virus SW 80 aeroplane and General Aviation Technology 2008 [4] challenge, where Pipistrel also won with the Prototype of Virus SW 100
aeroplane.
The goal of the GFC 2011 was simple to understand, however the formulation of the rules
of engagement [5] and the pre-requirements to even qualify for the race event itself made it
difficult to process for some and impossible to meet for others. The winner was to complete two main event sorties i.e. the Economy Flight and the Speed Flight, each 200 miles (321.8 km) long, in less than 2 hours and with an enegy efficiency of
the equivalent of 200 passenger-Miles-Per-Gallon
(pMPG), which is eqivalent to approx 170 km
per litre of fuel per passenger. Implicite to this formulation is that the contenders had to fly the course at an average speed of at least 160.9 km/h,
which included the take-off.
There were, however, many requirements, which the competing aeroplanes and teams had to meet. Most important were the stall speed of 52 mph (83.5 km/h) or below, good stability and manoeuvrability, based on the Cooper-Harper scale, maximum noise level on take-off of 78 dB(A), FAR 25 [6] cockpit visibility, cabin comfort and the ability of carrying 200 pounds (91 kg) per declared seat, which also needed to be evacuatable in one minute without outside assistance. The number of the seats was not limited, however the Maximum Take-off Mass of the airplane was not to exceed 5,700 pounds
(2,591 kg). The rules also did not impose a certain
means of propulsion, but as the overall energy
the powertrain mattered almost as much as the efficiency of the powertrain. This important fact was the turning point for the conception of the
Pipistrel’s all-electric competition aeroplane, the later named the Taurus G4.
1 CONCEPTION PHASE
At this point, it needs to be stressed that
the conception, development and construction of
the Taurus G4 took only 5 months (20 December,
2010, through 18 May, 2011), so the design
team needed to think in a most creative way and envision an efficient design, which would become an all-electric aeroplane, thus maximising the pMPG score by incorporating the most efficient means of propulsion. First calculations showed that an 85+% powertrain efficiency could be achieved with an all electric (battery, power controller, electric motor) type of powertrain, whereas hydrogen-fuel cells, hybrid or internal-combustion-engine-based powertrains could come no-where close to such figures.
The other part of the pMPG score is
the number of passengers carried. The relation between the pMPG score and the number of
passengers carried is directly linear; therefore
the concept of Pipistrel’s GFC 2011 racer was to have as many seats as possible, but economically feasible. This built was not sponsored by any
entity outside the Pipistrel d.o.o. Ajdovscina company itself. Given the tight time frame, the
team decided to use certain parts, which were available at the workshop from the existing
production airframes.
Efforts were immediately given on Taurus Electro G2 airframe, Pipistrel’s two-seat electric powered self-launching glider, which is powered by a 40 kW electric motor. While the motor’s power would be sufficient to produce the required 100 mph cruise with two pilots on board, it would have been necessary to extend the wingspan by at least 2.5 meters, and the fuselage by at least 0.7 meters to achieve adequate stability and enough physical space for all the batteries on board. Parasite and trim drag associated by having the propeller mounted on top of the retractable
mast present a performance penalty versus more
conventional solutions. This idea was scrapped also because it was believed that most of the 14
teams, which had enrolled for the GFC 2011, would be flying two-seat aeroplanes, and the modified Taurus Electro G2 would have no advantage in the number of passengers carried.
A similar concept with three people aboard a single Taurus fuselage, with greatly extended wingspan (extra 4.5 meters) and fuselage (extra 1.3 meters) was evaluated, but quickly dismissed because of structural inefficiency and construction complexity. The main issue with this design was the necessity of a completely new and different retractable undercarriage system and powertrain
installation.
While the advantage of having three passengers aboard the airframe was not great over having only two, it was noted in the process that by carrying four passengers the score becomes notably i.e. in the order of 10% higher than that achievable by two-seat designs. This is, of course, accounting for extra airframe drag of a four-seat
design.
1.1 Airframe Configuration and Sizing
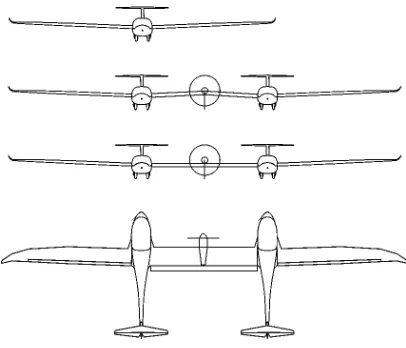
How does one make a four-seat aeroplane, possibly utilising parts from existing airframes, which are available in-house? Take two airframes and make a new, larger one – this is how the twin-fuselage idea was born.
Fig. 1. First configuration and sketches for the Taurus G4
an all electric aeroplane, where the mass of the batteries accounts for a large portion of the total airframe weight. Such design could carry
four passengers and have enough room for all
the Lithium Ion-Polymer batteries, then judged
at a little less than 500 kg themselves. The
undercarriage would not need to be redesigned, and the modification of the pushrod-based control system seemed straightforward. There were
challenges in propeller clearance / propulsion
nacelle positioning as well as sizing of the central wing. These were also the major components of the to-be Taurus G4, which needed to be designed and built from scratch.
The question persisted in how slender the middle wing could be, to maintain structural
(especially torsional) rigidity. Several concepts
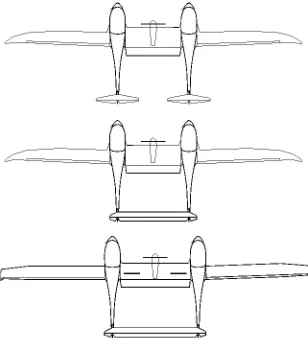
were evaluated, including such with conjoined tails and different wing platforms. Drag induction devices (one large flap, one smaller flap with airbrakes, just airbrakes) were also discussed, given the fact that the Taurus G4 was showing to become a near 1,500 kg aeroplane with a Lift/ Drag (L/D) ratio of around 30:1. Good handling and landing characteristics needed to be achieved by all means.
Fig. 2. Further concept focusing on central-wing sizing, horizontal tail solution and drag induction
devices
Before the final design concept was determined, all of the above were modelled and subject to CFD and structural FEM analyses.
The favourite design closely resembled the top sketch on Fig. 2, presenting the best combination of structural and aerodynamic
characteristics. Two separate horizontal tails were used instead of the single conjoined tail for aero elastic reasons. At this point, design was
simultaneously ran in three separate directions, aerodynamic design and optimisation, structural calculations and design/development of the electrical/propulsion system.
1.2 Aerodynamic Design
Immediate attention was given to designing a flapped airfoil for the central wing, which had to be built the soonest. A 15% thick airfoil was designed to provide high lift, but to maintain optimal lift distribution in sync with outboard wings, which were stock-geometry Taurus Electro G2 wings, where the airfoil could not be modified. A slotted flap (35 degrees) was selected for weight/lift benefit/drag induction reasons. The result was a system capable of reaching CLmax of
2.8 and enabling the required stall speed of the aeroplane at <83.5 km/h with its five-meter span at a calculated Maximum Take-off Weight of 1,500 kg. Special wing-body-joint fairings were
also designed to reduce interference drag from the
central wing towards the two fuselages.
Fig. 3. CFD optimisation of central nacelle
The next challenge was the design of the
envisioned a much smaller nacelle, it was seen through CFD analyses that a larger and longer nacelle would actually be beneficiary due to
parasite and interference drag reasons. This gave the opportunity to utilise the nacelle not only to house the key elements of the propulsion system
(electric motor, power controller, cooling system) but also the ballistic parachute rescue system, part of the battery system and the flap actuator mechanism. Laminar flow over the nacelle was ensured with CFD-based shaping and surface optimisation, as seen in Fig. 3.
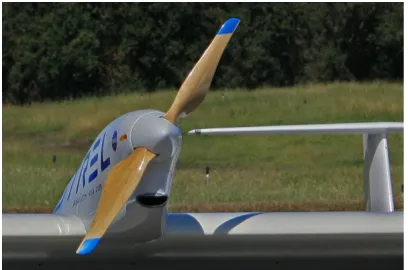
Fig. 4. Propeller of Taurus G4
Fig. 5. Propeller thrust vs. airspeed and RPM
The unique propeller was hand crafted from ash wood and reinforced with a thin composite layer. Despite being fixed-pitch, the propeller behaves much like constant-speed
propellers on piston engines, thanks to electric
motor’s characteristics (Fig. 5).
The propeller of the Taurus G4 is a very
special component and was tailored for electric
engine characteristics as well as competition
requirements. Electric propulsion can deliver
power at flexible RPM, which allows the use of a fixed pitch design. The propeller’s unique shape is a result of optimization using in-house developed computer tools towards three GFC 2011 goals; the thick, inboard section of the blade is responsible for providing thrust during take off, whereas the thinner, outboard part of the blade is designed for climb and especially cruise efficiency.
It must also be noted that the ratio between take-off power and cruise power of the aeroplane
is in the order of 5:1!
1.3 Structural Design
When it was decided that there is enough
physical space inside the central nacelle to also
house part of the battery system, the advantages of the twin-fuselage concept became apparent from the structural point of view. The mass of the batteries/propulsion system/passengers could be more evenly spaced along the span than with the conventional single-fuselage configuration (Fig.
6).
Fig. 6. Span-wise weight distribution, bending moment for Taurus G4
Due to relatively large masses spaced
outboard from the centre of gravity, the weight of the structural parts was lighter. In combination with the tailor-developed central wing/airfoil, the following lift distribution was achieved (Fig. 7); enabling the Taurus G4 to use unchanged stock outboard wing panels taken from Taurus Electro G2 two-seat self-launching glider.
The complete structural design, analyses
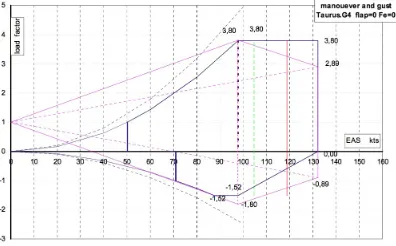
specifications, rendering the Taurus G4 a proper +3.8 G, 1.52 G aeroplane. The G-load envelope
(Vn diagram) is shown in Fig. 8.
Fig. 7. Span-wise lift distribution, Taurus G4
Fig. 8. Vn diagram, Taurus G4
1.4 Electrical Systems
All electrical systems for the Taurus G4
were developed in-house, apart from the battery cells themselves, which are a batch of specially commissioned high-energy-density Lithium-Polymer cells. There are three battery groups connected in parallel, each group contains 88 LiPo cells, which are connected in series. The array of 264 cells weighs in at 520 kg and has a total energy capacity exceeding 90 kWh at a nominal voltage of 325 volts. To best of authors’ knowledge it is the largest battery array ever used on an aeroplane. The three battery groups are located one in each
fuselage and one in the central nacelle.
Individual groups can be switched on/
off during the flight via the 400 A fuses & 500
A vacuum relays and are monitored by the
proprietary Battery Management System (BMS).
Fig. 9. Locations of battery groups
Within groups, the cells are organised in eight packs where each is equipped with a BMS ‘slave’ electronic board, capable of measuring individual cell voltages, voltage balancing and
measuring temperature. A total of 33 eight packs are mounted in the fuselages and in the
central wing inside glass fibre cages, which are
electrically nonconductive. In case the BMS
would detect a cell failure during flight, the relay would disconnect the corresponding battery group and the airplane would continue its flight with the rest of the two chains.
Fig.10. Battery group in one of the fuselages
Each of the battery groups is controlled by a ‘master’ unit, which handles all operations regarding the given battery group. In addition to controlling the on/off chain power relay, the
‘master’ collects cell voltages and temperature
data from the BMS slaves to balance the cell
voltages.
power. All elements from the Electrical Systems, including the 12 kW charger, are controlled via
a centralised avionics suite located in the centre
cockpit console and communicate with one-another via a hybrid wire/optical fibre CANbus network.
There is a separate avionics/systems
batteries, which takes care of instruments and
central flap/landing gear actuation. An additional
17 watt solar cell is located on the starboard fuselage as a back up to power instruments in
event of total electrical system failure.
1.5 Rapid Prototyping
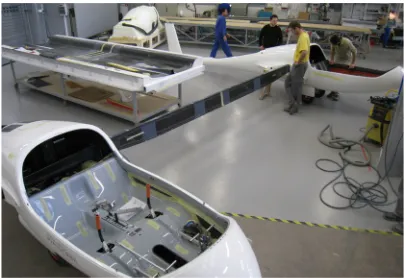
The Taurus G4 is essentially a prototype,
with many components built with advanced robot prototyping techniques. All designs were
transferred from 3D CAD/CAM models into
physical form using Pipistrel’s 8-axis robot-mill (Fig. 11).
Fig. 11. Robot milling a Taurus G4 component
Prototype moulds made of either styro
foam or Polyurethane block materials were used to fabricate individual composite parts (Fig. 12).
Such a process allowed for the whole composite structure to be completed within 14 weeks from beginning of the project. The remaining 6 weeks were spent integrating
electrical systems, controls, avionics, etc.
The completed Taurus G4 airframe was
geometrically identical to the computer-designed shape and 4 kg lighter than calculated.
On May 18th, 2011, roughly five months
after the beginning of the project, the aircraft
was dispatched to the USA in a flight-ready condition. The rules of GFC 2011 called for 40 flight hours be accumulated in the USA prior to
the competition itself.
Fig. 12. Central-wing root ribs being fabricated
Fig. 13. Central-wing-spar fitted to wing-box assembly for the first time
2 TEST PHASE
The test phase of the Taurus G4 took place at three different locations in the USA. Having already completed all structural tests at Pipistrel’s headquarters in Slovenia, the test phases could
be named: integration and environmental testing,
initial test flights and performance oriented test flights.
2.1 Integration and Environmental Testing
The Taurus G4 arrived to Mifflin County Airport, PA, USA in the first days of June 2011.
There, the team assembled the airframe and began
Fig. 14. After arrival to Mifflin Co, PA, USA
Pennsylvania is known for its hot and humid weather in early summer, hence the focus of the integration and environmental testing was on cooling, operation and reliability of the electrical systems, including motor, power controller,
disconnect relays and the BMS. NASA-provided
eTotalizer measurement board was also integrated
and its operation verified for safety at that point.
The space inside the nacelle is crowded, so adequate cooling is critical. The motor and power controllers are water cooled by a 50/50 water/ glycol coolant, which is force-circulated inside
a radiator-closed system. The cooling opening is
the mouth below the propeller in the front of the nacelle; the warm air exhaust is at the rear of the
nacelle.
Fig. 15. Central nacelle inner elements: motor left, batteries right, parachute rescue system in
the middle
A series of charge-discharge cycles also
were conducted at Mifflin, simulating the power regimes the Taurus G4 would be subject to in flight during the races. Cooling as well as battery performance and endurance was verified.
2.2 First Flights
At Oshkosh, WI, USA, the Taurus G4 flew for the first time on August 11, 2011 with the experienced test pilot Dave Morss at the
controls. The reason behind the delay between the testing in Pennsylvania and the first flight was the
postponement of the competition date.
Fig. 16. Taurus G4 high above Oshkosh, WI
With Morss’ feedback and data collected with the on-board flight/engine logger, the electrical system was further optimised and responses tweaked. Over the course of one week, the first 11 flight hours were completed and the Taurus G4 cleared FAA imposed Phase 1 of flight testing, which meant it could be flown anywhere in the USA from then onwards.
2.3. Performance Oriented Testing
The Taurus G4 was moved again, this time to Hollister, CA, USA, which is within flight distance to Santa Rosa, CA, where the GFC 2011 was to be held. Hollister is also very predictable in terms of weather and allowed flying with the
Taurus G4 every single day of the race-preparation phase.
Every day brought new knowledge about the aeroplane and as the data accumulated over time, the team assembled a mathematical performance model [7] of the Taurus G4, which allowed predicting the aeroplane’s behaviour in a race environment with high fidelity.
The model, assembled in Matlab/
Simulink computer environment later served
as a basis for pre-flight planning and in-flight
online performance optimisation. It includes data
on battery system performance and behaviour,
aerodynamic data and can determine the influence
of a given wind situation aloft.
While it was originally planned to use a netbook computer in the cockpit during the race
and run the model during the actual race flights,
this idea was abandoned due to reliability issues with the hardware selected. Instead, the model was used on ground where several flight plans for the pilots were prepared, based on different simulation runs. With the wind data known from aviation forecasts, simulations were made for
then-known course. The pilots received a very simple checklist, which only contained time, at which the aeroplanes must be at a certain turning point, the planned electric power to achieve the desired average travelling speed (taking wind into
account) and the cumulative energy consumption
in kWh.
Fig. 17. Performance testing at Hollister, CA
Careful readers would notice that the flight-testing was never conducted for different weights
and centre-of-gravity positions. This is closely
linked to the twin-fuselage configuration of the Taurus G4. The aeroplane can actually be flown in only one configuration (always at Maximum
Take-off Mass) and one, carefully determined centre of gravity position.
3 TAURUS G4 SPECIFICATIONS
Due to the unique configuration of the aeroplane, some aspects of the performance
envelope were not known in advance.
While the efficiencies of the propeller and powertrain matched theoretical data within one percent, the L/D ratio proved to be rather different than anticipated. This was linked to a very complex aerodynamic form or the Taurus G4, with three different wing sections and three different fuselage bodies. On the middle wing there was some flow separation at speeds just below 100 mph (160.9 km/h), which was sourced to complex propeller wash influencing the laminar boundary layer locally. Hence, the global maximum of L/D characteristics was shifted to a higher airspeed and the shape of the curve was mutilated to some degree. To designers’ satisfaction, L/D ratio at higher airspeeds, however, proved to be superior
to the calculated one.
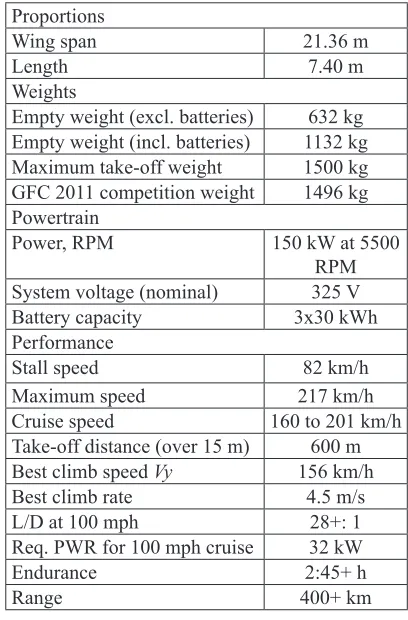
The specifications and performance data as
obtained through flight-testing of the Taurus G4
are summarised in Table 1. The 3-view drawing of the Taurus G4 is presented in Fig. 198.
Fig. 18. Taurus G4 3-view drawing
Table 1. Pipistrel Taurus G4 basic data
Proportions
Wing span 21.36 m
Length 7.40 m
Weights
Empty weight (excl. batteries) 632 kg
Empty weight (incl. batteries) 1132 kg
Maximum take-off weight 1500 kg
GFC 2011 competition weight 1496 kg
Powertrain
Power, RPM 150 kW at 5500
RPM System voltage (nominal) 325 V
Battery capacity 3x30 kWh
Performance
Stall speed 82 km/h
Maximum speed 217 km/h
Cruise speed 160 to 201 km/h
Take-off distance (over 15 m) 600 m
Best climb speed Vy 156 km/h
Best climb rate 4.5 m/s
L/D at 100 mph 28+: 1
Req. PWR for 100 mph cruise 32 kW
Endurance 2:45+ h
Range 400+ km
4 THE RACE AND RESULTS
event, designed to promote efficiency of flight,
with particular emphasis on all-electric aircraft. The actual event consisted of two flights, each oriented toward a different aspect of aircraft’s
performance.
The Economy Flight was a 200 statute mile flight, in the form of four 50-mile laps, where the
competitors had to fly the course as economically
as possible. To qualify for the win, the aeroplane had to exhibit a fuel consumption of no less than 200 passenger-miles-per-gallon, while the average flight speed had to be in excess of 100 mph (160.9 km/h). The winner of this flight was the aeroplane that exhibited the highest passenger-miles-per-gallon score, where one passenger-miles-per-gallon was converted to an equivalent of 33.7 kWh for electric aeroplanes.
Fig. 19. Behind the scenes, just before take-off for the Economy Flight
The Speed Flight was flown over the same
200 statute mile course as the economy flight.
However, the aeroplanes had to fly as fast as possible, but still have enough energy on board
after landing to demonstrate a 30 minute reserve
in power, based on the average power used during the Economy Flight.
The overall winner was determined by the following scoring Eq.:
Score
a b
= +
1
1 2, (1)
where a is the average flight speed achieved
during the Speed Flight and b the passenger-miles-per-gallon efficiency achieved during the
Economy Flight.
Before the race events, there were multiple occasions where it was proven that the fidelity of the model closely matched what the Taurus
G4 and their pilots could do in-flight. Both race
events were flown even more precisely than ever before, finishing one flight 20 seconds ahead of schedule and 0.2 kWh short of energy
consumption prediction, and the second flight 6
seconds ahead of schedule and 0.4 kWh ahead
of target energy prediction. This degree of model
vs. reality precision allowed Pipistrel team to maximise their score by flying as fast as the conditions allowed while maintaining the required 30-minute power reserve exactly. The results together with final score and performance of other teams are presented in the NASA official table of results, in Table 2.
Fig. 20. Taurus G4 at start of the Speed Flight
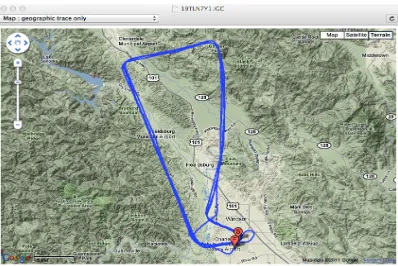
Fig. 21. Ground track from Speed Flight
5 CONCLUSION
The Taurus G4 finished the Green
Flight Challenge as the winner, demonstrating
unprecedented efficiency of flight (403.5 pMPG).
Moreover, it is the largest, most powerful, fastest
(enduring) and most economic electric aeroplane to date.
Part of this efficiency came about because
of an inspired design. The Taurus G4 used a
useful load fraction (or empty weight fraction
of 39%). The Taurus G4 also achieved a motor/
controller efficiency of 96%, and utilized the largest battery pack ever assembled for auto or aviation use of 90+ kWh, which included a 30-minute reserve capacity. It is noticeable that it was the combination of configuration, structural
efficiency, aerodynamic efficiency and the unique
electric powertrain that gave the edge to Pipistrel’s
Taurus G4 over the most serious competitor,
the eGenius, which flew a more conventionally
configured aeroplane.
Table 2. Official table of results in SI units
Efficiency Competition
Pipistrel e-Genius Phoenix Eagle
Eco-Fuel used 14.45 14.45 Liters 100 LL Energy used 65.4 34.7 3.8 kWh Equivalent fuel used 7.45 3.89 15.00 15.50 Liters auto fuel Flight time (for speed) 1:47:16 1:48:27 2:25:01 2:00:48
Flight time (for milage) 1:49:37 1:50:23 2:25:43 2:04:07 Distance (for speed) 308.9 307.3 300.4 228.5 km Distance (for milage) 315.2 311.6 302.2 238.3 km Milage 171.8 159.9 40.1 30.7 km/l/P Speed 172.8 170.1 124.4 123.4 km/h Speed Competition
Fuel used 25.0 15.8 Liters 100 LL Energy used 68.3 37.5 3.0 kWh Equivalent fuel used 7.67 4.20 26.08 7.19 Liters auto fuel Flight time (for speed) 1:41:55 1:47:45 1:22:11 1:42:21
Flight time (for milage) 1:44:10 1:50:24 1:22:57 1:4:53 Distance (for speed) 310.5 310.0 303.1 234.9 km Distance (for milage) 316.7 315.7 304.9 234.0 km Milage 165.3 150.0 23.4 27.9 km/l/P Speed 182.8 172.6 221.2 134.0 km/h Score 72.7 68.3 35.1 25.2
To conclude, the authors would like to quote a letter by an aviation enthusiast, who also witnessed the preparations for the race:
“I was there for the last flight of the Taurus G4 at Hollister after their return from the awards
ceremony. There was just me – no other visitors – they had just won the prize and there was no
one there but me. I was at the last big National
Air Race in Cleveland, 1947, maybe. There were
several hundred thousand spectators there. What
a contrast! I have no idea how disruptive electric propelled flight will be, but surely it interests more than just me. Congratulations to the team! They’ve shown they can do things none of the
other 7 billion people in the world can do!” Sincerely, Bob Lockhart
6 ACKNOWLEDGEMENTS
The team, Pipistrel-USA.com
Operation part financed by the European Union, European Social Fund (Junior Researchers). Operation part financed by the Slovenian Research Agency (ARRS L2-3644).
7 REFERENCES
[1] www.nasa.gov/challenges/, accessed on 2011-11-25
[2] http://cafefoundation.org/v2/gfc_main.php, accessed on 2011-11-25
[3] h t t p : / / c a f e f o u n d a t i o n . o rg / v 2 / p a v _
pavchallenge_2007_results.php, accessed on 2011-11-25.
[4] h t t p : / / c a f e f o u n d a t i o n . o rg / v 2 / p a v _ gatchallenge_2008_results.php, accessed on 2011-11-25.
[5] http://cafefoundation.org/v2/pdf_GFC/GFC.
TA.07.28.09.pdf, accessed on 2011-11-25. [6] http://cafefoundation.org/v2/pdf_GFC/GFC.
FOV.122709.pdf, accessed on 2011-11-25. [7] Tischler, M., Remple, R. (2006). Aircraft
and Rotorcraft System Identification: Engineering Methods With Flight-test
Examples. American Institute of Aeronautics and Astronautics, Reston.