Effects of Hot-Water-Pipeline Renovation in a District
Heating System
Ljubenko, A. ‒ Poredoš, A. ‒ Zager, M. Andrej Ljubenko1,* ‒ Alojz Poredoš1 ‒ Miran Zager2
1 University of Ljubljana, Faculty of Mechanical Engineering, Slovenia 2 Municipal Utility Company Velenje, Slovenia
In this paper the attention is on the heat losses of a main, aboveground supply, hot-water pipeline, whose length is 5430 m. It is situated between the Šoštanj Thermal Power Plant (TEŠ) and the Central Energy Station (CES) Velenje as part of the district heating system in the Šaleška Valley. It was renovated because major heat losses were identified. A numerical analysis and a comparison between the temperature fields of the pipe’s insulation before and after the renovation was performed to discover the main causes for the high heat losses before renovation. An integral measuring method for determining the heat losses was adapted and used to determine the pipeline’s heat losses after the renovation. Taking into consideration the real operating parameters, the annual energy savings and the consequent operational cost reduction, due to the lower heat losses, resulting from the pipeline renovations, are presented. The calculation is made with measured heat-loss coefficients and is therefore based on the real state of the pipeline. The aim is to show the necessity to investigate the heat losses of a hot-water pipeline whose design or state of insulation is questionable.
©2011 Journal of Mechanical Engineering. All rights reserved.
Keywords: district heating, heat losses, pipeline renovation, thermal bridges
0 INTRODUCTION
In district heating (DH) systems a substantial amount of energy losses is linked with the energy transport to consumers because heat losses in the distribution network (DN) occur. Therefore, it is essential to focus a lot of attention on the system design, operation and management [1]. Hot-water pipeline insulation must be a key parameter in DN design to achieve its sufficient thermo-economic operation [2]. Heat losses from district heating pipes seem vastly underestimated by DH companies because of insufficient data of actual heat losses, as highlighted in [3]. In [4] high heat losses of a district heating system were attributed to poor thermal insulation and
over-dimensioning of pipe sizes.
A review of available literature about steady-state heat losses in buried district heating pipes was carried out in [5]. Steady-state heat losses from buried pre-insulated pipes generally consider heat transfer coefficient between the pipe and the ground. In addition, heat transfer coefficients between supply and return pipes are also considered. However, from the engineering point of view acceptable results are obtained
by considering only one linear heat transfer coefficient for each pipe and one temperature
difference, between water and the ground [6].
The construction of the pipeline’s insulation plays a very important role because possible thermal bridges can substantially decrease its insulation properties. When a detailed analysis of the causes for high heat losses in a pipeline with complex insulation geometry is desired, we resort
to numerical program tools [6] and [7]. During the numerical analysis a lot of generalizations
and presumptions are usually made. In addition, the actual state of the insulation is not considered. Therefore, a heat-loss measurement gives better results. Thus, it is important to have available experimental methods to determine the state of the insulation on existing DH systems.
determine the heat losses and the critical sections in the DH network during an undisturbed heat supply to all consumers. This is feasible with the following methods: measurement of the insulation or ground temperatures [9], infrared thermography (the TX model) [10], the integral method and heat meters balance. The only one that enables us to determine all of the heat losses on a chosen section is the integral method, which consists of
a temperature decline (ΔT) and mass-flow (m) measurement. The heat losses are calculated as:
Q mc T= p∆ , (1)
where cp is the specific heat of the water.
DH systems have a long lifetime, during which a substantial decrease in the quality of the insulation or the technical progress in its construction or materials can occur [11]. New state-of-the-art systems are usually constructed of pre insulated pipes with highly-efficient polyurethane (PUR) insulation. Such pipes can include insulation-embedded copper wires for the purpose of leak detection and diffusion barriers to avoid aging of the insulation material due to diffusion of gases [12] to [14]. Thus, renovation of individual sections in existing DH systems can lead to important energy and financial savings. This leads to a short payback period for the renovation investment [15]. In addition, energy losses greatly affect the advantages of DH systems, compared to
individual heating systems [16]. In a report [11]
it is suggested that heating utilities should review their concepts for insulating the district-heating lines at regular intervals of about 5 years and to evaluate the heat losses of their DN with regard to possible savings potentials.
1 DISTRICT HEATING IN THE ŠALEŠKA VALLEY
DH systems can be divided into three basic parts: energy production, distribution network and off take sites by the consumers.
For the needs of the DH system in Šaleška Valley the heat is produced in the Šoštanj Thermal Power Plant (TEŠ). There, heat and power are partially produced in combination (condensing turbine) and partially produced separately. The heating power is 192 MW.
At the location of the TEŠ the heat is purchased by the Municipal Utility Company Velenje, which supplies heat through a branched DN to the consumers. Fig. 1 shows the whole DN, where the overall length of the supply pipelines is more than 140 km and is composed of several intermediate heat stations, reducing stations and dividing shafts. These diversify the network and/ or change the temperature and pressure regimes.
The biggest heat stations are the Central Dividing Heat Station (CDHS), which divides the pipeline from the TEŠ in the directions Šoštanj and Velenje, and the Central Energy Station
(CES). In the CES the pipeline is branched for the needs of the heat supply to Velenje. Between these two stations there are two, 5430-m-long, main aboveground pipelines, with different inner diameters (ID) of the steel pipe, (named as ID 450 and ID 350) which supply heat to all the consumers in the direction CDHS-Velenje. It is inappropriate for both hot-water pipelines to always be in operation as the need for heat is not constant throughout the year. The purpose is
operation optimization since one pipeline has
lower heat losses than both of them. Therefore, only one should be in operation if it can supply sufficient quantities of heat. The results of the
optimization in 2007 are shown in Fig. 2.
The supply-water temperature is mostly dependent on the time of the year and the location in the network. The temperature is changed due
to system temperature optimization, which is the
most accessible way to reduce the heat losses, because it often does not require renovations.
The DN in Šaleška Valley consists of underground pipes in concrete ducts, pre-insulated underground pipes and aboveground pipes. To a large extent the heat is distributed in a two-pipe system, where there is one supply and one return pipeline. However, some of the sections consist of a three-pipe system, where the supply of heat for space heating and domestic hot water is divided.
1.1 ID 350 Construction before Renovation
Steel pipes inner diameter of the analyzed
aboveground pipeline (ID 350) is 350 mm. It is
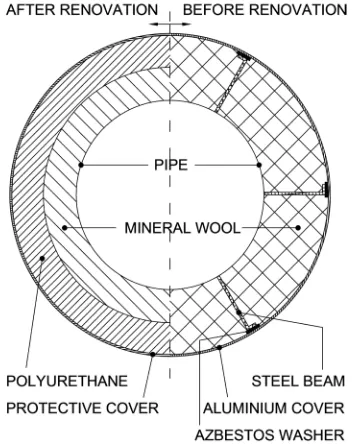
composed of an insulated pipe, fixed and sliding supports. The overall heat losses of the pipeline are the sum of the losses of its parts. The pipe is insulated with 120-mm-thick mineral wool. The outer aluminum cover is supported with six steel beams (Fig. 3).
Fig. 3. Pipe’s cross-section before and after the renovation at the location of the steel beams
The fixed and sliding supports are the elements, which, if not properly designed, in addition to their structural capabilities, also represent distinct thermal bridges.
1.2 ID 350 Construction after Renovation
The construction of all the hot-water pipeline parts that contribute to the heat losses was renovated. This means that the pipe’s insulation, as well as the sliding and fixed supports, were renovated. There was no need to renovate the steel pipe and it was not replaced. A comparison of the pipe’s insulation before and after the renovation can be seen in Fig. 3. The reason for the two-layer insulation after the renovation is that the supply temperatures are too high for polyurethane, the investment savings and the better insulating properties.
The design of the fixed and sliding supports was improved with the implementation of Teflon washers between the steel support and the pipe. With the washers the contact surface is partially reduced, but primarily, the thermal resistance is increased.
According to the information acquired from the Municipal Utility Company Velenje in the whole DH system in Šaleška Valley annual water leakage is 21,900 m3, which amounts to about 2.06 GWh of heat. Their assessment of the
annual system heat losses is 83 GWh. Since the
analyzed pipeline is aboveground (water leakages
are easily spotted) and the heat losses of water leakage represent only about 2.5% of the total system heat losses they were neglected for the purpose of this study.
2 HOT-WATER PIPELINE’S HEAT LOSSES
Before the renovation the high pipeline’s heat losses were identified in a study [17]. There the foundation for the heat-loss measurements was the integral measuring method, where the temperatures Tin and Tout were measured. At both
locations, in addition to the temperatures, the volume flows were also measured. From the two different flow data (because of the undisturbed heat supply), the average mass flow was calculated. The acquired data was used to calculate the heat losses, which are, for the purpose of determining
the effects of the renovation, summarized in this paper. The determined heat losses were 456 W/m.
At the temperatures of the supply water (140
°C) and the surrounding air (‒10 °C) the
heat-loss coefficient was 3.04 W/(mK), its measuring
accuracy ±10%. As a result of the study the pipeline was later renovated.
A numerical analysis was made, where the
temperature fields of the insulation construction at
the location of the steel beams was calculated to better understand the causes of the high heat losses before the renovation. The results are compared to the renovated state.
To test the effects of the renovation, the heat losses after the renovation were measured.
2.1 Numerical Analysis of the Insulation Construction
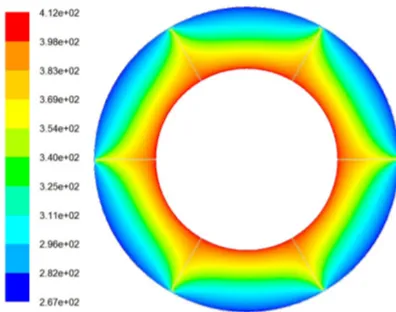
The numerical analysis was made using Ansys Fluent as the program tool. The accounted boundary conditions are as follows: a supply-water temperature of 140 °C and a
surrounding-air temperature of ‒10 °C. The temperature field
before and after the renovation is displayed in Figs. 4 and 5. The vast thermal bridges can easily be seen in Fig. 4. However, they are removed in Fig. 5, which leads to extensive energy savings.
Fig. 4. Temperature field (K) of the pipe’s insulation construction before renovation
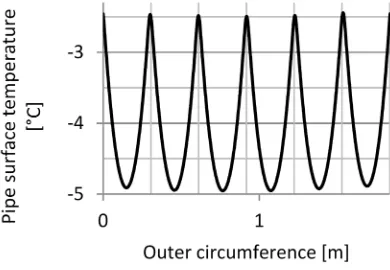
Fig. 6 shows the apparent temperature
rise in the outer surface temperatures before the renovation on the location of the circumference where the steel beams are.
measured high heat losses before the renovation can be mainly attributed to an inappropriate insulation design and not to its worn state. However, the numerically obtained results do not illustrate the overall hot-water pipeline’s heat losses, because all of the pipeline’s parts and their state are not included. Therefore, the effects of the renovation are based on the measured results. It is also meaningless to calculate the heat loss coefficients based on numerical analyses because they would not show all hot-water pipeline heat loses, but just the critical part.
Fig. 5. Temperature field (K) of the pipe’s
insulation construction after renovation
Fig. 6. Pipe’s superficial temperature before renovation
The purpose of numerical analyses, which was to assess the main deficiency of insulation construction before renovation, was met. Six steel beams which support the outer aluminum cover before renovation are the main construction features that lead to high heat losses. Measured
pipelines heat losses are higher than the ones calculated in Figs. 4 and 5 because of real construction and materials used (not ideal), ageing of the insulation and heat losses on fix and sliding supports.
2.2 Measured Heat Losses after Renovation
While performing heat-loss measurements in the Šaleška Valley DN specific conditions occurred. Therefore, some presumptions and
generalizations for the integral experimental
method had to be made. The heat supply to all of the consumers had to be undisturbed during the heat-losses measurement. Thus, it was not possible to plug off in-between consumers. Therefore, the mass flow was not constant throughout the whole section. However, a relatively small amount (about 10%) of heat was being offtaken at the measured section. Most of it was being transferred to consumers in Velenje (Fig. 1).
Fig. 7. Searching for the maximum
cross-correlation coefficient
While performing the test measurements unperiodic, random fluctuations in the supply temperature of 1 to 2 °C were discovered, which made it possible to determine the time of the temperature wave’s travel through the section. This can be determined by searching for the maximum in the cross-correlation coefficient [18] for the discrete data from two independent temperature sensors Tin and Tout (Fig. 7). Time
measurement is marked as t. Tin is the temperature
measured at the beginning of the section and
Tout at the end. The cross-correlation coefficient
shows a linear relationship of the data from the two temperature sensors, so by discovering its maximum it can be determined when the water from temperature sensor Tin has reached Tout.
Consequently, an average segment water velocity can be determined. During the measurements, stationary flow conditions were required, which were monitored by an ultrasonic volume flow meter at the location of the temperature sensor
Tout.
Fig. 7 shows the basic principle of the temperature wave’s travel time determination. Considering the fluctuations of the temperature
Tin, the time interval was determined, and with a
chosen sampling rate the number of discrete data
n, which are considered in correlation (the gray area in Fig. 7). This interval has to be large enough to cover the characteristic random temperature changes. In the next step the maximum of the cross-correlation coefficient was searched between n data Tin and the same amount of Tout.
The searching was designed in such a way as to make it possible to find the intervals where Tin and Tout are the most correlated. Time at the beginning
of interval with Tin is marked as ta and time at
the beginning of interval with Tout is marked as tb. Then the temperature wave’s travel time was
calculated as:
τ = tb ‒ ta . (2)
Based on the temperature wave’s travel time the average section water velocity can be calculated:
v L=
τ, (3)
where L is the section length.
Next, the average mass flow was calculated:
m A v= ⋅ ⋅ρ, (4) where A is pipe’s cross-section and ρ is the average water density (between Tin and Tout).
At this point enough information is known to calculate the section’s heat losses:
Q mc T= p
(
in−Tout)
. (5)More characteristic and comparable with each other is the information about the heat losses that each meter of hot-water pipeline has:
q Q L
= , (6)
and the heat-loss coefficient:
H q
T Tw surr =
−
, (7)
which shows the pipeline’s heat losses for a given temperature difference between the system’s circulating water Tw and that of the surroundings Tsurr.
In the considered data interval, acquired while performing the measurement, the average supply temperature was 140.7 °C and the air temperature was 2.9 °C. These temperatures led to heat losses of 100.4 W/m and a heat-loss
coefficient of 0.73 W/(mK). Accuracy of the
temperature change (Tin ‒ Tout) was calculated as
±5.8% and the accuracy of mass flow assessed as
±5% which results in calculated accuracy of
heat-loss coefficient ±8%.
3 EVALUATION OF THE HEAT LOSSES
To determine the effects of the hot-water pipeline renovation, its annual heat losses before and after the renovation were calculated. Knowing the price of heat for the DH company, econonomical evaluation was conducted.
The heat losses for an individual month of the year are calculated as:
Qm = H·(Tw,m ‒ Tsurr,m)·tm·L , (8)
where Qm are the pipeline’s monthly heat
losses, Tw,m is the average monthly
circulating-water temperature, Tsurr,m is average monthly
surrounding-air temperature, tm is the time of the
evaluated month and L is the pipeline’s length. If the price of the heat is c, the cost of the heat losses is calculated as:
C = Qm·c . (9)
4 EFFECTS OF THE RENOVATION OF THE HOT-WATER SUPPLY PIPELINE CDHS – CES
ID 350
well as the operation time and the price of the heat have to be considered. The data used in this paper were for the year 2007. The price that the DH company, Public Utility Company Velenje, had to pay to TEŠ was 10.38 €/MWh. The remaining data are shown in Figs. 2 and 8.
4.1 Reduction of Heat Loss in the Supply Pipeline
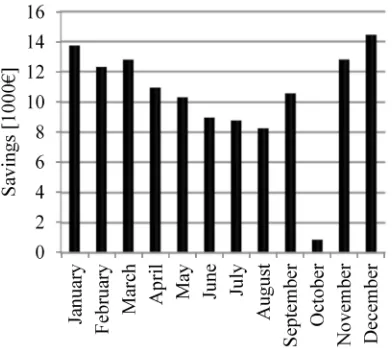
When observing Figs. 9 and 10 it is important to consider the hot-water pipeline
operation time. In the periods January–September and November–December it was always in operation. In October it only operated for two days. Therefore, the columns for October are proportionally lower.
In Fig. 9 the calculated monthly heat losses are shown for the pipeline before and after the renovation. The black column also points out the difference.
The direct consequences of the heat-loss reduction are financial savings due to lower
Fig. 8. Average monthly temperatures in 2007
amounts of heat, which the DH company has to purchase from TEŠ. These are shown in Fig. 10.
If we add up the results from Figs. 9 and 10 the following results are acquired. On an annual level calculated pipelines heat losses amounted
to 15,635 MWh. To purchase this heat from TEŠ
the Public Utility Company Velenje would have
to pay 162,295 €. After renovation the calculated heat losses are 3,600 MWh. To purchase this
heat 37,371 € are needed. Thus we can calculate the savings due to pipeline renovation. With renovation 12,035 MWh of heat is saved which is in financial terms 124,924 €.
Fig. 10. Financial savings due to pipeline renovation
5 CONCLUSIONS
A numerical analysis of the pipe’s insulation has led to a conclusion that the causes for the high heat losses before renovation are mainly due to the design of the insulation construction.
An adapted integral method for the experimental heat-loss determination has been suitable for an assessment of the pipeline’s heat losses. The cross-correlation water-velocity measurement enables an average mass-flow calculation on a measured section, which is the best possible actual state assessment while the heat supply is undisturbed.
The heat-loss coefficient demonstrates the fact that the pipeline’s heat losses are, under certain presumptions (temperature independent thermal
conductivity, neglected influence of nonlinear heat losses due to radiation of pipes outer surface), linearly dependent on the temperature difference between the water temperature in the pipe and the surrounding air. Thus, it enables heat-loss calculations for arbitrary conditions.
The effects of the hot-water pipeline have revealed that its insulation before renovation was unapropriate. After renovation, the heat losses determined on measured results were reduced by 77%. This data is comparable with a study [4] where the efficiency of heat insulation for one district heating system is estimated as three times less than in a good example case.
Based on the price of heat and the temperature conditions data from 2007, the financial savings due to the heat-loss reduction after renovation were calculated. It was found out that the cost of the heat losses in 2007 for the unrenovated 5430-m-long pipeline would be
162,295 €. After the renovation they were 37,371
€.
6 REFERENCES
[1] Verda, V., Borchiellini, R., Calì, M. (2001). A thermoeconomic Approach for the Analysis of District Heating Systems. International Journal of Applied Thermodynamics, vol. 4, p. 183-190.
[2] Ӧztürk, İ.T., Karabay, H., Bilgen, E. (2006). Thermo-economic optimization of hot water
piping systems: A comparison study. Energy, vol. 31, p. 2094-2107.
[3] Ostergaard, T. (2005). Why should district heating companies spend money on carrying out hydraulic analyses. News from Danish Board of District heating, no. 1.
[4] Hlebnikov, A., Dementjeva, N., Siirde, A.
(2009). Optimization of Narva district heating
network and analysis of competitiveness of oil shale chp building in Narva. Oil Shale,
vol. 26, p. 269-282.
[5] Bøhm, B. (2000). On transient heat losses from buried district heating pipes.
International Journal of Energy Research, vol. 24, p. 1311-1334.
low-energy district heating, with focus on heat losses. Energy, vol. 36, p. 2407-2418.
[7] Poredoš, A., Poredoš, A., Škerget, L. (2001).
Some possibilities for reduction of heat losses in district energy systems. SDDE – Slovene District Energy Association, Ljubljana. (in Slovene)
[8] Bøhm, B. (1999). In – situ determination of heat losses from buried district heating pipes.
News from Danish Board of District heating, no. 4.
[9] Perpar, M., Žun, I., Gregorc, J., Bajrič, S., Zajšek, B. (2010). Setting up of measuring
system for evaluation of heat losses on district heating network of Ljubljana. International Conference on District Energy Proceedings, p. 159-166.
[10] Zinko, H., Bjärklev, J., Bjurström, H., Bjurström, M., Bøhm, B., Koskelainen, L., Phetteplace, G. (1996). Quantitative heat loss determination by means of infrared thermography – The TX model. International Energy Agency, IEA District Heating – Annex 4 – Network Supervision.
[11] Schmitt, F., Hoffman, H.W., Göhler, T.
(2005). Strategies to manage heat losses – technique and economy. International Energy Agency, Program of Research, Development and Demonstration on District Heating, Mannheim.
[12] Olsen, P.K., Lambertsen H., Hummelshøj R., Bøhm B., Christansen C.H., Svendsen S., Larsen C.T., Worm J. (2008). A new low-temperature district heating system for low-energy buildings. The 11th International Symposium on District Heating and Cooling. [13] LOGSTOR. District Heating, from
http://www.logstor.com/showpage.php? pageid=5765476, accessed on 2011-06-07.
[14] Persson, C., Jarfelt, U., Ramnäs, O., Reidhav, C. (2006). Insulating performance of flexible
district heating pipes. 10th International Symposium on District Heating and Cooling. [15] Bejan, A., Tsatsaronis, G., Moran, M.
(1996). Economic analysis. Thermal Design and Optimization. John Wiley and Sons,
Hoboken, p. 333-462.
[16] Çomakli, K., Yüksel, B., Çomakli, Ӧ. (2004).
Evaluation of energy and exergy losses in district heating network. Applied Thermal Engineering, vol. 24, p. 1009-1017.
[17] Poredoš, A., Besednjak, D., Dimnik, M. (1994). Heat losses analysis of an aboveground pipeline in a district heating
system of Šaleška valley. University
of Ljubljana, Faculty of Mechanical Engineering, Ljubljana. (in Slovene)
[18] Bendat, J.S., Piersol, A.G. (2010). Random data: analyses and measurement procedures.