R E S E A R C H
Open Access
Quantitative change of EEG and respiration
signals during mindfulness meditation
Asieh Ahani
1, Helane Wahbeh
2, Hooman Nezamfar
1, Meghan Miller
2, Deniz Erdogmus
1and Barry Oken
2,3*Abstract
Background: This study investigates measures of mindfulness meditation (MM) as a mental practice, in which a resting but alert state of mind is maintained. A population of older people with high stress level participated in this study, while electroencephalographic (EEG) and respiration signals were recorded during a MM intervention. The physiological signals during meditation and control conditions were analyzed with signal processing.
Methods: EEG and respiration data were collected and analyzed on 34 novice meditators after a 6-week meditation intervention. Collected data were analyzed with spectral analysis, phase analysis and classification to evaluate an objective marker for meditation.
Results: Different frequency bands showed differences in meditation and control conditions. Furthermore, we established a classifier using EEG and respiration signals with a higher accuracy (85%) at discriminating between meditation and control conditions than a classifier using the EEG signal only (78%).
Conclusion: Support vector machine (SVM) classifier with EEG and respiration feature vector is a viable objective marker for meditation ability. This classifier should be able to quantify different levels of meditation depth and meditation experience in future studies.
Background
Mind-body medicine, such as meditation and yoga, is the most commonly used type of complementary and alterna-tive medicine treatment [1]. MM is popular and teaches skills applicable to everyday life situations. Meditation is a practice or brain state that has been developed from many different approaches. A key facet of one meditation practice, MM, is attending to the present moment in a non-judgmental way. Specific examples of MM interven-tions, such as Mindfulness-Based Stress Reduction and Mindfulness-Based Cognitive Therapy, have already been formally studied and applied in a variety of clinical con-ditions [5-8]. However, the evidence for efficacy is not definitive [2,3] and stems from several problems includ-ing inadequate controls, inappropriate and highly vari-able outcome measures, lack of measures for intervention adherence, and lack of a measure that evaluates the
*Correspondence: oken@ohsu.edu
2Department of Neurology, Oregon Health and Science University, Portland, OR, USA
3Departments of Behavioral Neuroscience and Biomedical Engineering, Oregon Health and Science University, Portland, OR, USA
Full list of author information is available at the end of the article
practitioner’s ability to engage in the mind-body medicine. This latter problem is especially important. There is cur-rently no objective measure that can assess meditation quality of the practitioner. Thus, making conclusions about mediation intervention efficacy without knowing whether the participant is actually meditating is problem-atic. Having an objective measure of meditation ability would greatly improve our understanding of mind-body medicine intervention trial data. Objectively assessing meditation ability might also shed light on why meditation trials succeed or fail.
Other researchers have made attempts to objectively evaluate body intervention ability. Physical mind-body interventions have been able to use objective ability measures such as video recording because of their observ-able nature. In meditation studies, one is not observ-able to observe the practitioners ability in the same way. Previ-ous studies have attempted to analyze meditation ability using self-rated measures [4] although, these measures are biased by the practitioner’s self-observation. The medi-tation intervention literature lacks any sort of objective adherence or meditation ability measures. It is essential for the mind-body medicine field to develop an objective
measure to assess meditation ability to move the field forward. Developing an objective measure to assess med-itation ability may potentially be done with physiological signals that we know are sensitive to meditation such as EEG and respiration.
EEG signals may be a viable objective measure of meditation ability because they are sensitive to medita-tion changes. EEG changes are well-documented during meditation state changes and from long-term medita-tion cross-secmedita-tional trait differences [2,9-12]. EEG signals are sensitive to meditation using spectral analysis, coher-ence, and synchrony techniques. Some studies have found meditation state and trait-related effects on EEG voltage and power in certain frequency bands. However, which EEG component and its direction of change (greater or lesser) have not been consistently observed [9]. Spectral analysis can demonstrate the activity of brain over differ-ent regions and differdiffer-ent states. The spectral coefficidiffer-ents can be employed to develop a classifier for distinguishing between meditation and control conditions, with optimal parameters, calculated on overall brain activity. Coher-ence, or spectral covariance, includes both amplitude and phase in a measure of phase consistency between pairs of signals in each frequency band [13,14]. EEG coher-ence has also been examined as an index of functional connectivity among different cortical areas in medita-tion studies. Increased alpha-theta range coherence has been reported both intra- and inter-hemispherically dur-ing meditation [9,15] and also as a meditation ability trait [16,17]. Although coherence does provide informa-tion on brain integrainforma-tion, it is limited in that it does not separate the effects of amplitude and phase in the inter-relations between two signals and is thus only an indirect measure of phase locking. It is also based on Fourier analysis, which is highly dependent on the stationarity of the measured signal; this is not the case in EEG [13,18]. Other studies have examined EEG synchrony rather than just EEG spectral analysis or coherence. Synchrony is a newer approach to measuring the relationship between EEG signals recorded at different electrode sites; this measure quantifies the degree of phase-locking between different narrow band signals [13]. Gamma synchrony has been identified as a unifying mechanism in human cog-nitive activity [13]. One study reported increased gamma synchrony during meditation in expert meditators [19] but others have reported that most of the gamma activ-ity recorded from the scalp is related to muscle artifact (Clinical Neurophysiology 118 (2007) 1877-1888). Alpha synchrony is associated with local and global brain net-works [14]. Alpha synchrony was observed in experienced transcendental meditators compared to controls and increased alpha synchrony was seen during meditation [20]. In this study, both spectral and synchrony analysis are incorporated to develop an objective meditation marker.
EEG signals may also be potential objectives measure of meditation ability because they inform the neural corre-lates associated with meditation. Attending to the present moment has neural correlates but it is uncertain how spe-cific these neural correlates are to the meditation state. Attending to the current moment in a non-judgmental way, i.e., not generating any emotional associations to what is being attended to, also presumably has neural correlates. The neural correlates of these two MM com-ponents may be subtle and the definition of meditation will improve as we learn more about the neural correlates using objective physiological markers.
In addition to EEG, respiration is another objective physiological signal that is sensitive to meditation and could be used as an objective measure. Respiration has been shown to slow down without a direct instruction to do so [21]. However, this is not consistent and likely depends on type of meditation practice. Experienced meditators often have slower respiration rates compared to controls at rest and slower minute ventilation during meditation [22]. Other meditation techniques specifically direct the practitioner to slow their breathing down [23]. Slowed breathing has known physiological effects caused by parasympathetic activation, such as decreased oxygen consumption, decreased heart rate and blood pressure, and increased heart rate variability (HRV) [23]. Slowing breathing may be a simple physiological marker within subjects to assess the degree of meditation.
The overall goal of this project was to establish an objec-tive measure of meditation ability. This project used EEG and respiration signals as a starting point to evaluate them as objective measures of meditation ability based on their sensitivity to meditation. The EEG and respiration signals were recorded from novice meditator’s during meditation and a control condition after they had completed a six-week mindfulness meditation intervention (MMI). The recorded physiological signals were then analyzed using three quantitative methods: 1) spectral analysis of EEG signal during meditation and a control condition to deter-mine the effect of meditation on frequency behavior of EEG data at different locations over the scalp and time-frequency analysis of respiration using Stockwell trans-form; 2) phase synchrony analysis using phase lock value (PLV) calculation; and 3) a support vector machine (SVM) classifier constructed to perform classification using EEG frequency coefficient, respiration signal and a joint clas-sifier with both the EEG and respiration signal to assess the classifier ability to distinguish between meditation and control conditions.
Methods Participants
79 years). Participants were recruited with newsletters, email list serves, and flyers at Oregon Health and Sci-ence University (OHSU) and around the Portland, Oregon Metro Area. The participants were generally healthy older adults who reported stress. Inclusion criteria were: age 50–75 years old; baseline Perceived Stress Scale (PSS) [24] score ≥9; and willing to follow the study protocol. We focused on stressed older adults for this study because they are a large and growing population with less physio-logic compensatory ability to stress than younger adults. Exclusion criteria were: evidence of cognitive impairment as assessed by a score of less than 25 on the Mod-ified Telephone Interview for Cognitive Status (TICS) [25]; significant participant-reported medical/neurologic disease (e.g., major organ failure; insulin-dependent dia-betes, active cancer, or alcoholism); significant untreated depression, as assessed by Center for Epidemiologic Stud-ies Depression Scale (CESD) score greater than 16 and interview; were taking medications or have health con-dition that globally affects CNS function or physiologic measures, e.g., benzodiazepines and uremia; did not understand the instructions (e.g., cannot hear recorded instructions or are not fluent in English). These exclusion criteria were chosen to screen out participants with an underlying illness that may limit the benefit of the MMI, confound outcomes, or increase the likelihood of dropout. They also could not have prior experience with meditation classes or other mind-body classes (e.g., yoga or tai chi) within the last 24 months or more than 5 minutes daily practice in the last 30 days. The study was approved by the OHSU Institutional Review Board, and written informed consent was obtained from all participants.
Procedure
The study design for the randomized controlled trial is as follows. All participants had a telephone screening, Visit 1 baseline assessments (week 1), six-week MMI (weeks 2–7 for immediate start group or weeks 9–14 for delayed start group), Visit 2 (week 8), and Visit 3 (week 15). Demographic data were collected during the telephone screening and Visit 1. EEG and respiration data were col-lected at Visit 1, 2, and 3. Following volunteer inquiries, consents were mailed for review. Interested volunteers were then screened via telephone to insure a high likeli-hood of eligibility. This telephone screening was approved with a Waiver of Authorization from the Institutional Review Board. Eligible participants were then scheduled for Visit 1 where eligibility was finalized, written signed consent obtained, and physiologic data collected. Partici-pants were then randomized with a computer generated randomization program to receive the MMI immediately (immediate start group) or after week 8 following visit 2 (delayed start group). The study was single blinded: partic-ipants knew when they received the MMI but the assessor
did not know whether the participants received MMI just prior to visit 2 or visit 3. Physiologic data were collected again at Visit 2. Physiologic data were then collected again at Visit 3. The data included in this report are the EEG and respiration data collected at the visit, immediately after the intervention pooled for both groups (i.e. Visit 2 for immediate start group and Visit 3 for delayed start group).
Intervention
The specific MMI curriculum was adapted from Mindfulness-Based Stress Reduction (MBSR) and Mindfulness-Mindfulness-Based Cognitive Therapy (MBCT) programs [26,27] and has been more fully described [28]. In brief, training included a one-on-one 60-minute session weekly for six weeks taught by a trained and experienced teacher. The in-lab sessions included three components: 1) didactic instruc-tion and brief discussion concerning stress, relaxainstruc-tion, meditation, and mind-body interaction; 2) practice in meditation and other mindfulness exercises that the sub-jects perform both in session and daily at home; and 3) discussion about problem-solving techniques regarding their successes and difficulties in practicing and applying the exercises in daily life.
Meditation instruction included a body-awareness medi-tation. The instruction began with awareness of breathing and later expanded to include awareness of body sensa-tions, and cognitive and emotional experiences. Informal exercises, such as mindful movement and mindful par-ticipation in daily activities (e.g., washing dishes), were offered to help subjects generalize mindfulness beyond the formal meditation exercises. Participants were pro-vided with written materials and recorded audio guided meditation for each week’s at-home practice. Subjects were instructed to practice at home up to 30 minutes a day as a goal, but at least do some daily practice. The meditation homework recording had several possible shorter interval breaking points denoted by tones to allow for unpredictable time demands facing stressed adults.
EEG recording and protocol
analyses but will be incorporated in the future. We used Fp1, AF3, F7, F3, FC1, FC5, T7, C3, CP1, CP5, P7, P3, Pz, PO3, O1, Oz, O2, PO4, P4, P8, CP6, CP2, C4, T8, FC6, FC2, F4, F8, AF4, Fp2, Fz and Cz channels. Raw EEG was acquired with BioSemi active electrodes using common mode sense and driven right leg electrodes just to the left and right of Cz. Linked ear channel acquired with simi-lar referencing was also available for the analysis. Using BioSemi active electrodes, the quality of the electrode contact is assessed using offsets and the reported offsets were always in the acceptable range as stated by BioSemi. Respiration was measured with a light elastic piezoelec-tric belt (Ambu-Sleepmate, Maryland) around the par-ticipant’s chest near the diaphragm. Non-EEG channels were included in the meditation measure because they may improve the separation of meditation from control states.
EEG spectral analysis
A finite impulse response (FIR) linear phase 2–35 Hz bandpass filter (Equiripple, length 2811) is applied on EEG data to avoid baseline wandering and direct current (DC) bias and high frequency noise. Two artifact removal meth-ods were performed on the data. First a simple upper and lower voltage thresholding was used to avoid high volt-ages durations and flat channel effects (200μV as upper bound and 2μV as lower bound). Second, we performed an independent component analysis (ICA) to remove eye blink and eye movement artifacts using the logistic info-max ICA algorithm [29]. Subsequently, the cleaned EEG was further down-sampled to 64 Hz. It has been shown that EMG activity contributes to gamma bands recorded from scalp electrodes, therefore we have excluded gamma activity in our processing [30]. The first few samples were discarded from the data to avoid filter transient impact on signal. Power spectral density (PSD) was estimated at different electrode sites (averaged electrodes at frontal, central, parietal, occipital, right temporal and left tempo-ral regions; Figure 1) and for different frequency bands (theta [4-8) Hz, alpha [8-12) Hz and beta [12-30) Hz). This spectral analysis was performed on data recorded during the meditation and podcast sessions.
PSD estimation is a non-parametric method utilized to calculate power spectrum of EEG signal as a func-tion of frequency, while maintaining the balance between smoothing in time and frequency resolution. PSD is esti-mated using the Bartlett method [31], which averages periodograms for smoother PSD resulting in improved time/frequency resolution. This is done by dividing the data sequence into non-overlapping sequences by a Blackman-Harris window [32] and adding the resulting PSD calculated from Fourier coefficients. Letx[n] be the signal, in our case, EEG data, divided into consecutive sequencesxk[n] fork =1,. . .,K, each with lengthNand
Figure 1Six regions over scalp.Electrodes divided into six regions over scalp as frontal, central, parietal, occipital, right temporal and left temporal.
w[n] be the window function (Blackman-Harris window in this case). The resulting PSD can be estimated as:
ˆ
P(w)= 1
K
K
k=1
1
N |
N−1
n=0
xk[n]w[n]e−jwn|2
(1)
Once PSD is estimated for all electrodes and frequen-cies, it is grouped based on location and frequency bands. The PSD values for all frequencies at each band and differ-ent locations were subjected to a two-way within subject ANOVA (analysis of variance), involving factors of Condi-tion (MeditaCondi-tion, Control) and LocaCondi-tion (Frontal, Central, Parietal, Occipital, Right Temporal and Left Temporal) (Figure 1). Before applying ANOVA the distributions were checked for normality and if any were non-normal, the Box-Cox transformation was used [33].
Respiration time-frequency analysis
traditional frequency transforms assume that the sig-nal is stationary. The Stockwell transform (S-transform) [34] was used, because it reveals a wavelet-transform-like time-frequency representation of the signal and is found to be a good approach for TFA, since it employs a frequency dependent window length. Assumingx[n]= {x[0] ,x[1] ,. . .,x[N−1]} be the signal, in this case the respiration signal, the S-transform is computed as:
S(f,n]=A(f,n]ejφ(f,n]
= ∞
m=−∞
x[m]√|f | 2πe
−(n−m)2f2
2 e−i2πfm (2)
S(f,n] is the S-transform for all samples in time [n] and in the frequency (f). Respiration data was filtered and subjected to transform. The time-frequency S-transform was first subjected to Box-Cox S-transformation [33] to form an approximately normal distribution and then was analyzed with ANOVA with a factor of condition (Meditation, Control).
EEG phase analysis
First, baseline wandering and DC bias were removed using a FIR linear phase high pass filter with a cut-off frequency of 0.1Hz (Equiripple, length 2811). A low pass filter with a cut-off frequency of 32 Hz (Equiripple, length 260) was also applied to remove EMG noise. Then the EEG data was further down-sampled to 64 Hz. The first few sam-ples were discarded from the data to avoid filter transient impact on signal.
We calculated phase-lock value (PLV) as a measure of synchrony for different frequency bands and between each pair of electrodes for each condition. Synchrony was calculated as such. A S-transform was used to estimate the signal phase between 4–32 Hz (The range of theta, alpha and beta bands) at 1 Hz intervals for each electrode asφci(f,n],ci being the channel label withi = 1,. . ., 32.
For the electrode pair(ci,cj), the phase difference can be
calculated as:
θci,cj(f,n]=φci(f,n]−φcj(f,n] (3) To measure synchrony, we employv[n], a sliding rect-angular window onθci,cj(f,n] with lengthL. The PLV, a
measure of how much phase synchrony exists between the two signals at the given frequency and in the given time window, was calculated as follows:
PLVci,cj(f,n]=
1
L |
∞
m=−∞
ejθci,cj(f,n]v[n−m]| (4)
The threshold of synchrony was created by examining a distribution of PLV’s obtained from 500 pairs of surro-gate signals to determine the value of PLV threshold based on what would be typically expected to occur between asynchronous signals. The surrogate signals were created
by randomizing the phase of a given EEG signal, thereby destroying any synchronization of waves while maintain-ing identical power spectra. The histogram of all these val-ues was derived and The significant level ofp≥0.9 (90% confidence) is chosen to mark the high synchrony value among surrogate/random signals. This level is achieved at synchrony value equal to 0.79 on the histogram. Syn-chrony was defined as an electrode pair having a greater PLV value than this threshold of 0.79 at each frequency band.
The length of the window to calculate PLV was 2 sec-onds. Electrode pairs were arranged by taking the 6 elec-trodes from a region of interest and comparing them to all cross-region electrodes for a total of 76 pairs of electrodes (i.e. electrodes from the same region were not paired, because synchrony between them would be large simply due to their locations) for all times and between 4 Hz and 32 Hz. For each condition, the number of electrode pairs that had PLV above the threshold derived from surrogate signals (threshold = 0.79) were counted.
Support vector machine classification
The first step in classification and pattern recognition studies is feature extraction. Kernel Canonical Correlation Analysis (KCCA) [35] was employed to avoid redundancy in feature vectors. KCCA measures dependency between features and it helps with decreasing the redundancy between features in feature selection.
EEG and respiration signals were processed with the S-transform and corresponding features were extracted. LettingSc(f,n] be the S-transform for frequency values
f ∈ {f1,. . .,fF}and timenfor channelc ∈ {1,. . .,C}the
feature vectors are:
zn=
zT1n,. . .,zTcn,. . .,zTCn
T
(5)
where
zTcn=Sc(f1,n] ,. . .,Sc(fF,n]
(6)
Then given {z1,. . .,zN} for one session of EEG data,
the set of downsampled features were obtained using KCCA. Specifically, each feature vector for each chan-nel was shifted sample by sample and dependency index was calculated between the original vector and the shifted version. Ifen ∈ Rde is the signal over reproducing
ker-nel Hilbert space (RKHS)Fe, and forx = z
n andy =
zn−l, theIKCCA(l)index was computed using the following
expression with appropriate substitutions.
IKCCA(x,y)= sup gx∈Fx,gy∈Fy
covgx(x),gy(y)
var[gx(x)+κgx2Fx var[gy(y)+κgy2Fy
(κ >0)
Then the smallest nonnegativel, which is a local min-imizer ofIKCCA(l) was designated as the downsampling
factorL(i.e. L > 0 is the smallest positive integer such thatIKCCA(L−1) >IKCCA(L)andIKCCA(L) <=IKCCA(L+
1)). Using L, the downsampled (and minimally corre-lated) subset of features{z1,. . .,z1+L(k−1),. . .,Zfloor(N/L)} is obtained and has been used for the analysis below. This downsampling process ensures that we retain a large num-ber of samples, yet minimize the statistical dependency between them to the level of the first local minimizer of the dependency measure in (8).
For the EEG classifier, the S-transform was sampled along frequency in the range of [4,32] Hz with 0.25 Hz intervals. For the respiration classifier, the S-transform was sampled along frequency in the range of [0.0625,16] Hz. For the joint EEG and respiration classifier, S-transform-based feature of EEG and respiration were sim-ply concatenated. Figure 2 shows the flowchart of the classification process. To construct a joint classifier, the feature vectors from EEG and respiration signal were combined and subjected to KCCA. All feature vectors were normalized before applying the classifier. The nor-malized values at each group (train, test and validation groups) were calculated by subtracting the minimum from the values and dividing the result by the range.
SVM is a supervised binary classification model that has been extremely popular in the machine learning field [36]. SVM maps the input data into a different feature space and predicts for each input data, the specific label cor-responding to the output class. A discriminant function that indicates distance to the class boundary is a potential measure of meditation depth in the future.
SVM process maps the data into different categories in a higher dimensional space so that these categories are separated by an optimized margin and constructs a hyper-plane based on maximizing this margin. New data, then will be mapped into the same space and will be labeled according to their position on either side of the hyper-plane. This study used LIBSVM [37], a Matlab SVM toolbox that uses Radial basis function (RBF) kernels to nonlinearly map data into a high dimensional space.
All feature vectors were labeled as meditation or control classes and a 10-fold cross validation process was per-formed on the labeled data to obtain the optimized hyper
parameters for the RBF kernel (widthσ, overlap penalty
c). Accuracy was averaged across subjects.
Results
EEG spectral analysis
Within each frequency band, there was a condition effect by location (alpha: F(5,165) = 3511, p ≤ 0.001, beta:
F(5,165) = 5928.18,p≤0.001, theta:F(5,165) = 2477.12,
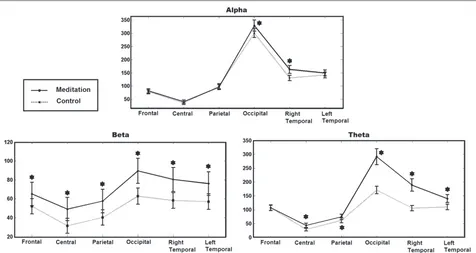
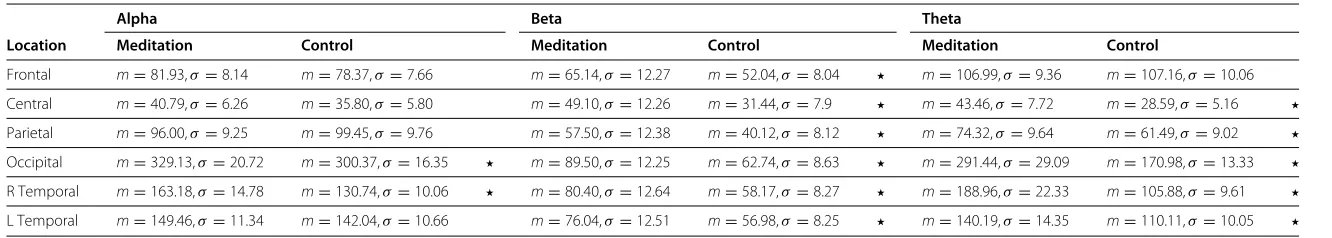
p≤0.001). Within each frequency band, there was also a condition effect across all locations (alpha: F(1,33) = 10.58, p ≤ 0.0011, beta: F(1,33) = 142.03, p ≤ 0.004, theta: F(1,33) = 118.79,p ≤ 0.001). There is an overall increase in power during meditation in beta and theta bands, while this increase is less for alpha and is not sig-nificant in frontal region in theta. The alpha band has a slight increase in power in the right temporal and occipital locations during meditation. Figure 3 shows the effect of condition in the different frequency bands and locations and shows the value of PSD over the scalp for differ-ent conditions and differdiffer-ent bands. Table 1 contains the numerical data corresponding to Figure 3.
Respiration time-frequency analysis
As shown in Figure 4 there is a clear distinction between meditation and control conditions, plotted from S-transform coefficients. The lower frequencies show greater activity during meditation, while higher frequen-cies show greater activity during the control condition. ANOVA was applied on Stockwell coefficients involv-ing the factor of state (Meditation, Control). ANOVAs of Stockwell coefficients resulted in a significant effect of meditation on respiration spectral coefficients (F(1,33) = 10.10,p≤0.005) (Figure 4).
EEG phase analysis
We applied this method to data for all subjects and aver-aged the values as shown in Figure 5. The results indicate that the number of electrode pairs exhibiting higher syn-chrony is increased while subjects are meditating, relative to the control condition.
Support vector machine classification
The accuracies for EEG-only, respiration-only and joint EEG/respiration SVM classifier were averaged among
Figure 3EEG spectral analysis.PSD estimation of EEG signal over alpha, beta and theta bands at different locations over scalp for meditation and control conditions averaged across subjects (N = 34). Star symbols show which comparisons are statistically significant.
subjects. Figure 6 shows the accuracy of the three classi-fiers. The joint classifier had a statistically higher accuracy than either the EEG or Respiratory classifiers. The accu-racies of the three classifiers were subjected to repeated ANOVA and showed the effect of classifier type on accu-racies (F(1,33) = 62.18,p≤0.001).
Discussion
The objective of the study was to evaluate EEG and res-piration as objective measures of meditation ability. We found that among three types of SVM classifiers con-structed by EEG-only, respiration-only and both feature vectors, we found the greatest accuracy using both EEG and respiration signals to discriminate between the med-itation and control condition. Combined EEG and respi-ration signals may be a potential marker of meditation ability.
Our spectral analysis results support most, but not all, previous studies conducted on meditation on theta, alpha, and beta frequencies. The spectral analysis from 34 novice meditators revealed a generalized increase in beta and theta EEG power during meditation com-pared to control state (except for frontal region in theta band). This increase was smaller in the alpha band and was more focused in the right temporal and occipital locations. Increases in theta power have been widely reported during meditation. In a meta-analysis of 64 stud-ies examining electrophysiologic measures in meditation, all of the studies that assessed theta reported an increase
during meditation [9]. Other studies have demonstrated increased theta during meditation and also in expert med-itators at baseline [9,15,38-41]. Additionally, the system-atic review is consistent with our alpha findings. Most studies show higher alpha power during meditation rel-ative to controls as well as cross-sectionally in expert meditators compared to non-meditators [9]. What is less common is the observation of increased beta during med-itation conditions. In one study, beta and occipital alpha were increased in ten participants in a meditation versus a control condition [42]. Our study also found increased EEG synchrony in the meditation versus control condi-tion.
Journal
o
fN
euroEngineering
and
R
ehabilitation
2014,
11
:87
Page
8
o
f
1
1
Table 1 EEG spectral analysis results
Alpha Beta Theta
Location Meditation Control Meditation Control Meditation Control
Frontal m=81.93,σ=8.14 m=78.37,σ=7.66 m=65.14,σ=12.27 m=52.04,σ=8.04 m=106.99,σ=9.36 m=107.16,σ=10.06 Central m=40.79,σ=6.26 m=35.80,σ=5.80 m=49.10,σ=12.26 m=31.44,σ=7.9 m=43.46,σ=7.72 m=28.59,σ=5.16
Parietal m=96.00,σ=9.25 m=99.45,σ=9.76 m=57.50,σ=12.38 m=40.12,σ=8.12 m=74.32,σ=9.64 m=61.49,σ=9.02
Occipital m=329.13,σ=20.72 m=300.37,σ =16.35 m=89.50,σ=12.25 m=62.74,σ=8.63 m=291.44,σ=29.09 m=170.98,σ=13.33
R Temporal m=163.18,σ=14.78 m=130.74,σ =10.06 m=80.40,σ=12.64 m=58.17,σ=8.27 m=188.96,σ=22.33 m=105.88,σ=9.61
L Temporal m=149.46,σ=11.34 m=142.04,σ =10.66 m=76.04,σ=12.51 m=56.98,σ=8.25 m=140.19,σ=14.35 m=110.11,σ=10.05 EEG power for beta, alpha, and theta frequency bands in(μV)2/Hz(m=mean,σ=standard deviation) for control and meditation conditions. Star symbols show which comparisons are statistically significant between
Figure 4Respiration time frequency analysis.Time frequency Analysis of respiration signal shows more activity in lower frequencies during meditation. The figure shows the Stockwell coefficients amplitude averaged across subjects (N = 34) in meditation and control conditions.
respiration rates compared to controls at rest and dur-ing meditation [43]. It appears that regardless of whether one is directing a slowed breathing rate during meditation, respiration is slower during meditation.
This study advances meditation research in a number of ways. First, the spectral analysis on EEG data supports most but not all existing evidence that alpha and theta
Figure 5EEG phase analysis.Number of pairs of electrodes with higher PLV than the threshold averaged across subjects (N = 34). Star symbols show which comparisons are statistically significant.
EEG power are increased during the meditative state. The increase in beta band power is not as supported in the meditation literature with only a few studies documenting an increase in beta band power during various meditation types [9]. This raises the hypothesis that beta band power
may be more dependent on participant experience with meditation and/or meditation type. The decrease in res-piration rate during meditation is supported by other studies documenting that respiration rates often slows during meditation regardless of whether there is a spe-cific instruction to do so or not. The lower respiration rate, may be due to the theory that meditative state over-laps with a relaxation response even though relaxation is not a directed intention of meditation [44,45]. The slowed respiration rate also provides a mechanism by which meditation reduces stress in healthy adults and multiple chronically ill populations [46,47].
This is also the first reported study to use joint SVM classifier to discriminate between meditation and non-meditation states. We found a joint EEG and respiration SVM classifier had higher accuracy in classification than EEG alone. The SVM classifier is a major step forward for the meditation research field.
There are several limitations in this study. The study used only novice meditators. A future study should include expert meditators also. For this study, in order to deal with the logistics of blinding the person recording the physiological signals, the recording during medita-tion preceded that during the podcast. While a sequence effect cannot be ruled out, in general, the longer the EEG recording the greater the drowsiness, which would not be consistent with the observed differences. Future studies will need to randomize or at least counterbal-ance the order. This study used EEG and respiration only. Future studies would include other physiological signals in the SVM classifier to ascertain the accuracy could be improved.
Conclusion
In conclusion, our study examined EEG and respiration data during a control and meditation condition to evaluate them as potential objective measures of meditation ability. Three types of analyses were conducted: spectral analysis, phase analysis and SVM classification. The EEG spectral data support most, but not all, existing evidence that alpha and theta EEG power are increased during the medita-tive state and respiration rate is lower during meditation. The SVM classifier was an accurate tool for predicting meditation compared to a control state and performed better with the addition of respiration to EEG data. The SVM model with the inclusion of respiration rate and even other physiological measures might improve the classi-fier and could be used in other studies examining shorter time periods to determine the depth/engagement of med-itation within medmed-itation conditions. The classifier could be applied in real-time to assess meditation depth and engagement of meditation. While it may be possible to use the described SVM for real-time monitoring of med-itation state, the definition of medmed-itation state will evolve
as scientists studying it use better objective markers that coarsely relate to it.
Competing interests
The authors declare that they have no competing interests.
Authors’ contributions
AA suggested the design of the analysis, performed the statistical analysis and was the largest contributor to the manuscript. HW assisted in the clinical study design and contributed to the manuscript preparation and editing. HN participated in statistical analysis theorem development and implementation. MM collected all the physiological data analysis and contributed to data acquisition methodology. DE participated in statistical analysis theorem development and supervised the study. BO designed the human study protocol, participated in the analysis, contributed to manuscript preparation and editing, and obtained funding for the study. All authors read and approved the final manuscript.
Acknowledgment
This work was supported in part by National Institute of Health grants K01AT004951 and K24AT005121 and National Science Foundation grants IIS-0914808, CNS-1136027 and IIS-1149570. The authors acknowledge Elena Goodrich for teaching the mindfulness meditation sessions.
Author details
1Cognitive Systems Laboratory, Northeastern University, Boston, MA, USA. 2Department of Neurology, Oregon Health and Science University, Portland, OR, USA.3Departments of Behavioral Neuroscience and Biomedical Engineering, Oregon Health and Science University, Portland, OR, USA.
Received: 24 November 2013 Accepted: 24 April 2014 Published: 14 May 2014
References
1. Barnes PM, Bloom B, Nahin RL:Complementary and alternative medicine use among adults and children: United States, 2007. Natl Health Stat Rep2008,12:1–23.
2. Ospina MB, Bond K, Karkhaneh M, Tjosvold L, Vandermeer B, Liang Y, Bialy L, Hooton N, Buscemi N, Dryden DM, Klassen TP:Meditation practices for health: state of the research.Evid Rep Technol Assess(Full Rep)2007, 155:1–263.
3. Wahbeh H, Elsas SM, Oken B:Mind-body interventions: applications in neurology.Neurology2008,70:2321–2328.
4. Lau MA, Bishop SR, Segal ZV, Buis T, Anderson ND, Carlson L, Shapiro S, Carmody J, Abbey S, Devins G:The Toronto mindfulness scale: development and validation.J Clin Psychol2006,62:1445–1467. 5. Kabat-Zinn J, Lipworth L, Burney R, Sellers W:Four-year follow-up of a
meditation-based program for the self-regulation of chronic pain: treatment outcomes and compliance.Clin J Pain1987,2:159–173. 6. Kabat-Zinn J:An outpatient program in behavioral medicine for
chronic pain patients based on the practice of mindfulness meditation: theoretical considerations and preliminary results. Gen Hosp Psychiatry1982,4:33–47.
7. Speca M, Carlson LE, Goodey E, Angen M:Randomized, wait-list controlled clinical trial: the effect of a mindfulness meditation-based stress reduction program on mood and symptoms of stress in cancer outpatients.Psychosom Med2000,62:613–622.
8. Chiesa A, Serretti A:A systematic review of neurobioogical and clinical features of mindfulness meditations.Psychosom Med2010, 40:1239–1252.
9. Cahn BR, Polich J:Meditation states and traits. EEG, ERP, and neuroimaging studies.Psychol Bull2006,132:180–211.
10. Farb NA, Anderson A, Mayberg H, Bean J, McKeon D, Segal ZV:Minding one’s emotions: mindfulness training alters the neural expression of sadness.Emotion2010,10:25–33.
11. Brefczynski-Lewis JA, Lutz A, Schaefer HS, Levinson DB, Davidson RJ: Neural correlates of attentional expertise in long-term meditation practitioners.Proc Natl Acad Sci U S A2007,104:11483–11488. 12. McCollough A, Hild K, Wahbeh H, Oken B:A machine classification
13. Lachaux J, Rodriguez E, Le van Quyen M, Lutz A, Martinerie J, Varela FJ: Studying single-trials of phase synchronous activity in the brain. Int J Bifurcat Chaos2000,10:2429–2439.
14. Nunez PL, Wingeier BM, Silberstein RB:Spatial-temporal structures of human alpha rhythms: theory, microcurrent sources, multiscale measurements, and global binding of local networks.Hum Brain Mapp2001,13(3):125–164.
15. Baijal S, Srinivasan N:Theta activity and meditative states: spectral changes during concentrative meditation.Cogn Process2010, 11(1):31–38.
16. Travis F, Arenander A:Cross-sectional and longitudinal study of effects of transcendental meditation practice on interhemispheric frontal asymmetry and frontal coherence.Int J Neurosci2006, 116(12):1519–1538.
17. Travis F, Haaga DA, Hagelin J, Tanner M, Arenander A, Nidich S, Gaylord-King C, Grosswald S, Rainforth M, Schneider RH:A
self-referential default brain state: patterns of coherence, power, and eLORETA sources during eyes-closed rest and transcendental meditation practice.Cogn Process2010,11(1):21–30.
18. Lachaux J, Rodriguez E, Martinerie J, Varela F:Measuring phase synchrony in brain signals.Human Brain Mapping1999,8:194–208. 19. Lutz A, Greischar LL, Rawlings NB, Ricard M, Davidson RJ:Long-term
meditators self-induce high-amplitude gamma synchrony during mental practice.Proc Natl Acad Sci U S A2004,101:16369–16373. 20. Hebert R, Lehmann D, Tan G, Travis F, Arenander A:Enhanced EEG alpha
time-domain phase synchrony during Transcendental Meditation: Implications for cortical integration theory.Signal Processing2005, 85:2213–2232.
21. Ditto B, Eclache M, Goldman N:Short-term autonomic and cardiovascular effects of mindfulness body scan meditation.Ann Behav Med2006,32(3):227–234.
22. Wolkove N, Kreisman H, Darragh D, Cohen C, Frank H:Effect of transcendental meditation on breathing and respiratory control. J Appl Physiol1984,56(3):607–612.
23. Jerath R, Edry JW, Barnes VA, Jerath V:Physiology of long pranayamic breathing: neural respiratory elements may provide a mechanism that explains how slow deep breathing shifts the autonomic nervous system.Med Hypotheses2006,67(3):566–571.
24. Cohen S, Karmarck T, Mermelstein R:A global measure of perceived stress.J Health Soc Behav1983,24:385–396.
25. Welsh KA, Breitner JCS, Magruder-Habib KM:Detection of dementia in the elderly using telephone screning of cognitive status. Neuropsychiatry Neuropsychol Behav Neurol1993,6:103–110. 26. Kabat-Zinn J:Full Catastrophe Living: Using the Wisdom of your Body and
Mind to Face Stress, Pain, and Illness. New York: Delacourte Press; 1990. 27. Segal ZV, Williams JMG, Teasdale JD:Mindfulness-Based Cognitive Therapy
for Depression: A New Approach to Preventing Relapse. New York: Guilford; 2002.
28. Wahbeh H, Lane JB, Goodrich E, Miller M:Oken BS:One-on-one mindfulness meditation trainings in a research setting.Mindfulness
2012:1–12.
29. Bell AJ, Sejnowski TJ:An information-maximization approach to blind separation and blind deconvolution.Neural Comput1995,
7(6):1129–1159.
30. Whitham EM, Pope KJ, Fitzgibbon SP, Lewis T, Clark CR, Loveless S, Broberg M, Wallace A, DeLosAngeles D, Lillie P, Hardy A, Fronsko R, Pulbrook A, Willoughby JO:Scalp electrical recording during paralysis: quantitative evidence that EEG frequencies above 20 Hz are contaminated by EMG.Clin Neurophysiol2007,118(8):1877–1888. 31. Proakis JG, Manolakis DG:Digital Signal Processing: Principles, Algorithms,
and Applications, 4th Ed. Prentice Hall: Upper Saddle River; 2007. 32. Harris FJ:On the use of windows for harmonic analysis with the
discrete fourier transform.Proc IEEE1978,66:51–84.
33. Box GEP:Cox DR An analysis of transformations.J Roy Stat Soc B1964, 26(2):211–252.
34. Stockwell RG, Mansinha L, Lowe RP:Localization of the complex spectrum: the S transform.IEEE Trans Signal Process1996, 44(4):998–1001.
35. Bach FR, Jordan MI:Kernel independent component analysis.J Mach Learn Res2002,3:1–48.
36. Cortes C, Vapnik V:Support vector networks.Mach Learn1995, 20:273–297.
37. Chang CC, Lin CJ:LIBSVM: A Library for Support Vector Machines; 2001. [http://www.csie.ntu.edu.tw/cjlin/libsvm]
38. Chan AS, Han YM, Cheung MC:Electroencephalographic (EEG) measurements of mindfulness-based Triarchic body-pathway relaxation technique: a pilot study.Appl Psychophysiol Biofeedback
2008,33(1):39–47.
39. Huang HY, Lo PC:EEG dynamics of experienced Zen meditation practitioners probed by complexity index and spectral measure. J Med Eng Technol2009,33(4):314–321.
40. Lagopoulos J, Xu J, Rasmussen I, Vik A, Malhi GS, Eliassen CF, Arntsen IE, Saether JG, Hollup S, Holen A, Davanger S, Ellingsen Ø:Increased theta and alpha EEG activity during nondirective meditation.J Altern Complement Med2009,15(11):1187–1192.
41. Cahn BR, Delorme A, Polich J:Occipital gamma activation during Vipassana meditation.Cogn Process2010,11(1):39–56.
42. Dunn BR, Hartigan JA, Mikulas WL:Concentration and mindfulness meditations: unique forms of consciousness?Appl Psychophysiol Biofeedback1999,24(3):147–165.
43. Oken B, Zajdel D, Wild H:Induced and trait differences in EEG phase synchrony and power for experienced meditators versus non-meditators; 2007.
44. Benson H:The Relaxation Response. New York: Morrow; 1976. 45. Lazar SW, Bush G, Gollub RL, Fricchione GL, Khalsa G, Benson H:
Functional brain mapping of the relaxation response and meditation.Neuroreport2000,11:1–5.
46. Grossman P, Niemann L, Schmidt S, Walach H:Mindfulness-based stress reduction and health benefits. A meta-analysis.J Psychosom Res2004,57(1):35–43.
47. Chiesa A, Serretti A:Mindfulness-based stress reduction for stress management in healthy people: a review and meta-analysis.J Altern Complement Med2009,15(5):593–600.
doi:10.1186/1743-0003-11-87
Cite this article as:Ahaniet al.:Quantitative change of EEG and respiration signals during mindfulness meditation.Journal of NeuroEngineering and Rehabilitation201411:87.
Submit your next manuscript to BioMed Central and take full advantage of:
• Convenient online submission
• Thorough peer review
• No space constraints or color figure charges
• Immediate publication on acceptance
• Inclusion in PubMed, CAS, Scopus and Google Scholar
• Research which is freely available for redistribution