R E S E A R C H
Open Access
Prognostic implications and interaction of
L1 methylation and p53 expression statuses
in advanced gastric cancer
Yun-Joo Shin
1,2†, Younghoon Kim
1,3†, Xianyu Wen
1,3, Nam-Yun Cho
1,2, Sun Lee
4, Woo Ho Kim
3and
Gyeong Hoon Kang
1,3*Abstract
Background:TP53is frequently mutated across various tissue types of cancers. In normal cells, long interspersed nuclear element-1 (LINE-1, L1) is mostly repressed by DNA methylation in its 5′untranslated region but is activated by DNA demethylation process during tumorigenesis. p53 is indispensable for maintaining genomic stability and plays its role in controlling genomic stability by repressing retrotransposon activity. However, it is unclear whether p53 regulates expression or methylation of L1 differently depending on the mutational status ofTP53. Four hundred ninety cases of advanced gastric cancer (AGC) were analyzed for their statuses in p53 expression and L1 methylation using immunohistochemistry and pyrosequencing, respectively. Whether L1 methylation and expression statuses were differently affected by types ofTP53 mutants was analyzed in gastric cancer cell line.
Results:By p53 immunohistochemistry, tumors were classified into 4 groups according to the intensity and extent of stained tumor nuclei. L1 methylation level was significantly higher in p53 expression group 1 than in the other groups in which L1 methylation level was similar (P< 0.001). Although L1 methylation and p53 expression statuses were associated with patient survival, multivariate analysis revealed that L1 methylation was an independent prognostic parameter. In in vitro analysis of AGS cells with the introduction of wild type or mutant types ofTP53, L1 methylation level and activity were different depending on types ofTP53mutation.
Conclusions:Findings suggest that L1 methylation level is affected byTP53mutation status; although, L1 methylation status was an independent prognostic parameter in patients with AGC. Further study is required to elucidate the mechanism of how wild type or mutant p53 affects L1 activity and methylation status of L1 CpG island.
Keywords: LINE-1, Methylation,TP53, Prognosis, Gastric cancer
Background
Gastric cancer is the fifth most common malignant tumor and the third leading cause of cancer-related death worldwide. Despite advances in technology, the diagnosis and treatment of gastric cancer still remains a
challenge [1]. The current TNM staging serves well for
the selection of treatment and assessment of prognosis. However, survival time varies in patients with advanced
gastric cancer (AGC) within the same stage, which indi-cates that the current TNM staging system is not sufficient for the prognosis estimation. Development of prognostic biomarkers might ameliorate the prognostication power of the current staging system.
Long interspersed nuclear element-1 (LINE-1, L1) is a retrotransposon which is repeated a half million times in an interspersed manner and comprises about 17% of the human genome. Promoter CpG island hypermethylation is an important mechanism for the suppression of gene expression and retrotransposon activity. Cancer cells tend to undergo diffuse hypomethylation which leads to the increased activity of L1 retrotransposon [2,3]. Hypo-methylation of L1 may contribute to genomic instability
© The Author(s). 2019Open Access This article is distributed under the terms of the Creative Commons Attribution 4.0 International License (http://creativecommons.org/licenses/by/4.0/), which permits unrestricted use, distribution, and reproduction in any medium, provided you give appropriate credit to the original author(s) and the source, provide a link to the Creative Commons license, and indicate if changes were made. The Creative Commons Public Domain Dedication waiver (http://creativecommons.org/publicdomain/zero/1.0/) applies to the data made available in this article, unless otherwise stated. * Correspondence:[email protected]
†Yun-Joo Shin and Younghoon Kim contributed equally to this work.
1
Laboratory of Epigenetics, Cancer Research Institute, Seoul National University College of Medicine, Seoul, South Korea
3Department of Pathology, Seoul National University College of Medicine,
103 Daehak-ro, Chongo-gu, Seoul 03080, South Korea
and tumorigenesis [4]. DNA hypomethylation in the 5′ untranslated region of L1 repeats has been demonstrated to be closely associated with worse recurrence-free survival and overall survival in patients with gastric cancer [5].
Somatic mutation of theTP53 gene is one of the most
frequent alterations in human cancer [6]. Overall, 50%
of human cancers containsTP53mutation, and negative
regulators of p53, MDM2 and MDM4, are frequently
increased in remnant cases [7]. In most cases of TP53
mutation, a single amino acid is substituted in the DNA binding domain, which leads to loss of function despite the protein length being intact [8, 9]. “Loss of function”
mutation inTP53 means loss of function in the
regula-tion of cell cycle checkpoint and inducregula-tion of apoptosis by its protein p53 [10]. In spite of the fact that TP53 is largely accepted as a tumor suppressor gene, oncogenic effect of mutant p53 proteins, including deregulated metabolic pathway, increased tumor invasion, and en-hanced chemotherapy resistance, has also been reported, indicating a gain of function role for mutant p53 [10–13]. One of the mechanisms involving gain of function in
TP53mutation includes upregulation of epigenetic genes,
especially genes that serve as histone methyltransferases and acetyltransferases, via binding to the transcription factor. A recent study by Zhu et al. has demonstrated that MLL1, MLL2, and MOZ were upregulated in human
tumor samples withTP53gain of function mutations, but
not whenTP53was wild type or null status [9]. However,
the effect of p53 in other epigenetic regulators, including the promoter methylation status of L1, is still elusive.
To date, it is well established that L1 is hypomethy-lated in many tissue types of cancer and causes genomic instability. Also, p53 acts as a guardian against transpo-sopathy, which maintains genomic stability of the cell by
restraining transposable element such as L1 [14].
How-ever, the correlation between L1 methylation and p53 expression statuses is largely unknown in human gastric cancer. Also, it is unclear whether the difference in
mu-tational status of TP53 affects L1 expression or not. In
the present study, we investigated the correlation be-tween p53 expression and L1 methylation statuses to determine whether expression status or mutational
sta-tus ofTP53influences expression and methylation status
of L1 in gastric cancer tissues or cell lines.
Results
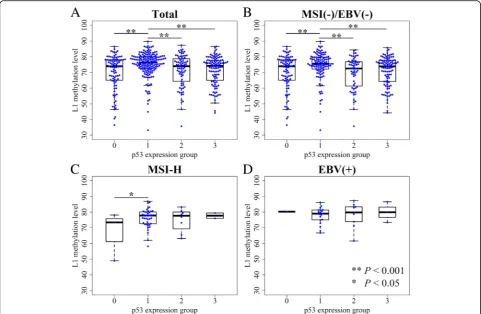
L1 methylation level and p53 expression statuses in AGC p53 expression was categorized into four groups accord-ing to the overall intensity of nuclear stainaccord-ing of tumor cells and the extent of stained cells. When we compared L1 methylation levels among four p53 expression groups, significant differences were noted in L1
methyla-tion levels among four subgroups (P < 0.001, ANOVA)
(Figure1a). p53 expression group 1 showed a significantly higher level of L1 methylation than that of the other three groups which exhibited similar levels of L1 methylation. Microsatellite instability (MSI)-negative, Epstein–Barr virus (EBV)-negative AGCs also had similar results, as group 1
showed the highest L1 methylation level (Fig. 1b). In
MSI-high (MSI-H) and EBV-positive AGC populations, however, a relatively small number of samples for each group undermined the correlation between p53 expression status and L1 methylation level (Fig.1c & d).
Correlation between L1 methylation level, p53 expression status, and clinicopathological characteristics
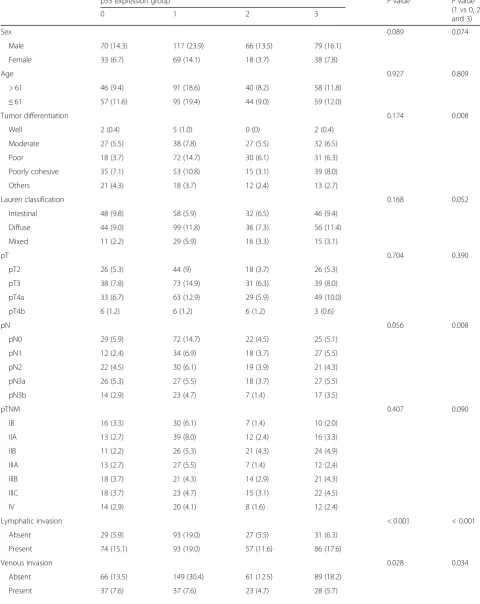
L1 methylation level was significantly associated with various clinicopathological features as we have previ-ously reported (Additional file 1: Figure S1) [5, 15]. Sig-nificantly correlated variables include age, sex, lymphatic
invasion, venous invasion, Lauren’s classification, pN
stage, tumor differentiation, molecular phenotypes, and MSI-H and EBV-positive AGCs. L1 methylation level was 77.3, 73.9, and 71.0% in EBV-positive, MSI-H, and EBV-negative/MSI-negative AGCs, respectively. A sig-nificant difference was noted in L1 methylation levels between MSI-H and MSI-negative/EBV-negative AGCs
(P < 0.001, Student t test) and between EBV-positive
and MSI-H AGCs (P < 0.001, Student t test).
Correl-ation between p53 expression and clinicopathological characteristics was measured with two different
classifi-cation schemes (Table 1). When associations between
p53 expression subgroups and clinicopathological fea-tures were analyzed, significant associations were found in lymphatic invasion, venous invasion, and MSI and EBV status (P< 0.05). Since p53 expression group 1 was contrasted with the other expression groups in terms of L1 methylation level, we compared clinicopathological features between group 1 and the other three groups (group 0, 2, and 3). Group 1 was associated with poor tumor differentiation (P< 0.05) but had less lymph node
metastasis compared with the other three groups (P=
0.008). Moreover, local invasions including lymphatic in-vasion and venous inin-vasion were much less frequent in
group 1 (P< 0.001 and P= 0.034, respectively). MSI-H
and EBV-positive subtypes were more frequently ob-served in group 1 than in all other groups combined (P< 0.001 and P= 0.005, respectively).
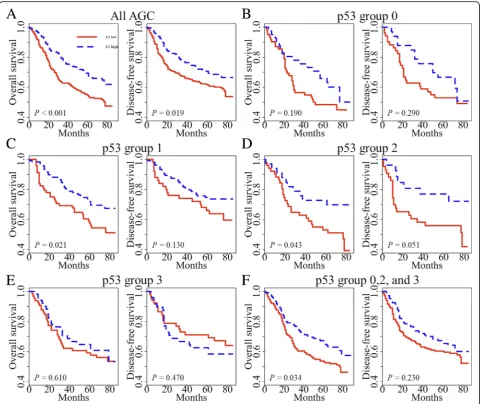
Survival analysis
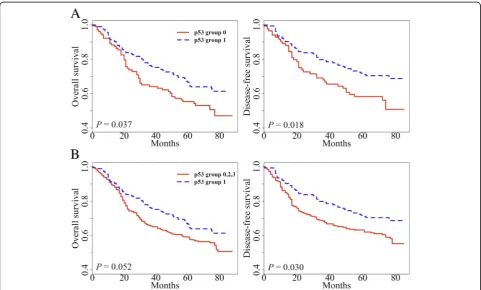
In previous studies [5, 15], we have found that tumoral
previously described [15]. In univariate survival analysis, p53 group 1 showed prolonged overall survival (OS) and disease-free survival (DFS) when compared with
the respective one of p53 group 0 (P= 0.037 and P=
0.018, respectively; Fig. 2a). When p53 group 1 was
compared with all other groups combined, p53 group 1 exhibited marginally better OS than all other p53
groups (P= 0.052, Fig. 2b). p53 group 1 also had a
fa-vorable prognosis for DFS compared with all other p53
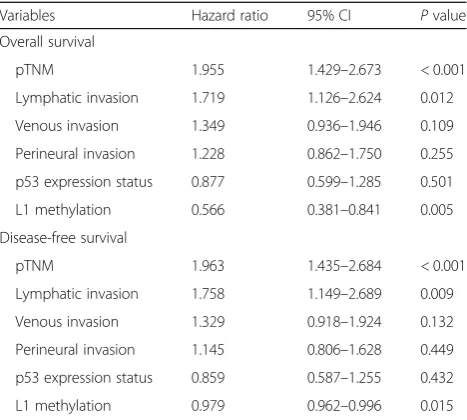
groups (P= 0.030). Multivariate analysis reveals that L1
methylation level, lymphatic invasion, and pTNM stage were independent prognostic factors in OS and DFS. On the other hand, p53 expression status was not a prognostic factor when adjusted for pTNM stage, lymphatic invasion, venous invasion, perineural
inva-sion, and L1 methylation level (Table 2). Also, we
ana-lyzed patient survival according to L1 methylation
status in each p53 subset (Fig. 3). These findings
con-firmed that L1 methylation level was a superior prog-nostic marker in AGC. However, we clearly identified the potential interaction between p53 expression and
L1 methylation (Fig. 1). From these findings, we
de-cided to investigate the interaction of p53 expression and L1 methylation in vitro.
In vitro study demonstrating variation of L1 methylation level according to p53 mutation status
Gastric cancer cell line AGS was found to be wild type
TP53alleles (http://www.cbioportal.org). AGS cells were
transfected with pLRE3-mEGFP1 (wild type L1 plasmid)
and then knocked down with TP53 shRNA to generate
cell status comparable to null mutation ofTP53in terms
of p53 expression status.TP53-knocked down AGS cells
were stably transfected with wild type TP53 or mutant
type TP53 (V143A, R175H, and R249S) (Additional
file 2: Figure S2). We assessed L1 activity by
evalu-ation of EGFP expression since it is difficult to detect ORF proteins of L1 due to its unconventional translation
mechanism [16,17]. Therefore, EGFP expression was
con-sidered as a surrogate for L1 expression (Fig. 4). More
EGFP-positive cells were observed in AGS cells
trans-fected with mutantTP53 R175H cells than in AGS cells
transfected with mutant TP53 V143A or R249S, which
was confirmed by western blot of EGFP protein.
Discussion
In our previous studies, L1 methylation level was found to be a reliable independent prognostic biomarker in which a low methylation status was associated with worse clinical
Table 1p53 expression status and its association with clinicopathological features
p53 expression group Pvalue Pvalue
(1 vs 0, 2, and 3)
0 1 2 3
Sex 0.089 0.074
Male 70 (14.3) 117 (23.9) 66 (13.5) 79 (16.1)
Female 33 (6.7) 69 (14.1) 18 (3.7) 38 (7.8)
Age 0.927 0.809
> 61 46 (9.4) 91 (18.6) 40 (8.2) 58 (11.8)
≤61 57 (11.6) 95 (19.4) 44 (9.0) 59 (12.0)
Tumor differentiation 0.174 0.008
Well 2 (0.4) 5 (1.0) 0 (0) 2 (0.4)
Moderate 27 (5.5) 38 (7.8) 27 (5.5) 32 (6.5)
Poor 18 (3.7) 72 (14.7) 30 (6.1) 31 (6.3)
Poorly cohesive 35 (7.1) 53 (10.8) 15 (3.1) 39 (8.0)
Others 21 (4.3) 18 (3.7) 12 (2.4) 13 (2.7)
Lauren classification 0.168 0.052
Intestinal 48 (9.8) 58 (5.9) 32 (6.5) 46 (9.4)
Diffuse 44 (9.0) 99 (11.8) 36 (7.3) 56 (11.4)
Mixed 11 (2.2) 29 (5.9) 16 (3.3) 15 (3.1)
pT 0.704 0.390
pT2 26 (5.3) 44 (9) 18 (3.7) 26 (5.3)
pT3 38 (7.8) 73 (14.9) 31 (6.3) 39 (8.0)
pT4a 33 (6.7) 63 (12.9) 29 (5.9) 49 (10.0)
pT4b 6 (1.2) 6 (1.2) 6 (1.2) 3 (0.6)
pN 0.056 0.008
pN0 29 (5.9) 72 (14.7) 22 (4.5) 25 (5.1)
pN1 12 (2.4) 34 (6.9) 18 (3.7) 27 (5.5)
pN2 22 (4.5) 30 (6.1) 19 (3.9) 21 (4.3)
pN3a 26 (5.3) 27 (5.5) 18 (3.7) 27 (5.5)
pN3b 14 (2.9) 23 (4.7) 7 (1.4) 17 (3.5)
pTNM 0.407 0.090
IB 16 (3.3) 30 (6.1) 7 (1.4) 10 (2.0)
IIA 13 (2.7) 39 (8.0) 12 (2.4) 16 (3.3)
IIB 11 (2.2) 26 (5.3) 21 (4.3) 24 (4.9)
IIIA 13 (2.7) 27 (5.5) 7 (1.4) 12 (2.4)
IIIB 18 (3.7) 21 (4.3) 14 (2.9) 21 (4.3)
IIIC 18 (3.7) 23 (4.7) 15 (3.1) 22 (4.5)
IV 14 (2.9) 20 (4.1) 8 (1.6) 12 (2.4)
Lymphatic invasion < 0.001 < 0.001
Absent 29 (5.9) 93 (19.0) 27 (5.5) 31 (6.3)
Present 74 (15.1) 93 (19.0) 57 (11.6) 86 (17.6)
Venous invasion 0.028 0.034
Absent 66 (13.5) 149 (30.4) 61 (12.5) 89 (18.2)
outcome of AGC patients (17, 18). In our current investi-gation, L1 methylation level was different among p53 expression groups which were also associated with OS and DFS. Despite a strong correlation between L1 methy-lation level and p53 expression status, tumoral L1 hypo-methylation was found to be an independent prognostic parameter in a multivariate analysis incorporating p53
expression status as a covariate. However, p53 expression status no longer maintained its prognostic implication in multivariate analysis. Although tumoral L1 hypomethyla-tion was a prognostic parameter, L1 methylahypomethyla-tion status did not show any prognostic difference of survival in pa-tients with AGC of p53 expression group 3. This finding indicates that application of L1 methylation status as a Table 1p53 expression status and its association with clinicopathological features(Continued)
p53 expression group Pvalue Pvalue
(1 vs 0, 2, and 3)
0 1 2 3
Perineural invasion 0.051 0.305
Absent 56 (11.4) 78 (15.9) 42 (8.6) 44 (9.0)
Present 47 (9.6) 108 (2.0) 42 (8.6) 73 (14.9)
MSI < 0.001 < 0.001
Stable 86 (17.6) 128 (2.4) 71 (14.5) 98 (20.0)
Low 14 (2.9) 13 (2.7) 5 (1.0) 16 (3.3)
High 3 (0.6) 45 (9.2) 8 (1.6) 3 (0.6)
EBV < 0.001 < 0.001
Absent 102 (20.8) 164 (33.5) 74 (15.1) 114 (23.3)
Present 1 (0.2) 22 (4.5) 10 (2.0) 3 (0.6)
Percentages in parenthesis
MSImicrosatellite instability,EBVEpstein–Barr virus
prognostic biomarker needs to be accompanied with p53 immunohistochemistry.
In the present study, we did not perform sequencing
analysis of TP53mutation and instead used p53
expres-sion status (determined by immunohistochemistry) as
sur-rogates for TP53mutation status. In a previous study in
which we analyzed colorectal cancer tissue for theirTP53
mutation and expression statuses using next-generation sequencing and immunohistochemistry, respectively, and correlated them, we found that p53 expression groups
differed significantly in the frequency and type of TP53
mutations; nonsynonymous single-nucleotide variant rate was 80%, 12%, and 2% in p53 group 3, 2, and 1, respect-ively, whereas p53 group 0 was featured with stop-gain
mutations (38%) and indels (15%) [18]. Through the
grouping of p53 immunohistochemistry, it was possible to predict what percentage of variants are likely to be and what kind of mutation will be present, but it is not correct to predict that group 1 has no mutation or group 0 does not have wild type. Other researchers also have reported that a strong correlation exists between gene mutation and p53 expression group [19,20]. Therefore, we deduced that the immunohistochemical status of p53 is a represen-tative of its mutation status. However, limitation of the utilization as p53 expression status as surrogates for TP53 mutation status is as follows: with immunohistochemical finding, it cannot be predicted whether TP53 is wild type or mutated, but the probability of mutation can be pre-dicted based on grouping of p53 expression.
In our study, three expression vectors encoding DNA-binding domain p53 mutants (V143A, R175H, and R249S) were transfected to explore whether p53 mutants differentially influence L1 activity and methylation. L1-transfected AGS cells showed different L1 activity
and methylation level depending on the type of p53 mu-tants. Mutant p53 R175H and R249S are among the p53 hotspot mutants and these arginine residues (Arg-175 and Arg-249) play a role in maintaining the structural
integrity of the DNA binding surface [21]. Although
mu-tant p53 V143A is not one of the p53 hotspot mumu-tants, valine residue (Val-143) is located in the hydrophobic core of the beta-sandwich region and V143A mutant leads to destabilization of the three-dimensional structure and temperature sensitivity of p53 binding to many
re-sponse elements [21]. Furthermore, mutant p53 R175H
and R249S are known to lose their DNA binding affinity toGADD45DNA, whereas mutant p53 V143A retains its
binding affinity to GADD45 DNA [22]. In the present
study, mutant p53 R175H shows higher L1 activity and lower L1 methylation level compared with other mutant p53 V143A and R249S.
In the present study, we found that tumoral L1 hypo-methylation did not have prognostic implications in patients with gastric cancer of p53 group 3. This finding suggests that endogenous factors of tumor cells might have an influence on prognostic implications of tumoral L1 hypomethylation and that p53 immunohistochemis-try is required for the application of L1 methylation status as a prognostic parameter in AGC. Besides gastric cancer, several tissue types of human cancer have shown the association between tumoral L1 hypomethylation and shortened survival time of patients, including esopha-geal squamous cell carcinoma, lung cancer, colorectal
cancer, and intrahepatic cholangiocarcinoma [23–27].
These tissue types of human cancer are known to have a
high frequency ofTP53mutation. However, limited
infor-mation is available regarding the interaction of TP53 in
the relationship between tumoral L1 hypomethylation and shortened survival time of tumor patients. Although
Morikawa et al.’s study has demonstrated a difference of
L1 methylation level between CRCs of p53 group 0 and 1 and CRCs of group 2 and 3, multivariate analysis did not reveal such a relationship [28]. Morikawa et al.’s study did not separate CRCs of p53 group 0 and group 1 and in-stead grouped together into a p53-negative group, which might underestimate the relationship between L1 methy-lation level and p53 expression group. Nevertheless, L1 methylation and p53 expression statuses were found to be independently associated with colorectal cancer outcome. However, in the present study, p53 expression status was not an independent prognostic factor in patients with AGC, while L1 methylation status was an independent prognostic parameter.
In a previous study in which Kawakami et al. ana-lyzed microsatellite-stable and CpG island methylator
phenotype-negative colorectal cancers (n = 131) for
their L1 methylation status and investigated the influence of adjuvant fluopyrimidines on the prognostic value of L1
Table 2Multivariate survival analysis
Variables Hazard ratio 95% CI Pvalue
Overall survival
pTNM 1.955 1.429–2.673 < 0.001
Lymphatic invasion 1.719 1.126–2.624 0.012
Venous invasion 1.349 0.936–1.946 0.109
Perineural invasion 1.228 0.862–1.750 0.255
p53 expression status 0.877 0.599–1.285 0.501
L1 methylation 0.566 0.381–0.841 0.005
Disease-free survival
pTNM 1.963 1.435–2.684 < 0.001
Lymphatic invasion 1.758 1.149–2.689 0.009
Venous invasion 1.329 0.918–1.924 0.132
Perineural invasion 1.145 0.806–1.628 0.449
p53 expression status 0.859 0.587–1.255 0.432
methylation status [29], CRC patients with low L1 methy-lation status who were treated with adjuvant fluoropyrimi-dines showed better survival than that of patients with low methylation status, treated with surgery alone. Such a survival benefit from adjuvant fluoropyrimidines was not found for CRC patients with high L1 methylation status. Thus, a question might be raised upon whether adjuvant chemotherapy might exert an influence on the prognostic value of L1 methylation status in AGC patients of the present study. When OS and DFS were analyzed for their associations with L1 methylation status in four p53 ex-pression groups, the tendency of low L1 methylation status toward worse survival was observed in groups 0, 1, and 2 regardless of whether the patients received adjuvant
chemotherapy or not (Additional file3: Figure S3). These
results suggest that adjuvant chemotherapy might not in-fluence the prognostic value of L1 methylation status in patients with AGC. For group 3, L1 methylation status was not associated with survival in patients treated with adjuvant chemotherapy or surgery alone.
Conclusions
Taken together, we have found thatTP53mutation status
affects L1 methylation level and retrotransposon activity in tumor cells and that L1 methylation level was different in AGCs according to p53 expression status. Our findings suggest that application of tumoral L1 hypomethylation as a prognostic parameter to gastric cancer should be accom-panied by p53 immunohistochemistry although tumoral
L1 hypomethylation was an independent prognostic par-ameter heralding poor prognosis.
Methods
Patient and tissue specimens
Four hundred ninety formalin-fixed paraffin-embedded (FFPE) samples of AGC, defined by gastric cancer with the invasive depth of at least the muscularis propria
(pT2–pT4 according to the 7th cancer staging system of
the American Joint Committee on Cancer), were col-lected from the pathological archive of Seoul National University Hospital. All samples were selected from patients who received resection of AGC between January 2007 and December 2008. Clinical data were obtained from the electronic medical record retrospectively. The age of patients ranged from 23 to 86 (mean age of 61). Male to female ratio was 2.10:1. This study was approved by the Institutional Review Board of Seoul National University Hospital, which waived the requirements to obtain informed patient consent.
Detection of molecular subtypes
All AGC samples were tested for MSI and EBV infection.
For MSI status, 5-marker scoring panel (BAT25, BAT26,
D2S123, D5S345, and D17250) was applied. MSI-H was defined when instability was detected in greater than or equal to 40% of markers. Other cases were categorized as MSI-negative. EBV-positive AGC was detected via in situ
hybridization with RNAscope FFPE assay kit (# 300039,
ACDbio Inc., Hayward, CA, USA) that targetEBER1.
Extraction of genomic DNA from archival tissue samples FFPE blocks containing each patient sample were cut with 10-μm thickness and attached to glass slides. Slides were soaked into xylene followed by air dry. Tumor areas of each slide were traced from tumor areas marked from its H&E counterpart and microdissected with a
razor blade into 50μL of lysis buffer including 10%
pro-teinase K (P4850, Sigma-Aldrich, St. Louis, MO, USA). Dissected tissues were incubated at 56 °C for at least 24 h. Proteinase K was inactivated by heat block at 95 °C for 30 min.
Tissue microarray (TMA) and immunohistochemistry Through microscopic examination, representative areas that contain a considerable amount of tumor were se-lected and core tissues (2 mm in diameter) were extracted for each AGC FFPE sample and constructed into TMA blocks. For immunohistochemical staining, sections of TMA were immunostained after antigen retrieval. Primary antibody for anti-p53 (clone DO-7, DAKO, Santa Barbara, CA, USA) was stained at a concentration of 1:1000. The proportion of tumor cells with moderate/strong nuclear
staining for TP53 was estimated by light microscopic
examination of two tissue cores (2 mm in diameter) for each patient sample. Tumors were defined as p53 group 3
Fig. 4L1 expression level and methylation level inTP53-transfected AGS gastric cancer cell line.aGreen fluorescence protein observed by fluorescence microscope fromTP53-transfected AGS (scale bar 100μm).bEGFP protein expression levels fromTP53-transfected AGS.c
and 2 when > 90% and 90–50% of tumor cells showed moderate/strong nuclear staining, respectively. p53 group 1 denoted samples with moderate/strong nuclear staining in less than 50% of tumor cells or samples with weak nu-clear staining. p53 negativity (p53 group 0) was defined as no staining of tumor cells which was contrasted with weak nuclear staining of interstitial lymphocytes (Additional file 4: Figure S4).
Cell culture and growth media
The human gastric cancer cell line AGS was purchased from Korean Cell Line Bank (KCLB# 21739, Korean Cell Line Bank, Seoul, Korea) and was grown in RPMI-1640
(LM 011–01, Welgene Co., Daegu, Korea) supplemented
with 10% heat-inactivated FBS (Fetal bovine serum)
(26140–079, Gibco, Grand Island, NY, USA), 100 U/ml
penicillin, and 100μg/ml streptomycin (15070–063, Gibco).
Plasmid DNA used in transfection assay
Plasmids encoding wild type TP53 (#16434, Addgene,
Watertown, MA, USA) and mutant typeTP53 (V143A,
R175H, and R249S) (#16435, #16436, and #16438, Addgene) under the control of the CMV promoter were purchased from Addgene. The pLRE3-mEGFP1 (mono-meric enhanced green fluorescent protein) plasmid, encod-ing a retrotransposition-competent L1, and pJM111-LRE3-mEGFP1, encoding a retrotransposition-defective L1, were generous gifts from Dr. Moran (University of Michigan Medical school). pCMV6-Entry (PS100001, ORIGENE, Rockville, MD, USA) (that includes G418-resistance gene) plasmid was used as a control DNA. Schematic diagram of the pLRE3-mEGFP1 construct and rationale of the L1-retrotransposition assay is depicted in Additional file 5: Figure S5.
p53 knockdown using shRNA lentiviral plasmid
Plasmids expressing control shRNA (short hairpin RNA)
(#H1(shRNA-Ctr)-RB) and shRNA against humanTP53
(#LVP343-RB) were purchased from GenTarget Inc. (San Diego, CA, USA). The plasmid contains RFP (Red Fluor-escence Protein)-Bsd (Blasticidin) dual selection marker (15,205, Sigma-Aldrich). AGS cells were transduced with pre-made lentiviral plasmid containing control shRNA
and TP53 shRNA. Three days after transduction, cells
were incubated with RPMI-1640 complete medium
con-taining 6μg/ml blasticidin (RPMI-Bsd). For generating
cells stably expressing control shRNA andTP53shRNA,
single cells expressing RFP were sorted by BD FACS (Fluorescence-activated cell sorter) Aria II into individ-ual wells of 96-well plates. Several single colonies were screened by light microscope, selected, and transferred to individual wells in 48-well dishes and expanded in
RPMI-Bsd media. Stable knockdown ofTP53expression
was confirmed by western blot.
Generation of stable cell line (transfection and selection of cells)
AGS cells were transfected with the pLRE3-mEGFP1 and pJM111-LRE3-mEGFP1 construct by electropor-ation (Nepa Gene Co., Ichikawa city, Japan) and selected for puromycin-resistant cells by growth in RPMI-1640
complete medium containing 0.3μg/ml puromycin
(RPMI-Puro) (P8833, Sigma-Aldrich). After complete antibiotic selection, the cells were trypsinized and plated at low density in 6-well plates. EGFP-expressing clones were observed by fluorescence microscopy. Several fluor-escent colonies were selected, transferred to individual wells in 6-well dishes, and expanded in RPMI-Puro. AGS cells stably expressing L1 were transduced with a lentiviral
plasmid expressing TP53 shRNA and single cells were
sorted by BD FACS (Fluorescence-activated cell sorter)
Aria II. Wild type and three types of mutant TP53were
then transfected into AGS stably expressing L1 and p53 shRNA. G418 (A1720, Sigma-Aldrich) selection and con-firmation of transfection were done as described above. The colonies were screened for their presence by western blot analysis.
Western blot analysis
Cells were lysed with RIPA buffer supplemented with protease inhibitor cocktail (11,836,153,001, Complete Mini, Roche, Mannheim, Germany) and phosphatase in-hibitor cocktail (04906845001, PhosSTOP EASYpack, Roche). Cell debris were then removed by centrifugation at 4 °C. After centrifugation, protein concentrations were measured with Pierce BCA Protein Assay Kit (23,225, Thermo Fisher Scientific, Rockford, IL, USA). For western blotting, 30μg of protein lysates from each established cell line were separated by 8~10% SDS-polyacrylamide gel electrophoresis (PAGE), transferred onto nitrocellulose membranes (IPVH00010, Millipore, Bedford, MA, USA), blocked at room temperature for 1 h with 5% skim milk, and incubated at 4 °C overnight with the following primary antibodies: p53 (1:1000, sc-126, Santa Cruz
Biotechnology, CA, USA), β-actin (1:1000, sc-47,778,
Santa Cruz Biotechnology), and EGFP (1:1000, ab184601, Abcam, Cambridge, UK). After three 15-min washes with Tris-buffered saline containing 0.1% Tween 20, the blots were incubated at room temperature for 1 h with horse-radish peroxidase-conjugated secondary antibody: goat
anti-Mouse IgG(H+L)-HRP (1:4000, #SA001–500,
Gen-DEPOT, Barker, TX, USA). Proteins were detected using chemiluminescent reagent, ECL solution (#W6002, Biose-sang, Gyeonggi, Korea).
DNA preparation and bisulfite conversion
Genomic DNA was extracted from cell lines using the QIAamp DNA mini kit (51,306, Qiagen, Hilden, Germany).
with 15 U of HindIII (1060A, Takara Shuzo Co., Kyoto, Japan) for 1 h at 37 °C prior to bisulfite modification. Bisulfite modification was performed using the Zymo EZ DNA methylation Kit (D5002, Zymo Research, Irvine, CA, USA) with 500 ng of digested genomic DNA accord-ing to the manufacturer’s protocol.
MethyLight assay and pyrosequencing methylation assay After bisulfite modification, Alu-based MethyLight con-trol reaction, a CpG-independent and bisulfite-specific control reaction, was performed to measure input DNA
(bisulfite-modified DNA) [30]. We determined the
thresh-old cycle (C(t) value) of this reaction in which the Alu reaction fluorescence was detected. To keep the C(t) value of bisulfite-modified DNA samples in the range of 18 to 20, distilled water was added to dilute bisulfite-modified DNA samples with C(t) values lower than 18. The sodium bisulfite-modified DNA samples were amplified with the same oligonucleotide primers which were designed against a consensus L1 sequence by the Issa group for
pyrose-quencing [31]. Pyrosequencing methylation assay was
performed as described previously [32].
Statistical analysis
All statistical analysis was performed by R (version 3.5.1). The correlation between categorical variables was performed with chi-square test when all categories were more than 5. If at least one category was equal to or less than 5, Fisher exact test was applied. Correlation between continuous variables and two categories were measured
by Studentt test. ANOVA was performed between
vari-ables that included more than two categories. Mann–
Whitney U test (Wilcoxon rank-sum test) was applied when the relationship between continuous variables and variables with more than two categories was measured.
Univariate survival was determined by Kaplan–Meier
curve with a log-rank test. To calculate multivariate sur-vival, Cox regression model was applied.Pvalue of < 0.05 was considered as significant.
Additional files
Additional file 1:Figure S1.Forest plot displaying relationships between L1 methylation level and clinicopathological characteristics. (TIF 400 kb)
Additional file 2:Figure S2.Evaluation of transfection by western blot analysis. p53 protein expression level in AGS transfected with wild type or mutant types ofTP53by western blot. (TIF 324 kb)
Additional file 3:Figure S3.Comparative analyses of overall survival and disease-free survival in four p53 expression groups of gastric cancers according to L1 methylation status with separation into adjuvant chemotherapy-treated and nontreated groups. (TIF 4730 kb)
Additional file 4:FigureS4.Classification of p53 expression status by immunohistochemical staining. (A) p53 negativity (group 0). (B) Moderate/strong nuclear staining in less than 50% of tumor cells or samples with weak nuclear staining (group 1). (C) 90–50% of tumor cells
showed moderate/strong nuclear staining (group 2). (D) > 90% of tumor cells showed moderate/strong nuclear staining (group 3). (TIF 4060 kb)
Additional file 5:Figure S5.Schematic diagram of the pLRE3-mEGFP1 construct (left) and rationale of the L1-retrotransposition assay (right). The EGFP retrotransposition reporter cassette is cloned into the 3′UTR of L1 in the antisense orientation. The cassette consists of the CMV promoter (pCMV), the TK poly(A) signal (pA) and the EGFP gene interrupted by a sense orientation intron (intron) with the splice donor (SD) and splice acceptor (SA). (TIF 335 kb)
Abbreviations
AGC:Advanced gastric cancer; DFS: Disease-free survival; EBV: Epstein–Barr virus; FFPE: Formalin-fixed paraffin embedded; L1: Long interspersed nuclear element-1 (LINE-1); MSI: Microsatellite instability; OS: Overall survival; TMA: Tissue microarray
Acknowledgements
Not applicable.
Funding
This work was supported by a grant from the National Research Foundation (NRF) funded by the Korean Ministry of Science, ICT and Future Planning (2016M3A9B6026921), and a grant from the Korea Health Technology R&D Project through the Korea Health Industry Development Institute funded by the Korean Ministry of Health and Welfare (HI14C1277).
Availability of data and materials
The protocols are detailed in the manuscript for scientists wishing to use them for their research work. Also, the supporting data will be made available to editors and peer-reviewers, if required for the purposes of evaluating the manuscript.
Authors’contributions
GHK conceived the idea and designed the experiments in-depth. YJS, WX, NYC, SL, and YK performed the experiments. WHK maintained and provided tissue sam-ples and related clinical data. YK and GHK analyzed the data. YJS and YK contrib-uted to generation of the figures and tables. YJS, YK, and GHK wrote the paper. The paper was critically read by all the authors and approved for publication.
Ethics approval and consent to participate
The animal study plan and protocol were approved by the Biomedical Research Institute of Seoul National University Hospital (15–0111-C1A0). The human study protocol was reviewed and approved by the institutional review board of Seoul National University Hospital (1312–051-542). Informed consent was exempted because of the retrospective nature of the study and minimal risk of harm to the study subjects. This study was performed in accordance with the recommendations of the Declaration of Helsinki (2013) for biomedical research involving human subjects.
Consent for publication
Not applicable.
Competing interests
The authors declare that they have no competing interests.
Publisher’s Note
Springer Nature remains neutral with regard to jurisdictional claims in published maps and institutional affiliations.
Author details
1Laboratory of Epigenetics, Cancer Research Institute, Seoul National
University College of Medicine, Seoul, South Korea.2Department of Cancer
Biology, Cancer Research Institute, Seoul National University College of Medicine, Seoul, South Korea.3Department of Pathology, Seoul National University College of Medicine, 103 Daehak-ro, Chongo-gu, Seoul 03080, South Korea.4Department of Pathology, College of Medicine, Kyung Hee
Received: 31 December 2018 Accepted: 2 April 2019
References
1. Yoo CH, Noh SH, Shin DW, Choi SH, Min JS. Recurrence following curative resection for gastric carcinoma. Br J Surg. 2000;87(2):236–42.https://doi.org/ 10.1046/j.1365-2168.2000.01360.x.
2. Chalitchagorn K, Shuangshoti S, Hourpai N, Kongruttanachok N, Tangkijvanich P, Thong-ngam D, et al. Distinctive pattern of LINE-1 methylation level in normal tissues and the association with carcinogenesis. Oncogene. 2004;23(54):8841–6.https://doi.org/10.1038/sj.onc.1208137. 3. Harris CR, Dewan A, Zupnick A, Normart R, Gabriel A, Prives C, et al. p53
responsive elements in human retrotransposons. Oncogene. 2009;28(44): 3857–65.https://doi.org/10.1038/onc.2009.246.
4. Karpf AR, Matsui S. Genetic disruption of cytosine DNA methyltransferase enzymes induces chromosomal instability in human cancer cells. Cancer Res. 2005;65(19):8635–9.https://doi.org/10.1158/0008-5472.CAN-05-1961. 5. Song YS, Kim Y, Cho NY, Yang HK, Kim WH, Kang GH. Methylation status of
long interspersed element-1 in advanced gastric cancer and its prognostic implication. Gastric Cancer. 2016;19(1):98–106.https://doi.org/10.1007/ s10120-015-0463-6.
6. Olivier M, Hollstein M, Hainaut P. TP53 mutations in human cancers: origins, consequences, and clinical use. Cold Spring Harb Perspect Biol. 2010;2(1): a001008.https://doi.org/10.1101/cshperspect.a001008.
7. Toledo F, Wahl GM. Regulating the p53 pathway: in vitro hypotheses, in vivo veritas. Nat Rev Cancer. 2006;6(12):909–23.https://doi.org/10.1038/nrc2012. 8. Lawrence MS, Stojanov P, Mermel CH, Robinson JT, Garraway LA, Golub TR,
et al. Discovery and saturation analysis of cancer genes across 21 tumour types. Nature. 2014;505(7484):495–501.https://doi.org/10.1038/nature12912. 9. Zhu J, Sammons MA, Donahue G, Dou Z, Vedadi M, Getlik M, et al. Gain-of-function p53 mutants co-opt chromatin pathways to drive cancer growth. Nature. 2015;525(7568):206–11.https://doi.org/10.1038/nature15251. 10. Muller PA, Vousden KH, Norman JC. p53 and its mutants in tumor cell
migration and invasion. J Cell Biol. 2011;192(2):209–18.https://doi.org/10. 1083/jcb.201009059.
11. Do PM, Varanasi L, Fan S, Li C, Kubacka I, Newman V, et al. Mutant p53 cooperates with ETS2 to promote etoposide resistance. Genes Dev. 2012; 26(8):830–45.https://doi.org/10.1101/gad.181685.111.
12. Freed-Pastor WA, Mizuno H, Zhao X, Langerod A, Moon SH, Rodriguez-Barrueco R, et al. Mutant p53 disrupts mammary tissue architecture via the mevalonate pathway. Cell. 2012;148(1–2):244–58.https://doi.org/10.1016/j. cell.2011.12.017.
13. Zhang C, Liu J, Liang Y, Wu R, Zhao Y, Hong X, et al. Tumour-associated mutant p53 drives the Warburg effect. Nat Commun. 2013;4:2935.
https://doi.org/10.1038/ncomms3935.
14. Wylie A, Jones AE, D'Brot A, Lu WJ, Kurtz P, Moran JV, et al. p53 genes function to restrain mobile elements. Genes Dev. 2016;30(1):64–77.
https://doi.org/10.1101/gad.266098.115.
15. Kim Y, Wen X, Jeong S, Cho NY, Kim WH, Kang GH. Combinatory low methylation statuses of SAT-alpha and L1 are associated with shortened survival time in patients with advanced gastric cancer. Gastric Cancer. 2018.
https://doi.org/10.1007/s10120-018-0852-8.
16. Alisch RS, Garcia-Perez JL, Muotri AR, Gage FH, Moran JV. Unconventional translation of mammalian LINE-1 retrotransposons. Genes Dev. 2006;20(2): 210–24.https://doi.org/10.1101/gad.1380406.
17. Doucet AJ, Hulme AE, Sahinovic E, Kulpa DA, Moldovan JB, Kopera HC, et al. Characterization of LINE-1 ribonucleoprotein particles. PLoS Genet. 2010; 6(10).https://doi.org/10.1371/journal.pgen.1001150.
18. Oh HJBJ, Wen X, Jung S, Kim Y, Kim KJ, et al. p53 expression status is associated with cancer-specific survival in stage III and high-risk stage II colorectal cancer patients treated with oxaliplatin-based adjuvant chemotherapy. Br J Cancer. 2019; in press.
19. Ando K, Oki E, Saeki H, Yan Z, Tsuda Y, Hidaka G, et al. Discrimination of p53 immunohistochemistry-positive tumors by its staining pattern in gastric cancer. Cancer Med. 2015;4(1):75–83.https://doi.org/10.1002/cam4.346. 20. Murnyak B, Hortobagyi T. Immunohistochemical correlates of TP53 somatic
mutations in cancer. Oncotarget. 2016;7(40):64910–20.https://doi.org/10. 18632/oncotarget.11912.
21. Joerger AC, Ang HC, Fersht AR. Structural basis for understanding oncogenic p53 mutations and designing rescue drugs. Proc Natl Acad Sci U S A. 2006;103(41):15056–61.https://doi.org/10.1073/pnas.0607286103.
22. Joerger AC, Fersht AR. Structure-function-rescue: the diverse nature of common p53 cancer mutants. Oncogene. 2007;26(15):2226–42.https://doi. org/10.1038/sj.onc.1210291.
23. Inamura K, Yamauchi M, Nishihara R, Lochhead P, Qian ZR, Kuchiba A, et al. Tumor LINE-1 methylation level and microsatellite instability in relation to colorectal cancer prognosis. J Natl Cancer Inst. 2014;106(9).https://doi.org/ 10.1093/jnci/dju195.
24. Jeong S, Lee K, Wen X, Kim Y, Cho NY, Jang JJ, et al. Tumoral LINE-1 hypomethylation is associated with poor survival of patients with intrahepatic cholangiocarcinoma. BMC Cancer. 2017;17(1):588.https://doi. org/10.1186/s12885-017-3595-8.
25. Iwagami S, Baba Y, Watanabe M, Shigaki H, Miyake K, Ishimoto T, et al. LINE-1 hypomethylation is associated with a poor prognosis among patients with curatively resected esophageal squamous cell carcinoma. Ann Surg. 2013;257(3):449–55.https://doi.org/10.1097/SLA.0b013e31826d8602. 26. Saito K, Kawakami K, Matsumoto I, Oda M, Watanabe G, Minamoto T. Long
interspersed nuclear element 1 hypomethylation is a marker of poor prognosis in stage IA non-small cell lung cancer. Clin Cancer Res. 2010;16(8): 2418–26. 1078-0432.https://doi.org/10.1158/1078-0432.CCR-09-2819. 27. Ikeda K, Shiraishi K, Eguchi A, Shibata H, Yoshimoto K, Mori T, et al. Long
interspersed nucleotide element 1 hypomethylation is associated with poor prognosis of lung adenocarcinoma. Ann Thorac Surg. 2013;96(5):1790–4.
https://doi.org/10.1016/j.athoracsur.2013.06.035.
28. Morikawa T, Kuchiba A, Liao X, Imamura Y, Yamauchi M, Qian ZR, et al. Tumor TP53 expression status, body mass index and prognosis in colorectal cancer. Int J Cancer. 2012;131(5):1169–78.https://doi.org/10.1002/ijc.26495. 29. Kawakami K, Matsunoki A, Kaneko M, Saito K, Watanabe G, Minamoto T.
Long interspersed nuclear element-1 hypomethylation is a potential biomarker for the prediction of response to oral fluoropyrimidines in microsatellite stable and CpG island methylator phenotype-negative colorectal cancer. Cancer Sci. 2011;102(1):166–74.https://doi.org/10.1111/j. 1349-7006.2010.01776.x.
30. Weisenberger DJ, Campan M, Long TI, Kim M, Woods C, Fiala E, et al. Analysis of repetitive element DNA methylation by MethyLight. Nucleic Acids Res. 2005;33(21):6823–36.https://doi.org/10.1093/nar/gki987. 31. Tellez CS, Shen L, Estecio MR, Jelinek J, Gershenwald JE, Issa JP. CpG island
methylation profiling in human melanoma cell lines. Melanoma Res. 2009; 19(3):146–55.https://doi.org/10.1097/CMR.0b013e32832b274e.