R E S E A R C H
Open Access
Comparative analysis of the
Trichoderma reesei
transcriptome during growth on the cellulase
inducing substrates wheat straw and lactose
Robert Bischof
1, Lukas Fourtis
2, Andreas Limbeck
3, Christian Gamauf
4, Bernhard Seiboth
1,2and Christian P Kubicek
1,2*Abstract
Background:Renewable lignocellulosic biomass is an advantageous resource for the production of second generation biofuels and other biorefinery products. In Middle Europe, wheat straw is one of the most abundant low-cost sources of lignocellulosic biomass. For its efficient use, an efficient mix of cellulases and hemicellulases is required. In this paper, we investigated how cellulase production byT. reeseion wheat straw compares to that on lactose, the only soluble and also cheap inducing carbon source for enzyme production.
Results:We have examined and compared the transcriptome ofT. reeseigrowing on wheat straw and lactose as carbon sources under otherwise similar conditions. Gene expression on wheat straw exceeded that on lactose, and 1619 genes were found to be only induced on wheat straw but not on lactose. They comprised 30% of the CAZome, but were also enriched in genes associated with phospholipid metabolism, DNA synthesis and repair, iron homeostatis and autophagy. Two thirds of the CAZome was expressed both on wheat straw as well as on lactose, but 60% of it at least >2-fold higher on the former. Major wheat straw specific genes comprised xylanases, chitinases and mannosidases. Interestingly, the latter two CAZyme families were significantly higher expressed in a strain in whichxyr1encoding the major regulator of cellulase and hemicellulase biosynthesis is non-functional. Conclusions:Our data reveal several major differences in the transcriptome between wheat straw and lactose which may be related to the higher enzyme formation on the former and their further investigation could lead to the development of methods for increasing enzyme production on lactose.
Background
The utilization of cellulosic and hemicellulosic polymers in plant biomass for the production of bioethanol or plat-form chemicals is considered as a possible strategy to re-duce carbon dioxide emissions and bypass the current dependence on fossil resources. Renewable lignocellulosic biomass, besides being cheap and abundant, has also the advantage that it does not compete with food production. Currently favored raw materials for this purpose include– among others – wood residues, “energy crops” such as switch grass or Miscanthus, and agricultural byproducts
such as wheat straw [1]. The latter is one of the most abundant low-cost sources of lignocellulosic biomass in middle European countries with an annual production of over 130 million tons [2].
For the biotechnological use of these materials, they first need to be pretreated and then hydrolyzed to their monomers. The fungus Trichoderma reesei is currently the major industrial producer of enzymes needed to de-grade the above polymers to soluble monosaccharide [1,3]. Most of these enzymes are not formed during cul-tivation on monosaccharides such as glucose; the fungus must therefore be grown in the presence of an inducer which is mostly a cellulose and hemicellulose containing waste material [4]. Optimally, this would be the same material for which the produced enzymes are aimed to be applied, because this would ensure the induction of the whole spectrum of enzymes needed. However, this is * Correspondence:[email protected]
1Austrian Centre of Industrial Biotechnology (ACIB) GmBH c/o Institute of Chemical Engineering, University of Technology of Vienna,
Gumpendorferstraβe 1a, Vienna A-1060, Austria 2
Institute of Chemical Engineering, University of Technology of Vienna, Gumpendorferstraβe 1a, Vienna A-1060, Austria
Full list of author information is available at the end of the article
often not possible because commercial producers prefer the manufacture of an enzyme preparation for a broad range of substrates.
One of the carbon sources that is used for the produc-tion of cellulases and hemicellulases byT. reeseiis lactose, which is favoured when a soluble and cheap inducing car-bon source is preferred, e.g. to facilitate and reduce costs for fermentation control and enzyme recovery [5]. How-ever, cellulase production on lactose occurs at a slower rate and a lower final enzyme yield than on cellulosic ma-terials, and it has also been reported to lead to an enzyme preparation with lower specific activities [6]. Yet an in depth comparison of the enzymes produced on cellu-lose and lactose has to our knowledge not been published so far.
Here we report a comparison of the transcriptome of
T. reeseigrowing on lactose and cellulose (wheat straw), which not only demonstrates the differences in the en-zymes produced but also in the molecular physiology of growth on these two carbon sources.
Results
Comparison of the wheat straw and lactose-regulated transcriptome ofT. reesei
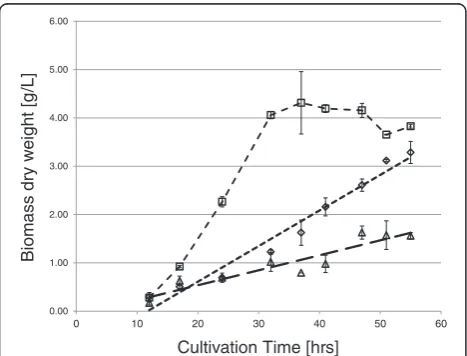
As a prerequisite for this study, we examined the growth
of T. reesei QM 9414 on wheat straw, lactose and
glu-cose. As shown in Figure 1, growth on glucose occurred at a faster rate than on the other two carbon sources. Growth on lactose and on wheat straw occurred at slower rates, that on wheat straw being lowest. In order to compare the expression of genes that are induced in
T. reesei on lactose and on wheat straw to that on
glu-cose, we therefore determined the transcriptional pro-files during the initial growth phase (i.e. when 25–30% of the carbon source have been consumed). We then searched for those transcripts that were >2-fold less abundant at a p <0.05 on glucose than either on lactose and wheat straw. This retrieved a total of 3120 genes, of which 2832 and 1501 were significantly upregulated on wheat straw and lactose, respectively. The significantly higher number on cellulose suggested to us that the slower growth and the complex nature of wheat straw may cause a generally more enhanced transcriptional ac-tivity. In order to test this, we examined those 1100 genes that were expressed on glucose, lactose and wheat straw at a comparable level (± 1.4-fold; Additional file 1: Table S1): they were highly enriched in the KOG groups J (Translation, ribosomal structure and biogenesis; 12.3% of all genes of this category) and K (transcription; 10.3%) (KOG numbers taken from http://genome.jgi-psf.org/ cgi-bin/kogBrowser?db=Trire2). The 1100 genes also contained several housekeeping genes such as tef1 en-coding elongation factor 1-α and act1, encoding actin [7]. Interestingly,sar1, encoding a small protein involved in the secretory pathway, which was recommended as the most reliable housekeeping gene [7] exhibited > 2-fold upregulation on wheat straw, probably because of the general upregulation of secretory genes under these conditions.
Within the 3120 genes, five patterns (further called
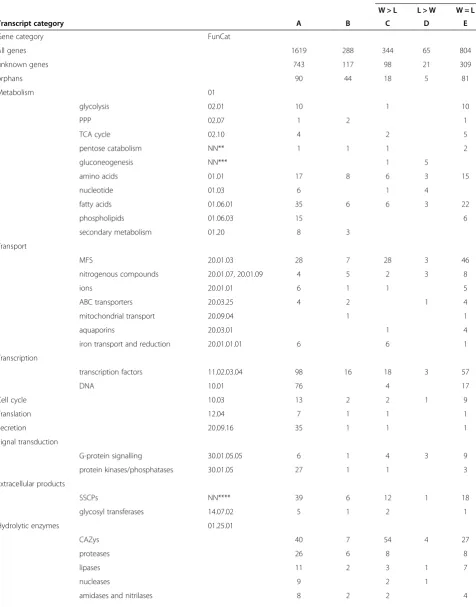
“transcript groups”) could be distinguished: 1213 genes were significantly upregulated both on wheat straw and on lactose (Table 1); 1619 genes were upregulated only on wheat straw (transcript group A), in contrast to only 288 genes that were upregulated on lactose (transcript group B) only. Among the 1213 genes, 344 were signifi-cantly stronger upregulated on wheat straw (transcript group C) and 65 on lactose (transcript group D; Table 1), whereas 804 were equally strong upregulated on wheat straw and lactose (transcript group E). 1288 and 238 of the 3120 genes encoded unknown or orphan proteins, respectively. For a complete list of these genes see Additional file 2: Table S2.
When the percentage of individual gene groups (de-fined as FunCat categories; [8]) in the total number of genes in the individual group was compared, transcript group A displayed some unique features (Table 1): it was strongly enriched in Funcat categories for phospholipid metabolism, iron homeostasis, secretion, protein kinases/ phosphatases and DNA repair. The genes related to iron homeostasis comprised four ferric reductases, three iron transporters, three siderophore transporters, and two en-zymes involved in the biosynthesis of siderophores, includ-ing one of the two siderophore synthases (Trire2:71005; [9]; Figure 2). Genes for gluconeogenesis were significantly 0.00
1.00 2.00 3.00 4.00 5.00 6.00
0 10 20 30 40 50 60
Biomass dry
w
eigh
t
[g
/L]
Cultivation Time [hrs]
Table 1 Overview of theT. reeseitranscriptome on wheat straw (W) and lactose (L)*
Wheat straw Lactose Wheat straw and lactose
W > L L > W W = L
Transcript category A B C D E
Gene category FunCat
All genes 1619 288 344 65 804
unknown genes 743 117 98 21 309
orphans 90 44 18 5 81
Metabolism 01
glycolysis 02.01 10 1 10
PPP 02.07 1 2 1
TCA cycle 02.10 4 2 5
pentose catabolism NN** 1 1 1 2
gluconeogenesis NN*** 1 5
amino acids 01.01 17 8 6 3 15
nucleotide 01.03 6 1 4
fatty acids 01.06.01 35 6 6 3 22
phospholipids 01.06.03 15 6
secondary metabolism 01.20 8 3
Transport
MFS 20.01.03 28 7 28 3 46
nitrogenous compounds 20.01.07, 20.01.09 4 5 2 3 8
ions 20.01.01 6 1 1 5
ABC transporters 20.03.25 4 2 1 4
mitochondrial transport 20.09.04 1 1
aquaporins 20.03.01 1 4
iron transport and reduction 20.01.01.01 6 6 1
Transcription
transcription factors 11.02.03.04 98 16 18 3 57
DNA 10.01 76 4 17
Cell cycle 10.03 13 2 2 1 9
Translation 12.04 7 1 1 1
Secretion 20.09.16 35 1 1 1
Signal transduction
G-protein signalling 30.01.05.05 6 1 4 3 9
protein kinases/phosphatases 30.01.05 27 1 1 3
Extracellular products
SSCPs NN**** 39 6 12 1 18
glycosyl transferases 14.07.02 5 1 2 1
Hydrolytic enzymes 01.25.01
CAZys 40 7 54 4 27
proteases 26 6 8 8
lipases 11 2 3 1 7
nucleases 9 2 1
stronger expressed on lactose than on wheat straw. All other Funcat categories revealed no significant differences between the five transcript categories.
The significant differences in expression of genes re-lated to iron homeostasis prompted us to check whether wheat straw would bind iron and thus decrease its bio-availability to T. reesei. As shown in Additional file 3: Table S3, this was found to be indeed the case: although the same concentration of FeSO4*7H2O had been added to both media (5 mg/L), the supernatant of the wheat straw medium contained only 16% of it prior to inocula-tion. Until the time of harvesting the mycelia for tran-scriptome analysis the cultures on wheat straw consumed 0.21 ppm of the available iron, whereas the lactose culture only consumed 0.06 ppm, which correlates well with the higher expression of the iron homeostasis genes on wheat straw.
TheT. reeseisecretome on wheat straw and lactose
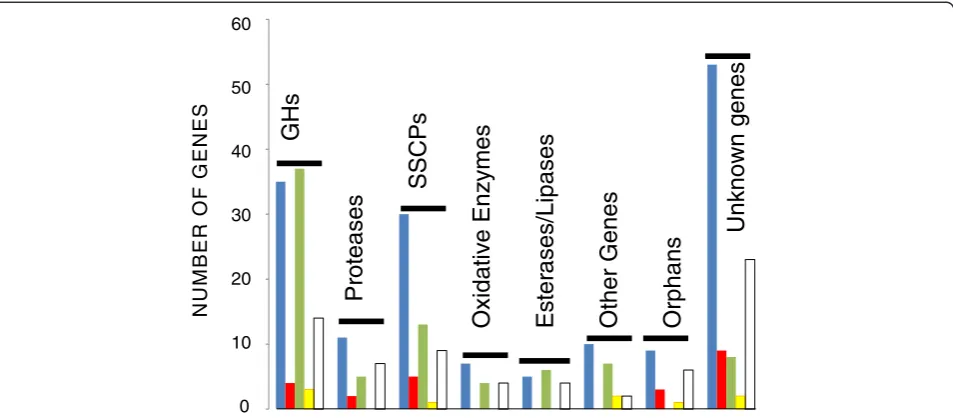
We also examined how many of the genes found in tran-script groups A-E would encode secreted proteins. Druzhinina et al. [10] have recently in silico identified 747 genes for proteins that are secreted byT. reeseiinto
the medium. 341 of these genes were indeed found to be significantly transcribed under at least one of the present conditions, of which 160 were only expressed on wheat straw. CAZys and unknown proteins comprised the major portion (93 and 95, respectively), followed by small, se-creted cysteine rich proteins (58), and all three were most abundant in transcript group A (Figure 3). Proteases, li-pases and oxidative enzymes were also detected but only in much smaller numbers (25, 15 and 15, respectively). It is also of interest that transcript groups B and D (i.e. genes expressed either only on lactose, or at high abundance on it) lacked such coding for oxidative en-zymes and lipases (Figure 3).
Common and unique features of the wheat-straw and lactose-induced CAZome
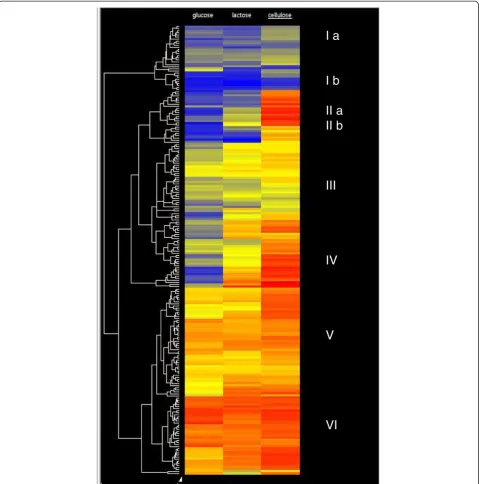
Häkkinen et al. [11] have recently revised and expanded the repertoire of CAZys inT. reesei, which resulted in 210 genes encoding glycosyl hydrolases, carbohydrate esterases and carbohydrate binding proteins. A hierarchical cluster analysis with all of them illustrates that their expression on wheat straw, lactose and glucose falls into several categor-ies (indicated by clusters; Figure 4 and Additional file 4:
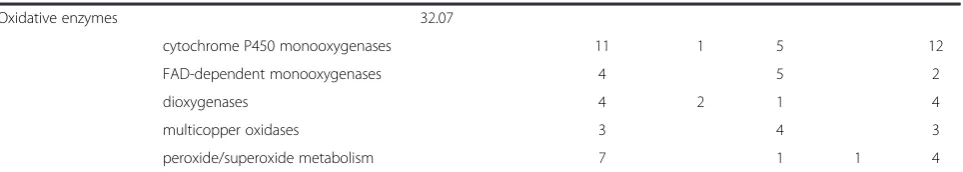
Table 1 Overview of theT. reeseitranscriptome on wheat straw (W) and lactose (L)*(Continued)
Oxidative enzymes 32.07
cytochrome P450 monooxygenases 11 1 5 12
FAD-dependent monooxygenases 4 5 2
dioxygenases 4 2 1 4
multicopper oxidases 3 4 3
peroxide/superoxide metabolism 7 1 1 4
*Only genes that are at least 2-fold upregulated with respect to glucose (p < 0.05) are considered. **Not noted in FunCat; refers to enzymes involved in the fungal pentose catabolic pathway.
***FunCat combined gluconeogenesis and glycolysis; here we list genes specific only for gluconeogenesis (and which were consequently left out from glycolysis). ****Small secreted, cysteine-rich proteins; not listed in FunCat.
Figure 2Hierarchical cluster analysis of expression of genes related to iron homeostasis. Glc, glucose; Lac, lactose; WS, wheat straw. Data are shown as a heat map, and the color code of respective expression values (dark blue: 0; dark red: 16; numbers indicate the log2of the
Table S4): they comprise genes not expressed at all or–if so only weakly on wheat straw (I a), genes much stronger expressed on wheat straw than on lactose (clusters II a and b), but also genes that are expressed on all carbon sources (cluster VI). As noted above, 132 of these genes fulfilled our criterion of at least 2-fold increased expression on wheat straw versus glucose and at least 2-fold on lactose versus glucose, respectively. This number is higher than that of secreted CAZymes, which is due to the fact that several of the upregulated α- and β-glycosidases lacked a signal peptide and apparently represent intracel-lular enzymes.
A detailed analysis showed that the majority of genes for cellulases, cellulose monooxygenases and cellulose binding proteins were > 2-fold stronger expressed on wheat straw than on lactose (Table 2). This included al-most all of the cellulases with a CBM1 cellulose binding domain, and also the auxiliary proteins swollenin, CIP1 and one GH61 polysaccharide monooxygenase. Only the cellobiohydrolase 1-encoding gene cel7a, as well as two GH1 and one GH3β-glucosidase genes (cel1a, cel1band
bgl3j) and two GH61 polysaccharide monooxygenases
were equally expressed on wheat straw and lactose, and one other polysaccharide monooxygenase was only expressed on wheat straw. A contrasting picture was obtained for the GH10, GH11 and GH30 xylanases, half of which were only expressed on wheat straw. In con-trast, most of the genes encoding enzymes that cleave hemicelluloses side chains (α-L-arabinosidases,α -(methyl)-D-glucuronidases, α-D-fucosidases and polysaccharide deacetylases) were equally well expressed on lactose and wheat straw (transcript group E). Finally, it was
noted that the presence of wheat straw (transcript groups A and C) also specifically induced an array of GH18 chitinases–particularly such that also contain a cel-lulose binding domain (14, CH18-16, and CHI18-17 [12]) GH2 and GH47 β-D-mannosidases and GH55 endo-β-1,3-glucanases.
Chitinases, mannanases and galactosidases are negatively regulated in a strain in which the cellulase regulator XYR1 is nonfunctional
The polysaccharides present in pretreated wheat straw are mainly cellulose and (a small amount of) xylan [11]. Yet the above data (Table 2) have shown that several genes not associated with degradation of cellulose or xylan, such as chitinases, mannosidases or α-D-galactosidases, are specifically or higher induced by wheat straw. Since the genes encoding the cellulose and xylan depolymerising enzymes are regulated by the Zn2Cys6 transcription factor XYR1 [13], we also wanted to learn whether tran-scription of these other differentially expressed genes is also controlled by XYR1. To this end, we examined their expression on wheat straw both in T. reesei strain QM 9414 as well as in a Δxyr1 knock-out strain. The results are shown in Figure 5: while qPCR confirmed the induced expression of these genes in QM 9414, we found that almost all of them – with the only clear exception of the β-mannanase encoding gene man1 – were 2- to >100-fold overexpressed in the Δxyr1 mutant. Most notably this was true for all the tested chitinases, while there were one and two ambiguous cases for the mannanases and galactosidases respectively. The signifi-cance of these results was also tested by an unequal 60
50
40
30
20
10
0
NUMBER OF
GENE
S
GHs
Pr
ot
eases
SSCP
s
O
x
ida
tiv
e Enz
y
mes
Es
te
rases/Lipases
Other Genes
Orphans
Unknown g
e
nes
variance t-test and the respective result are reported in Additional file 5: Table S5.
This finding prompted us to test whether the 5’ -up-stream nontranslated sequences of these chitinase, mannanase and galactosidase genes would bear consen-sus sites for binding of XYR1 (GGCW4). Furukawa et al. [14] assessed that the whole genome ofT. reeseicontains 20692 XYR1 consensus binding sites, which–in view of the estimated 33 Mbp of the T. reesei genome [15] –
implies that on the average one binding site may occur about every 1500 bp. When this value is compared to the number of consensus sites in four major cellulase genes cel7a, cel7b, cel6aand cel5a, they all contain >10 consensus sites in the first 1500 5’ bp upstream of the ATG [14]. A similar analysis for the 16 chitinase, α -galactosidase and α-mannanase/mannosidase genes that were analyzed by qPCR (Figure 5) revealed a broad range of number of consensus sites within 1000 bp
I a
I b
II a
II b
III
IV
V
VI
Figure 4Hierarchical cluster analysis of glycosyl hydrolase gene expression.Data are shown as a heat map, and the color code of respective expression values (dark blue: 0; dark red: 16; numbers indicate the log2of the mean expression level, n = 2). Roman numbers and
Table 2 Glycosyl hydrolases and auxiliary enzymes or proteins that are significantly expressed inT. reeseion wheat straw and/or lactose
Wheat straw Lactose Wheat straw and lactose
W > L L > W W = L
Transcript category A B C D E
All CAZYs 40 7 54 4 27
cellulases cellobiohydrolases GH6 1
GH7 1
endo-β-1,4-glucanases GH5 1
GH7 1
GH12 1
GH45 1
β-glucosidases GH1
GH3 7 2
swollenin, CIP1 2
polysaccharide monooxygenase GH61 1 2
hemicellulases endo-β-1,4-xylanases GH10 1 1
GH11 2 1
exo-β-1,4-xylanases GH30 1 2
β-xylosidases GH3 2 1
xyloglucanase GH74 1
α-L-arabinofuranosidases GH43 1 1
GH54 2
GH62 1
α-D-galactosidases GH27 1 2 4
GH36 1
α-D-fucosidases GH95 1 2
β-D-mannanases GH5 1
β-D-mannosidases GH2 1 3 1
GH38 1
GH47 3 1
GH76 2 1
GH92 1 2
β-glucanases endo-1,3/1,4-β-glucanase GH16 2 1 1
endo-1,3-β-glucanase GH55 4 1 1
endo-1,3-β-glucanase GH64 1 1
β-1 3-glucanosyltransferase GH72 1 1
endo-1,3-β-glucanase GH81 1
polygalacturonases exo-polygalacturonase GH28 1
endopolygalacturonase GH28 1
exo-rhamnogalacturonase GH28 1
α-L-rhamnosidase GH78 1
chitinases exo-β-D-glucosaminidase GLS93 GH20 1
endochitinases GH18 4 3
N-acetyl-β-glucosaminidases GH20 1 1
chitosanases GH75 1 1
upstream of their start codon, ranging from 6 (MAN1) to 0 (for two chitinases and one mannosidase; Additional file 6: Table S6). The significance of the number of consensus sites versus the mean statistical occurrence (every 1500 bp) was rejected by the Anderson-Darling test [16].
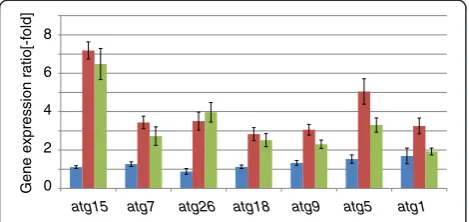
Wheat straw induces the expression of genes involved in autophagy
The above described upregulation of chitinases could be a consequence of enhanced autophagy. This term speci-fies an intracellular degradation process functioning in the delivery of cytoplasmic proteins and organelles to vacuoles for macromolecule turnover and recycling [17,18]. To investigate this possibility, we screened for the potential of genes known to be involved in fungal autophagy inT. reeseigrowing on wheat straw and lac-tose. Indeed, as shown in Figure 6, we found 7 autoph-agy genes (atg1, atg5, atg7, atg9, atg15, atg18and atg26) to be significantly upregulated on wheat straw, but not on glucose or lactose.
Discussion
We have previously described that lactose can induce an almost complete cellulase and hemicellulase enzyme sys-tem inT. reesei, and reasoned that this could be due to a preference of the fungus to initiate feeding on lignocel-lulose by hydrolysing the β-galactoside side chains in the xyloglucans, which are linked to cellulose in the pri-mary cell wall of dicotyledons [19]. In order to test how this induction on lactose would compare to a complex
lignocellulosic material – wheat straw, which not only contains cellulose but also xylans but with very little ga-lactose side chains (< 0.1%; [11])–we compared the tran-scriptome under both conditions. The results showed that 85 of the 132 genes of the CAZome were expressed both on lactose as well as on wheat straw. However, two thirds of them were significantly stronger expressed on wheat straw than on lactose. One of the major qualitative differ-ences between wheat straw and lactose was a strict de-pendence of 4 xylanases and 2 β-xylosidases on wheat straw for expression, implying that xylanases are only poorly expressed on lactose. Onlyxyn2andxyn3were also expressed on the latter. These findings suggest that there is indeed no major difference between the induction of cellulolytic enzymes by lactose and cellulose, but that the observed differences are due to the content of xylan. Ex-pression of xyn2 has previously been demonstrated to be triggered by both sophorose (which is considered to be a
“cellulose-specific” inducer) as well as xylobiose (consid-ered to be“xylan-specific”) and by lactose [20]. However,
xyn1, xyn2,xyn4andxyn5have recently also been shown to be differentially induced by D-xylose and L-arabinose [21]. Similarly, Akel et al. [22] have shown that the α-L-arabinofuranosidase genes require the presence of L-arabinose for full induction. We therefore interpret the significantly higher expression of most of the xylanases and hemicelluloses side chain hydrolases to be due to the presence of additional specific inducers for their genes.
These results raise an interesting question: it has been demonstrated that expression of the cellulase and
Table 2 Glycosyl hydrolases and auxiliary enzymes or proteins that are significantly expressed inT. reeseion wheat
straw and/or lactose(Continued)
carbohydrate binding proteins CBM13 1
CBM18 1
α-glucan hydrolases α-D-1,4-glucosidases GH13 1 1
glucamylase GH15 1
α-D-1,4-glucosidases GH31 3
α,α'-trehalase GH37 1
α,α'-trehalase GH65 2
α-D-1,3-glucosidases GH71 2 1
carbohydrate esterases CE1 2
CE4 1 1
acetyl xylan esterase CE5 3
acetyl esterase CE16 1
chitin deacetylase 1
α-glucuronidases GH67 1
GH79 1
GH105 1 1
hemicellulase genes in T. reesei is completely dependent on the function of the Zn2Cys6-transcription factor XYR1 [13,22], andxyr1itself is induced both on lactose [19], and cellulose [23]. So how could a single transcription factor respond to different inducers in quantitative different ways? The regulation of genes encoding xylanolytic en-zymes of the model organismNeurospora crassahas been suggested to involve several regulatory groups: the xylanase regulator XLR-1 (theN. crassa orthologue of XYR1) was suggested to work alone or in combination with other
unknown regulators and an XLR-1 independent group of genes was also suggested to exist [24]. Häkkinen et al. [11] have also hypothesized that several regulatory mechanisms, depending on the inducers present, may act on the CAZyme gene promoters simultaneously, and in some cases also in an additive manner. An example of such an additional regulator could be ACE2, which has been dem-onstrated to assist xylanase gene transcription by enhan-cing xyr1 transcription and by forming a putative heterodimer with XYR1 [25], whereas it has only a small
effect on induction of cellulase gene transcription by solka floc cellulose, and none at all when sophorose is used as an inducer [26]. Another candidate could be the orthologue (Trire2: 26163) of the recently describedN. crassacellulase regulator CLR-2 [27]. In this study,clr2was found to be induced during growth on lactose or wheat straw. A blastp search with theT. reesei CLR2 protein sequence against the NCBI database revealed that it is an orthologue of the
A. nidulans mannanase regulator ManR, for which the
DNA-binding motif has been determined as 5’ -YAGAAT-3’[28]. However, a search of the presence of this motif in 1 kb upstream of several CAZome genes that were found to be significantly regulated in this study revealed no con-sistent picture: 1–2 copies were present in some genes, but completely absent in the majority of them, including the major β-mannanase gene man5 (unpublished data). Whether or not CLR2 or another transcription factor co-operate with XYR1 in the expression of some CAZome genes therefore remains to be determined. We should like to stress that both xyr1 and clr2 belonged to transcript group E, i.e. they were expressed to similar levels on lac-tose and wheat straw. The different level of expres-sion of various genes on wheat straw and lactose can therefore not be simply the result of an enhanced ex-pression of xyr1.
In this study, we also detected a significant upre-gulation of genes encoding chitinases, α-galactosidases and mannosidases. These genes were also recently ob-served to behave different from the major set of cellulase and hemicellulase genes by being moderately or even very low expressed during growth on birch xylan, steam exploded and enzymatically treated bagasse already at the early time points [11]. Interestingly, this upre-gulation was strongly enhanced in a strain in which the
xyr1 gene had been deleted, indicating that XYR1 is a
repressor of these genes. While the XYR1 orthologues
from A. oryzae, N. crassa and Fusarium graminearum
all function in the regulation of xylanase gene expres-sion, XYR1 regulates cellulase gene expression only in
T. reesei andA. oryzae.In bothN. crassaandA. oryzae–
the two fungi in which the effect ofxyr1manipulation has been studied on a genome-wide scale [24,29] - it has so far been shown only to activate gene expression. However, the variation of occurrence (and in 3 cases even absence) of XYR1 binding sites in the promoters of these genes makes an action of XYR1 as a repressor of these genes un-likely. We consider it rather possible that their strong upregulation in theΔxyr1mutant is due to its inability to grow on wheat straw and the reduced growth on lactose [30], i.e. autophagy. In fact, upregulation of some of the
T. reesei chitinases by carbon starvation has been shown [12], but is so far not known for the α-mannanases /mannosidases orα-galactosidases. Since oligosaccharides with these monosaccharide and linkage types are not part of the cell wall polymers of the fungus [31], their induc-tion under starvainduc-tion requires further studies.
A comparison of the wheat straw and lactose tran-scriptome did not lead to the detection of major changes in metabolic pathways and the signaling to them with four exceptions: one was a high number of genes associ-ated with phospholipid metabolism and protein secre-tion, with DNA replication and repair, and finally the massive upregulation of genes for iron homeostasis. As for the first, Schreiber et al. [32] showed that the addition of the phospolipid precursor cholin increased cellulase formation in T. reesei, and at the same time led to an increase in the hyphal content of endoplasmic reticulum. Also, Glenn et al. [33] showed that the hypercellulolytic mutant T. reesei RUT C30 exhibits a proliferated amount of endoplasmic reticulum. It is thus possible that the increased expression of genes associated with phospholipid synthesis is responsible for an enhanced synthesis of endomembrane compo-nents required for increased cellulase export from the hyphae.
Another group of upregulated genes was those related to autophagy. To date, more than 30 autophagy-related (ATG) genes have been identified for Saccharomyces cerevisiaeand other fungi [34,35]. BLASTP search of the predicted T. reesei proteins (http://genome.jgi-psf.org/ Trire2/Trire2.home.html) against the NCBI database (at a cutoff of E-value <−70 over at least 80% of the se-quence length) detected 22 orthologues of ATG genes (see Additional file 7: Table S7) of which 7 were found to be strongly upregulated on wheat straw but not on lactose or glucose. Notably this group included the serine/ threonine protein kinase Atg1 [17,18], which – together with Atg17, Atg29, and Atg31–forms a protein complex that initiates the formation of autophagosomes [36,37].
Gene e
xpr
ession
ra
tio[-f
old] 8
6
4
2
0
atg15 atg7 atg26 atg18 atg9 atg5 atg1
Figure 6Changes in gene expression of autophagy related
Nitsch et al. [38] have recently shown that autophagy plays important roles in physiological adaptation in sub-merged cultures under conditions of carbon depletion by organelle turnover and protection against cell death. Our data suggest that the slow growth rate on wheat straw may lead to a carbon uptake rate slow enough to already signal starvation. However, autophagy has also been shown to be necessary for fungal morphogenesis, particu-larly when attacking other organisms [39,40], and we can therefore also not rule out that it is crucial for the growth ofT. reeseion an insoluble substrate.
The upregulation of genes associated with DNA syn-thesis and repair appears to indicate the operation of mechanisms leading to damage of DNA during growth on cellulose. While the occurrence of such mechanisms has not been reported so far, we detected a wheat-straw-specific 2.7-fold upregulation of theT. reesei orthologue of the NADPH oxidase NoxA (NOX1; Trire2:79498; see Additional file 2: Table S2). This enzyme generates react-ive oxygen species in a regulated manner and is involved in several aspects of fungal biology, including develop-ment and plant pathogenesis [41]. We consider it pos-sible that the upregulation of enzymes for DNA repair is a response to the formation of reactive oxygen species by NOX1, although the reason for its upregulation is not clear. Brun et al. [42] reported that Podospora anserina
hyphae form specialized structures for cellulose degradation and their formation is differentially regulated by NOX1 and NOX2. Interestingly, Montero-Barrientos et al. [43] reported that an overexpression of nox1 in T. harzianum
leads to the increased formation of protease, cellulase, and chitinase activities during mycoparasitic interaction with a fungal host. Nitsche at al. (2013) reported that inA. niger
autophagy influences the sensitivity towards oxidative stress. We consider it likely that the detected enhanced au-tophagic activity on wheat straw (vide supra) also causes the increased expression of genes related to DNA damage repair and oxidative stress.
Finally, a very intriguing finding from this study was the massive upregulation of genes involved in iron homeostasis. This elevated expression of iron-uptake systems on wheat straw can be explained by a lower bio-available concentration of iron during growth on wheat straw (as shown in this study), which is probably due to the ability of cellulose for sequestering Fe3+[44]. In na-ture, this shortage can be reinforced by the formation of Fe3+-oxalate chelates with the oxalic acid secreted by ba-sidiomycetes [45]. It is also possible that this induction of iron assimilating enzymes has the additional benefit of triggering the synthesis of the large number of flavin containing oxidases and monooxygenases that are up-regulated during growth on wheat straw and result in an increased demand for iron. As already hypothesized [19], this increased expression of oxidative enzymes could
indicate the operation of Fenton chemistry during cellu-lose degradation by T. reesei. The increased expression of a glucose oxidase (Trire2:22915) and a gluconate kin-ase (Trire2:71072), as observed in this study, suggests partial degradation of the glucose from cellulose, which could be involved in the provision of hydrogen peroxide for this process.
Conclusions
Our study shows that growth on wheat straw leads in part to an enhanced expression of cellulase and hemicellulase genes byT. reesei, but also to the selective induction of a set of enzymes, notable the majority of the xylanolytic enzymes. This implies that the expression of genes associ-ated with lignocelluloses degradation byT. reeseiis subject to as yet unknown regulator proteins which are sup-posed to cooperate with XYR1. A detailed analysis of transcriptomic changes of genes involved in cellular metabolism and its regulation further identified au-tophagy, phospholipid biosynthesis, iron homeostasis and DNA repair as processes related to degradation of wheat straw, whose roles warrant further investiga-tions. In addition, manipulation of these genes may be a new tool for strain improvement in T. reesei.
Materials and methods
Strains and cultivations
T. reeseiQM9414 (ATCC 26921), a moderately cellulase
producing mutant, and aΔxyr1mutant prepared from it [13] was used throughout this work and kept on potato dextrose agar (Sigma, St. Louis, MO).
Cultures were grown in 250 ml of Mandels Andreotti (MA) medium (per liter: 1.4 g (NH4)2SO4, 2.0 g KH2PO4, 0.3 g MgSO4*7H2O, 0.3 g CaCl2*2H2O, 0.3 g urea, 1 g peptone (casein), 5 mg FeSO4*7H2O, 1.6 mg MnSO4*H2O, 1.4 mg ZnSO4*7H2O and 2 mg CoCl2*2H2O) with 10 g/l glucose monohydrate, lactose monohydrate or pre-treated wheat straw (dry basis) as the sole carbon source and inoculated with 106 ml-1 conidiospores. Pretreated wheat straw was kindly provided by Clariant Produkte Deutschland GmbH. In brief, the substrate was mechanic-ally ground, and subjected to slightly acidic, thermochem-ical pretreatment.
or pretreated wheat straw (dry basis) as the sole carbon source, but this time devoid of urea and peptone.
Transcriptome analysis
Mycelia were harvested from cultures growing on wheat straw, lactose, and glucose, for 50 (wheat straw) and 28 hrs (lactose and glucose), respectively. Total RNAs from glu-cose and lactose cultures were extracted using TRIzol® re-agent (Invitrogen Life Technologies, Carlsbad, CA, USA), according to the manufacturer's instructions, and then purified using the RNeasy MinElute Kit (Qiagen, Hilden, Germany). For isolation and purification of total RNA from wheat straw cultures, the RNeasy Plant Mini Kit and the RNeasy MinElute Kit (both Qiagen, Hilden, Germany) re-spectively were used according to the manufacturer’s in-structions. cDNA synthesis, labelling and hybridization was performed by Roche NimbleGen (Roche-NimbleGen, Inc., Madison, WI, USA) with a high density oligonucleotide microarray using 60-mer probes representing the 9.129 genes of T. reesei. Microarray scanning, data acquisition and identification of probe sets showing a significant difference (p = 0.05) in expression level between the differ-ent conditions were performed essdiffer-entially as described previously [13,46]. Gene accession numbers were anno-tated according to version 2 of theT. reeseigenome data-base (http://genome.jgi-psf.org/Trire2/Trire2.home.html), and ambiguous cases annotated manually. The Euclidean distance metric method, as implemented in DNASTAR v5.1.2. build 3 (DNAstar Inc., Madison, WI), was used for Hierarchical Clustering.
Genes were then classified according to their major annotation in the GO (Gene Ontology), KOG (EuKaryotic Orthologous Groups) classification available at theT. reesei
genome database v2.0 (http://genome.jgipsf.org/Trire2/ Trire2.home.html), and the MIPS Functional Catalogue (http://mips.helmholtz-muenchen.de/proj/funcatDB; [8]). To determine whether there were differences in the functional categories in each cluster, the distribution within each cluster was compared to the total distribution of all the annotated genes using independent chi-square tests.
The microarray data and the related protocols are avail-able at the GEO web site (www.ncbi.nlm.nih.gov/geo/) under accession number GSE46155.
Promoter sequence analysis
All analyses were performed with the RSAT software suite [47]. Promoter sequences from −1000 to −1 were obtained from theT. reeseigenome database (http://gen-ome.jgi-psf.org/Trire2/Trire2.home.html). Motifs were searched using the "DNA Pattern Matching" algorithm, with the "prevent overlapping matches" parameter checked. For a given set of genes (any cluster, or whole genome), the total number of motifs found was collected and an average number of sites per gene was calculated.
qPCR
DNase treated (DNase I, RNase free; Fermentas) total RNA (5μg) was reversely transcribed with the RevertAid™ First Strand cDNA Kit (Fermentas) according to the man-ufacturer’s protocol with a combination (1:1) of the pro-vided oligo-dT and random hexamer primers. All assays were carried out in 96-well plates which were covered with optical tape, as described [13,46]. Primers, amplifica-tion efficiency and R-square values are given in Addiamplifica-tional file 8: Table S8. Determination of the PCR efficiency was performed using triplicate reactions from a dilution series of cDNA, and the amplification efficiency then cal-culated from the given slopes in the realplex v2.2 software. Expression ratios were calculated using REST© Software [48]. All samples were analyzed in two independent experiments with three replicates in each run. The unequal varaiance t-test was performed as previously described [49].
Measurement of biomass dry weight
Biomass formation of lactose and glucose cultures was determined gravimetrically, as previously reported [16]. Biomass concentrations of wheat straw cultures were in-directly measured by the amount of intracellular protein essentially as in [50]. In brief, a 1 ml sample of the cul-ture broth was withdrawn and the solids collected by centrifugation. One mL 1 M NaOH was added and the mixture was incubated for two hours and frequently vortexed. This suspension was then clarified by centrifu-gation and the protein concentration of the supernatant was determined with the BioRad protein assay reagent (BioRad, Hercules, USA) against a BSA standard. The protein content was furthermore corrected by a set of substrate controls where no inoculum was added to the wheat straw medium. The biomass dry weight was then calculated assuming an average content of 0.35 g intra-cellular protein per g of dry cell mass. Three independ-ent cultivations were performed for each carbon source and the mean of the three experiments is reported.
Measurement of iron
Transportation of sample solutions was performed by the peristaltic pump of the iCAP Q coupled to an ESI SC2 DX auto sampler (ESI, USA). For separation of spectral interferences caused from polyatomic ions pro-duced in the argon plasma by matrix constituents all ICP-MS measurements were performed in the collision mode using He with 7% H2as collision gas at a flow rate of 5 mL min-1and a KED value of 3 eV. Plasma power was maintained at 1550 W, cooling gas and auxiliary gas flow set at 14 L.min-1and 0.8 L.min-1, respectively. Make up gas flow, nebulizer flow rate and sample uptake rate were adjusted at 0.7, 0.99 and 0.4 L.min-1, respectively. For analysis the elemental isotopes (m/z ratios) 56Fe, 57
Fe,58Ni,59Co and58Ni and115In (as internal standard) were monitored. Quantification of derived signals was based on an external calibration function determined with aqueous standard solutions using Indium as in-ternal standard. The ICP-MS operation and data acquisi-tion (by peak hopping) was accomplished by using Qtegra software, using a dwell time of 10 ms and 20 sweeps per reading, and 4 replicates per sample.
Additional files
Additional file 1: Table S1.Genes constitutively expressed inT. reesei on glucose (Glc), lactose (Lac) and wheat straw (WS).
Additional file 2: Table S2.All genes that are at least 2-fold differentially regulated on lactose or wheat straw vs glucose.
Additional file 3: Table S3.Concentration of iron in the culture supernatant on lactose and wheat straw.
Additional file 4: Table S4.Genes present in the clusters shown in Figure 4.
Additional file 5: Table S5Unequal variancet-test of qPCR results shown in Figure 5.
Additional file 6: Table S6.Presence of the XYR1 binding consensus motif in the first 1000 bp upstream of the start codon in the genes upregulated in theΔxyr1 mutant strain.
Additional file 7: Table S7.Autophagy genes inT. reesei.
Additional file 8: Table S8.Nucleotide sequences and Reaction efficiencies of RT-qPCR oligos used in this study.
Abbreviations
CAZome:Carbohydrate active enzyme proteome; CAZys: Carbohydrate active enzymes; ESI: Electron spray ionization; GEO: Gene expression omnibus; GH: Glycosyl hydrolase; GO: Gene ontology; ICP-MS: Inductively coupled plasma mass spectrometry; KED: Kinetic energy discrimination; KOG: EuKaryotic Orthologous Groups; MIPS: MUNICH Information Center for Protein Sequences; qPCR: Quantitative polymerase chain reaction; REST: Relative expression software tool.
Competing interests
The authors declare that they have no competing interests.
Authors’contributions
BS and CPK initiated, designed and coordinated the study and reviewed the manuscript. RB planned and carried out experiments and measurements and interpreted experimental data. LF carried out experiments and measurements and analysed experimental data. AL performed the iron analyses. CG analyzed and discussed data. CPK drafted the paper. All authors have read and approved the final manuscript.
Acknowledgements
This work has been supported by the Federal Ministry of Economy, Family and Youth (BMWFJ), the Federal Ministry of Traffic, Innovation and Technology (bmvit), the Styrian Business Promotion Agency SFG, the Standortagentur Tirol and ZIT - Technology Agency of the City of Vienna through the COMET-Funding Program managed by the Austrian Research Promotion Agency FFG, and by the Austrian Science Foundation project P 23202 to CPK and project P24219 to BS.
Author details
1Austrian Centre of Industrial Biotechnology (ACIB) GmBH c/o Institute of Chemical Engineering, University of Technology of Vienna,
Gumpendorferstraβe 1a, Vienna A-1060, Austria.2Institute of Chemical Engineering, University of Technology of Vienna, Gumpendorferstraβe 1a, Vienna A-1060, Austria.3Institute of Chemical Technologies and Analytics, University of Technology of Vienna, Getreidemarkt 9, Vienna A-1060, Austria. 4Biotech & Renewables Center, Clariant GmbH, München 81477, Germany.
Received: 31 May 2013 Accepted: 4 September 2013 Published: 9 September 2013
References
1. Kubicek CP:Fungi and lignocellulosic biomass.New York: Wiley; 2012. 2. Talebnia F, Karakashev D, Angelidaki I:Production of bioethanol from
wheat straw: an overview on pretreatment, hydrolysis and fermentation. Bioresour Technol2010,101:4744–4753.
3. Schuster A, Schmoll M:Biology and biotechnology ofTrichoderma. Appl Microbiol Biotechnol2010,87:787–799.
4. Aro N, Pakula T, Penttilä M:Transcriptional regulation of plant cell wall degradation by filamentous fungi.FEMS Microbiol Rev2005,29:719–739. 5. Persson I, Tjerneld F, Hahn-Hägerdal B:Fungal cellulolytic enzyme
production: A review.Proc Biochem1991,26:65–74.
6. Ryu D, Andreotti R, Mandels M, Reese ET:Studies on Quantitative Physiology ofTrichoderma reeseiwith Two-Stage Continuous Culture for Cellulase Production.Biotechnol Bioengin1979,21:1887–1903.
7. Steiger MG, Mach RL, Mach-Aigner AR:An accurate normalization strategy for RT-qPCR inHypocrea jecorina(Trichoderma reesei).J Biotechnol2010, 145:30–37.
8. Ruepp A, Zollner A, Maier D, Albermann K, Hani J, Mokrejs M, Tetko I, Güldener U, Mannhaupt G, Münsterkötter M, Mewes HW:The FunCat, a functional annotation scheme for systematic classification of proteins from whole genomes.Nucleic Acids Res2004,32:5539–5545.
9. Lehner SM, Atanasova L, Neumann NK, Krska R, Lemmens M, Druzhinina IS, Schuhmacher R:Isotope-assisted screening for iron-containing metabolites reveals a high degree of diversity among known and unknown siderophores produced byTrichodermaspp.Appl Environ Microbiol2013,79:18–31.
10. Druzhinina IS, Shelest E, Kubicek CP:Novel traits ofTrichodermapredicted through the analysis of its secretome.FEMS Microbiol Lett2012,337:1–9. 11. Häkkinen M, Arvas M, Oja M, Aro N, Penttilä M, Saloheimo M, Pakula TM:
Re-annotation of the CAZy genes ofTrichoderma reeseiand transcription in the presence of lignocellulosic substrates.Microb Cell Fact.2012, 11:134.
12. Seidl V, Huemer B, Seiboth B, Kubicek CP:A complete survey of Trichodermachitinases reveals three distinct subgroups of family 18 chitinases.FEBS J2005,272:5923–5939.
13. Stricker AR, Grosstessner-Hain K, Würleitner E, Mach RL:Xyr1 (xylanase regulator 1) regulates both the hydrolytic enzyme system and D-xylose metabolism inHypocrea jecorina.Eukaryot Cell.2006,5:2128–2137. 14. Furukawa T, Shida Y, Kitagami N, Mori K, Kato M, Kobayashi T, Okada H,
Ogasawara W, Morikawa Y:Identification of specific binding sites for XYR1, atranscriptional activator of cellulolytic and xylanolytic genes in Trichoderma reesei.Fungal Genet Biol2009,46:564–574.
16. Corder GW, Foreman DI:Nonparametric Statistics for Non-Statisticians: A Step-by-Step Approach.NY: Wiley; 2009.
17. Bartoszewska M, Kiel JAKW:The role of macroautophagy in development of filamentous fungi.Antioxid Redox Signaling2011,14:2271–2287. 18. Inoue Y, Klionsky DJ:Regulation of macroautophagy inS. cerevisiae.
Semin Cell Dev Biol2010,21:664–670.
19. Ivanova C, Baath J, Seiboth B, Kubicek CP:Systems analysis of lactose metabolism inTrichoderma reeseiidentifies a lactose permease that is essential for cellulase induction.PLOS One.2013,8:e62631.
20. Zeilinger S, Mach RL, Schindler M, Herzog P, Kubicek CP:Differential induction of two xylanases inTrichoderma reesei.J Biol Chem1996, 271:25624–25629.
21. Herold S, Bischof R, Metz B, Seiboth B, Kubicek CP:Prepared for the possible: xylanase gene transcription inTrichoderma reeseiis triggered by different inducers representing different hemicellulosic pentose polymers.Eukaryot Cell2013,12:390–398.
22. Akel E, Metz B, Seiboth B, Kubicek CP:Molecular regulation of arabinan and L-arabinose metabolism inHypocrea jecorina(Trichoderma reesei). Eukaryot Cell2009,8:1837–1844.
23. Tisch D, Kubicek CP, Schmoll M:The phosducin-like protein PhLP1 impacts regulation of glycoside hydrolases and light response in Trichoderma reesei.BMC Genomics2012,12:613.
24. Sun J, Tian C, Diamond S, Glass NL:Deciphering transcriptional regulatory mechanisms associated with hemicellulose degradation inNeurospora crassa.Eukaryot Cell.2012,11:482–493.
25. Stricker AR, Trefflinger P, Aro N, Penttilä M, Mach RL:Role of Ace2 (Activator of Cellulases 2) within thexyn2transcriptosome ofHypocrea jecorina.Fungal Genet Biol2008,45:436–445.
26. Aro N, Saloheimo A, Ilmén M, Penttilä M:ACEII, a novel transcriptional activator involved in regulation of cellulase and xylanase genes of Trichoderma reesei.J Biol Chem2001,276:24309–24314.
27. Coradetti ST, Craig JP, Xiong Y, Shock T, Tian C, Glass NL:Conserved and essential transcription factors for cellulase gene expression in ascomycete fungi.Proc Natl Acad Sci U S A2012,109:7397–7402. 28. Ogawa M, Kobayashi T, Koyama Y:ManR, a novel Zn(II)(2)Cys(6)
transcriptional activator, controls theβ-mannan utilization system in Aspergillus oryzae.Fungal Genet Biol2012,49:987–995.
29. Noguchi Y, Sano M, Kanamaru K, Ko T, Takeuchi M, Kato M, Kobayashi T: Genes regulated by AoXlnR, the xylanolytic and cellulolytic transcriptional regulator, inAspergillus oryzae.Appl Microbiol Biotechnol 2009,85:141–154.
30. Stricker AR, Steiger MG, Mach RL:Xyr1 receives the lactose induction signal and regulates metabolism in Hypocrea jecorina.FEBS Lett2007, 581:3915–3920.
31. Latgé JP:The cell wall: a carbohydrate armour for the fungal cell. Mol Microbiol2007,66:279–290.
32. Schreiber G, Kolar H, Foisner R, Kubicek CP:Choline stimulates synthesis of extracellular proteins inTrichoderma reesei.Arch Microbiol1986,144:41–47. 33. Glenn M, Ghosh A, Ghosh BK:Subcellular fractionation of a
hypercellulolytic mutant,Trichoderma reeseiRut-C30: localization of endoglucanase in microsomal fraction.Appl Environ Microbiol1985, 50:1137–1143.
34. Kanki T, Klionsky DJ, Okamoto K:Mitochondria autophagy in yeast. Antioxid Redox Signaling.2011,14:1989–2011.
35. Xie Z, Klionsky DJ:Autophagosome formation: core machinery and adaptions.Nat Cell Biol2007,9:1102–1109.
36. Cheong H, Nair U, Geng J, Klionsky DJ:The Atg1 kinase complex is involved in the regulation of protein recruitment to initiate sequestering vesicle formation for nonspecific autophagy inSaccharomyces cerevisiae. Mol Biol Cell2008,19:668–681.
37. Kabeya Y, Kamada Y, Baba M, Takikawa H, Sasaki M, Ohsumi Y:Atg 17 functions in cooperation with Atg1 and Atg13 in yeast autophagy. Mol Biol Cell2005,16:2544–2553.
38. Nitsche BM, Burggraaf-van Welzen AM, Lamers G, Meyer V, Ram AF: Autophagy promotes survival in aging submerged cultures of the filamentous fungusAspergillus niger.Appl Microbiol Biotechnol2013. Epub ahead of print.
39. Chen YL, Gao Y, Zhang KQ, Zou CG:Autophagy is required for trap formation in the nematode trapping fungusArthrobotrys oligospora. Environ Microbiol Rep2013,5:511–517.
40. Duan Z, Chen Y, Huang W, Shang Y, Chen P, Wang C:Linkage of autophagy to fungal development, lipid storage and virulence in Metarhizium robertsii.Autophagy2013,9:538–549.
41. Heller J, Tudzynski P:Reactive oxygen species in phytopathogenic fungi: signaling, development, and disease.Annu Rev Phytopathol2011,49:369–90. 42. Brun S, Malagnac F, Bidard F, Lalucque H, Silar P:Functions and regulation of the Nox family in the filamentous fungusPodospora anserina: a new role in cellulose degradation.Mol Microbiol2009,74:480–496. 43. Montero-Barrientos M, Hermosa R, Cardoza RE, Gutiérrez S, Monte E:
Functional analysis of the Trichoderma harzianum nox1 gene, encoding an NADPH oxidase, relates production of reactive oxygen species to specific biocontrol activity againstPythium ultimum.Appl Environ Microbiol2011,77:3009–3016.
44. Xu G, Goodell B:Mechanisms of wood degradation by brown-rot fungi: chelator-mediated cellulose degradation and binding of iron by cellulose.J Biotechnol2001,87:43–57.
45. Arantes V, Milagres AM, Filley TR, Goodell B:Lignocellulosic polysaccharides and lignin degradation by wood decay fungi: the relevance of nonenzymatic Fenton-based reactions.J Ind Microbiol Biotechnol2011,38:541–555.
46. Metz B, Seidl-Seiboth V, Haarmann T, Kopchinskiy A, Lorenz P, Seiboth B, Kubicek CP:Expression of Biomass-Degrading Enzymes Is a Major Event during Conidium Development inTrichoderma reesei.Eukaryot Cell2011, 10:1527–1735.
47. Thomas-Chollier M, Sand O, Turatsinze JV, Janky R, Defrance M, Vervisch E, Brohée S, van Helden J:RSAT regulatory sequence analysis tools. Nucleic Acids Res2008,1:119–127.
48. Pfaffl MW, Horgan GW, Dempfle L:Relative expression software tool (REST) for group-wise comparison and statistical analysis of relative expression results in real-time PCR.Nucleic Acids Res2002,30:e36. 49. Ruxton GD:The unequal variancet-test is an underused alternative
to Student’st-test and the Mann–Whitney U test.Behav Ecol2006, 17:688–690.
50. Kubicek CP:Release of carboxymethyl-cellulase andβ-glucosidase from cell walls ofTrichoderma reesei.Eur J Appl Microbiol Biotechnol1981, 13:226–231.
doi:10.1186/1754-6834-6-127
Cite this article as:Bischofet al.:Comparative analysis of the
Trichoderma reeseitranscriptome during growth on the cellulase inducing substrates wheat straw and lactose.Biotechnology for Biofuels
20136:127.
Submit your next manuscript to BioMed Central and take full advantage of:
• Convenient online submission
• Thorough peer review
• No space constraints or color figure charges
• Immediate publication on acceptance
• Inclusion in PubMed, CAS, Scopus and Google Scholar
• Research which is freely available for redistribution