Social Context and Decisions
Essays in Experimental Economics
N
IVESD
ELLAV
ALLESchool of Social Sciences
U
NIVERSITY OFT
RENTOA dissertation submitted to the Doctoral School of Social Sciences in partial fulfilment of the requirements of the DOCTOR OF PHILOSOPHY (Ph.D) degree in Economics and Management
The assessment committee consists of Prof. Maria Vittoria Levati from the University of Verona and Prof. Shaul Shalvi from the University of Amsterdam.
A
BSTRACT
H
umans are social animals who evolved to live in societies. They are "encultured" actors as their preferences, perceptions and values are shaped by the social context to which they are exposed. Part of economic failures is due to suboptimal social contexts which determine individuals’ decisions. These social contexts can be better designed by organizations and governments.The ultimate goal of this research is to emphasize that social context can be detri-mental for individual decisions, providing empirically-based behavioral insights for policy makers who wish to implement regulatory policies on corruption, gender gap and injustice.
Behavioral and Experimental Economics provides a clean tool to keep the internal validity necessary to disentangle complex behavioral aspects that cannot be easily observed in the field, such as those related to the influence of social environment.
This Doctoral Thesis is a collection of three laboratory experimental essays about the interplay between suboptimal social contexts and decisions. The first Chapter in-vestigates the role of group identity in unethical decisions motivated by unfairness. The second Chapter provides evidence of gender stereotype in perceptions of others’ risk attitudes. The third Chapter shows that small contextual changes can promote the diffusion of corruption while others inhibit it.
Keywords: Laboratory Experiment; Behavioral Economics; Experimental Economics; Group Identity; Fairness; Dishonesty; Risk Preferences; Gender Stereotype; Group Dis-honesty; Punishment; Conflict of Interest; Loss Aversion
A
CKNOWLEDGEMENTS
T
his Doctoral Thesis represents the end of a journey that dates back farther than the time I entered the PhD programme in November 2013. Since I arrived in the enchanting town of Trento, I have met many people that guided me along an incredible growth process and enabled me to produce this work.I am deeply thankful to my supervisor Dr. Matteo Ploner, who has been teaching me that every goal is within reach if we just keep trying (climbing) while being mentally balanced.
I am grateful to prof. Luigi Mittone for introducing me to the world of applied research and believing in me.
I am thankful to prof. Marco Piovesan, who taught me the passion for Behavioral Economics and doing research.
I am also thankful to prof. Morten Lau, who taught me how to be a rigorous researcher. I am grateful to prof. Enrico Zaninotto, for always supporting me and making me meet prof. Joseph Stiglitz.
Special thanks go to Marco Tecilla, Dominique Cappelletti, Marco Faillo, M.Laura Frigotto, Sandro Casal, Marianna Baggio, Natalia Montinari, Amalia Di Girolamo, all the members of the CEEL, and the research brothers Ali, Chiara, Kaku, Sara, Piero, Tam, Mario, Lucio, Maria, Maggie, Francesco, Alice, Costanza and Tatiana, who constantly supported (and tolerated) me: I would not be the researcher I am now without you.
I am grateful to Caleb and Ella Cox, Valeria, Orsola, and my officemates Olga and Helene for making my stay in Durham and Copenhagen colorful.
It would have been impossible to grow during these years without my second family: Alessia, Carlotta, Azzurra, Ananya, Rosaria, Julia, the family Moser and all the friends from the College of Merit.
I want to thank the members of the Ciurma, Luigi, Anne, Anna Maria, Claudia, Matteo and Lucìa for their friendship no matter the distance. I am grateful to my favorite mathematicians Laura and Valeria for teaching me more than climbing. It would be impossible to mention all the other friends and people met during these years. I gratefully thank all of them.
T
ABLE OF
C
ONTENTS
Page
List of Tables xi
List of Figures xiii
Introduction 1
1 Reacting to Unfairness:
Group Identity and Dishonest Behavior 5
1.1 Introduction . . . 6
1.2 Relevant Literature and Hypotheses . . . 8
1.3 Method . . . 11
1.3.1 Stage 1: Real-Effort Task . . . 12
1.3.2 Stage 2: Group Identity . . . 12
1.3.3 Stage 3: Dictator game . . . 13
1.3.4 Stage 4: Questionnaire . . . 14
1.4 Results . . . 15
1.4.1 Fairness . . . 15
1.4.2 Perceptions of Fairness . . . 17
1.4.3 Dishonesty . . . 19
1.4.4 Is dishonesty influenced by unfair decisions? . . . 20
1.5 Conclusions . . . 23
2 Perceptions of others’ Risk Attitude and Gender Stereotype 27 2.1 Introduction . . . 28
2.2 Existing literature . . . 29
2.3 Experimental Design . . . 33
2.3.2 Eliciting beliefs about risk attitude of others . . . 34
2.4 Statistical Model . . . 36
2.4.1 Expected Utility Theory . . . 36
2.4.2 Rank Dependent Utility Theory . . . 37
2.5 Results . . . 38
2.5.1 Aggregate Results . . . 38
2.5.2 Structural coefficients . . . 39
2.5.3 Analysis of Prediction Bias . . . 41
2.6 Conclusions . . . 44
3 Honesty under Threat 45 3.1 Introduction . . . 46
3.2 Method . . . 48
3.3 Experiment 1 . . . 50
3.3.1 Results . . . 51
3.3.2 Discussion . . . 59
3.4 Experiment 2 . . . 60
3.4.1 Results . . . 61
3.4.2 Discussion . . . 66
3.5 Experiment 3 . . . 67
3.5.1 Results . . . 68
3.5.2 Discussion . . . 72
3.6 Personality Traits and Risk Preferences . . . 73
3.7 General Discussion and Conclusions . . . 76
Conclusions 79 A Appendix A 81 A.1 Dictator’s Dishonest Behavior . . . 81
A.2 Robustness Check . . . 83
A.3 Screenshots from the experiment . . . 84
A.4 Instructions (translated) . . . 87
A.5 On-screen Questionnaire . . . 90
B Appendix B 95 B.1 Robustness Check . . . 95
TABLE OF CONTENTS
B.3 Instructions . . . 99
C Appendix C 109
C.1 Instructions . . . 109 C.1.1 Decision screens . . . 113
L
IST OF
T
ABLES
TABLE Page
1.1 Violation of proportionality . . . 15
1.2 Perceptions of fairness . . . 17
1.3 Perception of fairness . . . 18
1.4 Recipients’ self-reported values (Ordered Probit regression) . . . 22
2.1 Statistical Model of Risk Aversion under EUT . . . 40
2.2 Statistical Model of Risk Aversion under RDU . . . 41
2.3 Prediction Bias . . . 43
3.1 Random individual effect probit regression analysis of Double decisions: Second- Party and Third-Party Punishment . . . 58
3.2 Random individual effect probit regression analysis of Punishment decisions 59 3.3 Payoff scheme in Conflict of Interest . . . 61
3.4 Random individual effect probit regression analysis of Double decisions: Con-flict of Interest . . . 67
3.5 Baseline and Loss frame payoff schedule and final profit . . . 68
3.6 Random individual effect probit regression analysis of Double decisions: Loss Frame . . . 73
3.7 Individual Random Effect Tobit model: Player A and Player B Report . . . . 76
3.8 Random Effect Individual Probit model: Double decision . . . 77
A.1 Dictators’ self-reported values (Ordered Probit regression) . . . 82
A.2 Recipients’ self-reported values (Tobit regression) . . . 83
B.1 Prediction Bias: Tobit Model . . . 95
B.2 Left Prospect Parameters . . . 97
L
IST OF
F
IGURES
FIGURE Page
1.1 Dictators: Contributions and Claims . . . 16
1.2 Self-reported numbers . . . 19
1.3 Self-reported numbers and unfairness . . . 21
2.1 Individual choices and Predictions . . . 39
2.2 Individual choices and Predictions by predictors’ gender . . . 42
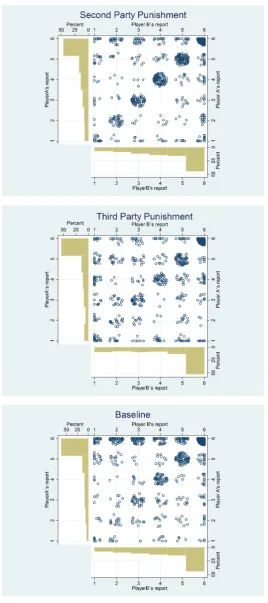
3.1 Second Party and Third Punishment - Baseline . . . 53
3.2 Decisions by Groups Across Periods: Baseline . . . 55
3.3 Decisions by Groups Across Periods: Second Party Punishment and Third Party Punishment . . . 56
3.4 Punishment: Doubles over period . . . 57
3.5 Conflict of Interest and Decision Assuming Honesty - Baseline . . . 63
3.6 Distribution of Doubles in Baseline and Conflict of Interest . . . 64
3.7 Decisions by Groups Across Periods: Baseline and Conflict of Interest . . . 65
3.8 Conflict of Interest: Doubles over period . . . 66
3.9 Loss Frame - Baseline . . . 69
3.10 Decisions by Groups Across Periods: Baseline and Loss Frame . . . 71
3.11 Loss Frame: Doubles over time . . . 72
3.12 Average report by A and B by treatment . . . 74
3.13 Percentage of doubles per treatment . . . 75
A.1 Real Effort Task . . . 84
A.2 Group Identity: Guess Task. . . 84
A.3 Group Identity: Group Assignment. . . 85
A.4 Group Identity: Proverb task. . . 85
A.6 Dishonesty task. . . 86
B.1 Example of on-screen prospects . . . 100
B.2 Example of on-screen prospects . . . 101
B.3 Example of on-screen prospects . . . 102
C.1 Example on-screen Instructions . . . 111
C.2 Control questions . . . 112
C.3 Player A enters the report at Period 4 . . . 113
C.4 After Player B has made the decision, Player A has the option to punish Player B . . . 113
I
NTRODUCTION
"[it] is not the consciousness of men that determines their being, but on the contrary it is their social being that determines their consciousness" (Marx, 1904)
"I did not know myself at all, I did not have any reality as my own, I was in a state like continuous illusion, almost fluid and malleable; the others knew me, each according to which reality they gave me" (Pirandello, 1926)
H
umans are social animals who live in communities of individuals. Every individ-ual’s starting point in society is the outcome of a lottery, which is a matter of good or bad "fortune" (Rawls, 1971). In particular, every individual is exposed to a random social environment, such as the family into which she is born and the city in which she spent most of her life. Part of individuals’ goals and values are not innate, but evolved in the social context to which they are exposed.A well-educated family might raise the offsprings to pursue long-term goals more than a poor family. The latter might, instead, be forced to promote an education that centralizes short-term benefits: entering the workforce soon might allow the whole family to earn the money necessary to satisfy basic needs, while going to school might lead the whole family to losses. Being exposed to an environment in which resources are scarce shifts preferences toward immediate rewards (Sturge-Appleet al., 2016). Living in a neighbourhood characterized by a culture of organized crime affects individuals’ everyday life and their interactions with others: the threat of being punished for not conforming to the norms of the community has a detrimental effect on pro-social behavior, like trust and cooperativeness (Meieret al., 2016; Neseet al., 2013). Being surrounded by pervasive corruption shapes individuals’ perceptions of ethical values, as individuals might view dishonesty as normal and justifiable (Gächter & Schulz, 2016). Being denied the access to the workforce shapes perceptions of fairness: to avoid cognitive dissonance from being unable to find a job, individuals change the way they acknowledge earned entitlement (Barret al., 2016).
social context may further sustain those social patterns (Bowles, 1998; Hoff & Stiglitz, 2016).
Economists have traditionally assumed that individuals have stable preferences, associating any change in behavior to changes in predictable factors, like information and prices. Behavioral Economics challenges this view by engaging with the application of psychological insights to economic analysis, and unveiling a realistic picture of individual preferences. Extensive investigation in Behavioral Economics has shown that individual preferences are not stable, but distorted by universally shared biases, such as anchoring, framing and endowment effects, that the context of the moment of decision makes salient (Tversky & Kahneman, 1975). Only recently Behavioral Economics has started incorporating insights also from sociology and anthropology, wherein decision makers are seen as "encultured actors" (Hoff & Stiglitz, 2016). This strand of Behavioral Economics acknowledges the durable influence that social context has on behavior, preferences and perceptions. Not only social context influences behavior by making certain cultural mental models1 or reference points salient , but it also shapes who people are. Some societies are trapped into social and economic failures because, on the one hand, they make salient suboptimal mental models and, on the other hand, they are sustained by individuals’ conformity to those suboptimal mental models.
The ultimate goal of this work is to emphasize that exposure to social contexts that make suboptimal mental models salient directly affects individual preferences, perceptions and values. This research aims to provide empirically-based behavioural insights for policy makers and organizations who wish to regulate corruption, gender gap and injustice. Experiencing episodes of unfairness, being surrounded by an environment that does not allow to increase welfare other than through corruption, and living in a gender-unequal society are the three examples of exposure to suboptimal social contexts that are investigated in this Doctoral Thesis.
The first Chapter is based on the working paper "Reacting to Unfairness: Group Identity and Dishonest Behavior" with Matteo Ploner. It investigates a social context in which individuals experience unfairness and the role that group identity plays in medi-ating unethical decisions. Experimental evidence suggests that experiencing unfairness motivates individuals to engage in unethical behavior. We conduct a laboratory experi-ment where we investigate how group identity changes perceptions of unfairness and, thus, unethical decisions motivated by experiences of unfairness. We define unfairness as deviation from proportionality in a real-effort dictator game. We base our hypotheses on the Social Identity Theory (Tajfelet al., 1971) and evidence from neuroscience (Baum-gartneret al., 2013). Group Identity induces individuals to interpret unfairness made by an in-group differently from that made by an out-group. While individuals tolerate ingroup-unfairness, they react to out-group unfairness more than when unfairness is made by an individual without a salient group identity. Our findings show that sharing a group identity makes salient a mental model that changes perceptions of unfairness and prevents individuals to engage in unethical behavior motivated by unfairness. On the 1"(Cultural mental models) shape the way we attend to, interpret, remember, and respond emotionally
other hand, when the context allows for conflicting group identities to exist, individuals become more sensitive to experiences of unfairness and, in turn, more prone to engage in fairness-restorative unethical behavior. The implications of these findings for organi-zations and institutions are that failing to build a shared identity is likely to promote negative externalities on society: experiencing unfairness from someone with different values leads individuals to react by engaging in unethical behavior at cost of society.
I started working on the project for the second Chapter "Perceptions of others’ Risk Attitude and Gender Stereotype", co-authored with Morten I. Lau and Caleb Cox, during my stay at Durham Business School. We conducted an incentivized laboratory experiment to investigate the role that mental models, such as gender stereotype, play on individual risk attitudes and perceptions of others’ risk attitudes. The stereotype that women are more risk averse than men is cued by the salience of a stereotyped information, such as gender, and helps conceptualizing a situation, like that in which individuals have to make decisions based on their perceptions of others’ risk attitudes. Whether women (men) are in fact more risk averse (taking) than men (women) is still an open question in the literature, and decisions based on this stereotype might provide the basis for inaccurate statistical discrimination. To this aim, we investigate gender difference in risk attitudes and gender stereotype in perceptions of others’ risk attitudes. By structurally estimating the risk attitude coefficients underlying two alternative latent models of choice, we find no gender difference in risk attitudes. On the other hand, we find that males use gender salience to stereotype others’ risk attitude: females are perceived to be more risk averse than they actually are. This finding is of practical relevance for job employers who wish to give promotions, as they might base their choices on stereotypes that create statistical discrimination.
monitoring. On the other hand, corruption slows down if the incentive scheme that rewards individuals in the group embeds inequality.
C
H
A
P
T
E
R
1
R
EACTING TO
U
NFAIRNESS
:
G
ROUP
I
DENTITY AND
D
ISHONEST
B
EHAVIOR
with Matteo Ploner - University of Trento
E
mployees’ misbehavior can be attributed to experiences of unfairness. Does this dishonest reaction change when employees identify with the whole organization or with a subunit only? We experimentally investigate whether individuals are more likely to engage in dishonest behavior after having experienced unfairness perpetrated by an individual with a salient group identity. Two individuals generate an endowment together, but only one can decide how to share it. They either share the same group identity or have distinct group identities. Then, they approach a task in which they can opportunistically engage in dishonest behavior. Our results show that when individuals share the same group identity, unfair distributive decisions do not trigger a dishonest reaction. In contrast, when different group identities coexist, dishonest behavior is observed as a reaction to unfairness.Keywords: Group Identity, Fairness, Dishonesty
1.1
Introduction
The general press often reports episodes of dishonest behavior: overstated value of claims to insurance companies, consumers led to fraud through misadvice, intellectual property theft, tax evasion. These are only a few examples of dishonest actions which cost huge losses to society (Mazar & Ariely, 2006). Given the economic relevance of the consequences of such a behavior, scholars from psychology and economics have extensively examined their driving factors and the potential tools for limiting them. Individuals might decide to engage in dishonest behavior when they are given the opportunity. They might decide to take advantage of contexts in which the probability to be detected is low, but they might also prefer to give up the additional profit when this is associated to a violation of moral rules. These decisions have been widely investigated in the literature, as we review in the dedicated session. But individuals can also opt to behave dishonestly as a reaction to decisions made by other individuals. When employees perceive decisions to be unfair, they become more willing to engage in dishonest behavior, viewed as a way to balance perceived unfairness (Hollinger & Clark, 1983). An employee might be unable to sanction an unfair supervisor and attempt to restore fairness by increasing dishonest behavior outside organizational borders.
Organizations are communities of individuals that rely on the establishment of a culture that regulates social interactions. Managers can promote the diffusion of a corpo-rate culture with the aim of making employees share the same goals and values. Prior research shows that corporate culture is crucial to foster employees’ sense of identifica-tion in the organizaidentifica-tion and to boost employees’ productivity and commitment toward the organization (Akerlof & Kranton, 2005). But there are also potential drawbacks to high levels of organizational identification. First, the establishment of a strong group identity might promote tolerance towards unfair behavior to not undermine the positive perception of the group to which belonging. Second, modularity in the organizational structure might encourage the development of “local” identities with different values and goals. Therefore, between-units decisions might not be equally embraced across the organization. The establishment of diverse group identities within the same organization might promote the diffusion of negative externalities associated to unfair decisions made by a supervisor belonging to a different unit. It is hard to justify unpopular decisions made by a supervisor with different values and goals; therefore, dishonest behavior is likely to emerge to restore fairness outside organizational borders.
1.1. INTRODUCTION
behavior at cost of society when corporate culture is not equally shared within subunits and divisions. In our study, we specifically investigate the decision to react dishonestly after experiencing a supervisor’s unfair action, and the extent to which this decision is mediated by her group identity. We depict the typical organizational context in which employees cannot react against the unfair supervisor, but they can engage in dishonest behavior against society, such as by not buying the bus ticket. We address how one’s decision to behave dishonestly (e.g., taking advantage from misreporting) is driven by unfair decisions made an individual who shares the same or a different group identity.
Throughout the study, we adopt the concept offairness-restorativedishonest behavior to identify the reaction to unfairness caused by another individual. Individuals might engage in dishonest behavior when they are given the opportunity to increase their material well-being. However, they might be even more willing to act dishonestly when they experience unfair decisions they cannot tolerate.
We investigate how group identity enters the way unfairness is tolerated and, there-fore, how it mediatesfairness-restorativedishonest behavior. We mimic the scenario in which two employees work for the organization, but only one has the power to distribute wages. If the least powerful employee perceives the distribution as unfair, she might feel the need to restore fairness. Since she has no power to restore fairness by directly pun-ishing the counterpart, she might increase her dishonest behavior outside organizational borders.
In our experiment, participants are paired in couples and receive a payoff based on the counterpart’s decision in a real-effort dictator game, an ideal setting to impose unfairness on recipients and to induce a shared view of fairness across participants. In particular, prior studies show that dictators allocate unfairly even when they agree on which is the fair allocation (Konow, 2000; Dengler-Roscher et al., 2015) and that the act of exerting effort elicits a shared view of fairness in the proportionality principle (Cappelenet al., 2014). Then, participants are given the opportunity to increase their payoff by engaging in a self-report task which is costly to the experimenter but not to the counterpart. In the baseline condition, participants in the couple are only labeled as recipient and dictator. In theIN condition, participants in the couple know that they share the same group identity. In theOUTcondition, participants in the couple identify with two different groups. To induce group identification, we rely on a modified version of Tajfelet al.(1971)’s minimal group paradigm. This way, we investigate recipients’ degree of dishonest reactions to dictators’ decisions when group identity varies.
when individuals share the same group identity. On the other hand, dishonest behavior is significantly affected by unfair decisions made by individuals with a conflicting group identity. Thus, allowing for the coexistence of diverse group identities within organiza-tions leads individuals to be more sensitive to unfair decisions and to react by increasing their dishonest behavior at cost of society to restore fairness.
Additionally to highlighting a novel mechanism underlying dishonest behavior, our study is of practical relevance to organizations characterized by a decentralized structure. For example, organizations which fail to develop a shared corporate culture across divisions might create the basis for negative externalities on society: employees who cannot tolerate decisions made by a supervisor from a division they find hard to identify with, might be willing to engage in dishonest behavior outside organizational borders to restore fairness. For these organizations, it might be preferable to promote the diffusion of one identity by favoring the interaction between employees from different units and subgroups.
1.2
Relevant Literature and Hypotheses
For being substantially costly to organizations and society, dishonest behavior has received increasing attention by scholars from psychology and economics. The standard economic approach to dishonesty has been shaped by the strict consequentialist logic put forward by the seminal contribution of Becker (1968): people cheat only when the expected benefits of dishonest behavior (e.g., saving money) outweigh its expected costs (e.g., being caught). Experimental evidence shows that the decision to behave dishonestly to maximize earnings is, in fact, influenced by contexts poor of monetary or reputation sanctions (see, among others, Fischbacher & Föllmi-Heusi, 2013; Ploner & Regner, 2013). However, recent research in economics has shown that dishonest behavior is not only driven by expected consequences (Gneezy, 2005; Mazaret al., 2008; Erat & Gneezy, 2012; Abeleret al., 2014), but also by history and context (Gino & Pierce, 2010b; Houseret al., 2012; Shalviet al., 2015).
1.2. RELEVANT LITERATURE AND HYPOTHESES
cuts, they engage in inventory theft. According to Ambroseet al.(2002), when people perceive income distributions as unfair, they engage in sabotage behavior in the attempt to restore equity.
Contextual elements seem to play a fundamental role in shaping fairness perceptions. In particular, they are influenced by the underlying allocation process and the idiosyn-cratic features of those affected by that allocation (Konow, 2003). Other studies (Gino & Pierce, 2009, 2010a,b; Johnet al., 2014) report that individuals perceive unfairness in wealth disparities due to different initial endowments and different pay-schemes.
A few studies investigated dishonest behavior as a consequence of experiences of unfairness. In the context of a bargaining game, Ellingsen et al. (2009) report that individuals increase their dishonest behavior after experiencing negative actions from their counterpart. In this study, dishonest behavior is costly to the counterpart. Similarly, Alempaki et al.(2016) investigate deception as a reciprocity device when individuals experience unkind actions from their counterparts in a dictator game. Houser et al. (2012) investigate the decision to cheat after individuals participate in a dictator game. In their experiment, cheating is costly to the experimenter. Our study builds on Houser et al.(2012)’s setting. We investigate the decision to engage in dishonest behavior which is costly to the experimenter. Differently from Houser et al. (2012), we do not endow participants with windfall money, but we ask them to exert effort as in the case of employees. This way, we mimic the situation in which the least powerful employees are not able to react to unfairness by directly punishing the unfair supervisor, but their dishonest behavior is unlikely to be detected outside the organization while being costly to society.
We add to this stream of research by examining how a salient group identity affects the extent of tolerance of unfair actions. Whether group identity mediates dishonest be-havior as a reaction to unfairness has not previously investigated. A recent experimental study suggests that, in the context of communication games, group identity mediates deception (Ronget al., 2016). However, deception is not considered as a device to restore fairness. Employees might be more willing to tolerate unfair decisions when they are made by a supervisor from the same group. This intuition, motivating our research, originates in Social Identity Theory (SIT) (Tajfelet al., 1971; Turner, 1985), wherein individuals aim to preserve a positive image of their group members because this is part of their own identity.
2005, 2008). A bunch of experimental studies show that individuals tend to cooperate more when interacting with others sharing the same group identity (in-group) (Eckel & Grossman, 2005; McLeish & Oxoby, 2011; Weng & Carlsson, 2015). In contrast, when interacting with members of other groups (out-group), individuals display less cooperation (Charness & Jackson, 2007; McLeish & Oxoby, 2007), coordination (Chen & Chen, 2011; Chen et al., 2014) and other-regarding preferences (Chen & Li, 2009). SIT provides a general framework to understand the roots of such inter-group discrimination. When group identity is made salient, the perception of our self-concept changes and also our behavior changes accordingly: we tend to favor the members of our group, while discriminating against those who belong to another group (Ballietet al., 2014).
Studies by Kollock (1998); Goette (2006) and Chen & Li (2009) find that individuals tolerate ingroup unfairness more than outgroup one. In contrast, McLeish & Oxoby (2007, 2011) and Weng & Carlsson (2015) find that ingroup unfairness breeds stronger punishment than outgroup unfairness. Similar to these studies, ours investigates sit-uations in which tolerance of unfair decisions might be mediated by group identity. However, our specific focus is not on reactions against the unfair counterpart, such as second-party punishment, but on a type of reaction that creates negative externalities outside organizational borders:fairness-restorativedishonest behavior.
As a measure of fairness of one’s behavior, we refer to the proportionality between the amount contributed in the real-effort DG and the amount claimed by the dictator: the closer the amount claimed to the amount contributed, the higher the degree of fairness. Proportionality between inputs and outputs is at the cornerstone of equity theory (Adams, 1965; Homans, 1958; Walster et al., 1973) and of the accountability principle (Konow, 1996). In the following, we refer to this concept of fairness as the proportionality principle.
1.3. METHOD
Prediction 1. OUT-group
Compared to the Baseline, the stronger the violation of the proportionality principle by an outgroup individual, the higher the likelihood to engage infairness-restorative
dishonest behavior.
When individuals share the same group identity (IN), we expect to observe a different pattern. In order to preserve positive beliefs about their group identity and, thus, to avoid cognitive costs associated to self-concept updating, individuals may interpret unfair decisions made by a group member as not unfair. Experiencing unfair decisions made by a group member is likely to prompt self-deception about the real nature of the offer. In particular, individuals interpret unfairness generated within the group through a mentalizing bias (Baumgartneret al., 2013). This leads to the following prediction
Prediction 2. IN-group
Compared to the Baseline, the stronger the violation of the proportionality principle by an ingroup individual, the lower the likelihood to engage infairness-restorative
dishonest behavior.
In the next session, we describe the experimental design we adopted to test our hypotheses.
1.3
Method
Our experiment is designed to investigate dishonest behavior as a device to restore fairness when different group identities are salient. At this aim, we rely on the minimal group paradigm (MGP) (Tajfelet al., 1971). We conduct three variants of group identity. In particular, we vary whether no group identity is salient (BASE), whether individuals share the same group identity (IN), and whether individuals do not share the same group identity (OUT).
The experiment was programmed and behaviored using z-Tree software (Fischbacher, 2007)1. Upon their arrival to the laboratory, participants were randomly allocated to cubicles and asked to privately read the instructions2. A member of the staff read aloud the instructions and answered doubts about the experimental procedure. Before starting the experiment, participants had to answer six control questions checking their understanding of the instructions. Participants received on averageAC9.50 in addition to a show-up fee ofAC3. Each session lasted on average 1 hour and 30 minutes.
A total of 192 students took part in the experiment. 64 were assigned to the IN condition and 68 to the OUT condition. The remaining 60 participated to the Baseline condition. In all three conditions half participants were randomly assigned to the Dictator role and the other half to the Recipient role.
1.3.1
Stage 1: Real-Effort Task
In the first stage, participants were presented with a task that generates a part of their final earning. The task is a modified version of Gill & Prowse (2012)’s real effort slider task. Participants were asked to position a set of sliders at a correct location on the screen, within 240 seconds. Sliders were presented in blocks of 6, with correct locations randomly defined by the computer. Before starting, all sliders were randomly aligned, to avoid visual learning effects. Participants generatedAC1 for each block correctly solved. We adopted this procedure to ensure that participants shared the same perception of fairness. Evidence suggests that the mere act of exerting effort leads individuals to perceive fairness in proportional distributions (Cappelen et al., 2014). While Houser et al.(2012) endow dictators with windfall money, we designed this task to prime shared perceptions of fairness in proportional distributions. Throughout the study, we refer to Konow (1996)’s definition of fairness (i.e.,equity(Adams, 1965; Homans, 1958; Walster et al., 1973)) as theproportionality principle: a fair distribution is one proportional to the variables that affect production and that individuals can control (i.e., work effort).
1.3.2
Stage 2: Group Identity
Participants inINandOUTconditions were presented with a task based on the MGP. This task enables to make salient a group identity. First, participants were asked to guess a number∈{1,2,...,99} randomly drawn by the computer. According to their guess,
1Screenshots from the experiment are available in Appendix A.
1.3. METHOD
they were either allocated to one color group (Red) or to another color group (Yellow). Specifically, those whose guess was closer to the randomly drawn number were assigned to one group and those who were farther to another group. Participants were only told that those in their color group were matched according to the similarity criterion just presented3. Second, to strengthen “common fate” feelings - a major constituent of group identity - we asked participants who were assigned the same color to take part in a collective task4. Subjects were shown a screen containing a set of unordered pieces of words and were asked to combine them to form a proverb. Participants received an additionalAC1 if their color group was the fastest in completing the task. To determine which of the two groups was the fastest, individual time records of those in the group were summed up. To test the effectiveness of group identity manipulation, participants were asked to evaluate their perception of similarity with participants affiliated to the same and the other color groups. Answers were reported both on a Likert scale and in a self/other task similar to that adopted by Saniet al.(2007).
In theBASEcondition, participants only played the proverb task and they were told that they had the opportunity to win an additionalAC1 in the case they were among the fastest half of session participants. All references to group colors were omitted.
1.3.3
Stage 3: Dictator game
In the third stage, each participant was randomly assigned to either the role of dictator or that of recipient and paired with another participant in the other role. Those assigned to theIN condition were informed that they belonged to the same group (Red/Red or Yellow/Yellow). Participants assigned to the OUT condition were informed that they belonged to different groups (Red/Yellow or Yellow/Red). In these conditions, both players shared common knowledge of group membership. Participants assigned to the BASE condition were only informed about their roles. The dictator was asked to allocate between herself and the other the sum that they generated in theEarningsstage, which was also of common knowledge by both players.
Our modified dictator game is the ideal setting to induce dictators to make unfair 3We did not disclose to participants whether they belonged to the closer or farther group to avoid
possible entitlement feelings among those guessing better. Furthermore, we chose a trivial task to avoid potential biases in group composition when the discrimination criterion correlates with unobservable features.
4In contexts where group identity is imposed on existing one, as it happens in the laboratory, the
decisions against recipients. Previous studies on allocation choices document that individ-uals claim more than what they earned when they have a personal stake in the decision outcome (Konow, 2000; Cherryet al., 2002), although they recognize that proportional claims are the fair ones (Dengler-Roscher et al., 2015). Therefore, by claiming non-proportional offers of a co-produced outcome, dictators force recipients into an experience of unfairness.
1.3.4
Stage 4: Questionnaire
TheQuestionnairestage consists both of non-incentivized self-reported answers and of in-centivized answers. For what concerns the former, we asked participants to answer a sur-vey about subjective perceptions of fairness in the allocation task and socio-demographic characteristics. For the latter (Social Norm Task), we asked participants to rate in terms of social appropriateness a hypothetical scenario that recalls a dictator game exploiting a task based on Krupka & Weber (2013)5. This way, we obtained a measure of the shared perceptions of fairness across participants.
Finally, we provided participants with a self-report task apt to elicit dishonest behav-ior via untruthful reports (Dishonesty task). Previous studies elicited dishonest behavior by looking at self-reported task score (Mazar et al., 2008; Cadsby et al., 2010) or at outcomes of a random event (Bucciol & Piovesan, 2011; Houser et al., 2012; Fischbacher & Föllmi-Heusi, 2013; Ploner & Regner, 2013). We elicited dishonest behavior with a novel method similar to that of Gillet al.(2013). They asked subjects to report the last digit of their best friend’s number to obtain a more precise distribution of dishonesty degree. We asked to self-report the last digit of the last call they made being aware that they are going to earnAC0.50 times the number reported (i.e., maximum earnings are obtained when the last call ends with 9)6. While participants were free to report the value without any control from our side, we invited them to check the call list on their mobile phone. This way, we reduced any potential contextual ambiguity that may lead individuals not to perceive that they are lying (Shalviet al., 2015).
5In Krupka & Weber (2013) the group of subjects answering the question was different from the group
of subjects that played the dictator game.
1.4. RESULTS
1.4
Results
We first analyze dictators’ allocation choices and provide an assessment of shared per-ceptions of fairness among participants. Then, we present results of the dishonesty task and a regression analysis inquiring about determinants of dishonest behavior.
1.4.1
Fairness
Figure 1.1 provides a joint representation of claims by the dictators in theDictator game and outcomes in theReal-Efforttask, in each of the experimental conditions separately.
As the graphs show, dictators’ claims largely violate the proportionality principle, with most of the observations lying above the 45◦line. This is confirmed also by the inter-section between average claims and average contributions, well above the proportionality line in all conditions.
As a measure of the opportunistic stance of dictators, we compute the share of resources of the other appropriated by the dictator. This index of deviation from propor-tionality is computed asφ=πD−eD
eR , whereπDis the actual payoff claimed by the dictator,
eDis the amount earned by the dictator and eR is the amount earned by the recipient7. Table 1.1: Violation of proportionality
Median Mean SD N
IN 0.464 0.518 0.364 32.000 OUT 0.400 0.388 0.404 33.000 BASE 0.500 0.541 0.356 28.000
The proportionality index is computed as the amount of other’s earnings appropriated relative to other’s earnings (φ=πD−eD
eR ). Whenφ=0, the allocation is fully in line with the proportionality
principle. Whenφ>0, an opportunistic violation of the principle is detected.
As Table 1.1 shows, the largest average (median) violation is observed in condition BASE, followed by IN and OUT. In all conditions the deviations are significantly larger than zero according to a Wilcoxon Signed Rank Test (all p-values<0.001). A series of Wilcoxon Rank Sum Tests shows that differences across experimental conditions are not statistically significant (all p-values>0.125).
Dictators largely violate the proportionality principle and appropriate a considerable amount of resources generated by their counterpart. No significant differences in the degree of violation of the proportionality principle are observed across group conditions.
7All dictators and recipients exerted a positive amount of effort, i.e. completed at least one page, in the
Figure 1.1: Dictators: Contributions and Claims ● ● ● ● ● ● ● ● ● ● ● ● ● ● ● ● ● ● ● ● ● ● ● ● ● ● ● ● ● ● ● ● IN Claim
0 2 4 6 8 10
0 5 10 15 Earnings Claims 5.59 8.53 ● ● ● ● ● ● ● ● ● ●● ● ● ● ● ● ● ● ● ● ● ● ● ● ● ● ● ● ● ● ● ● ● ● OUT Claim
0 2 4 6 8 10
0 5 10 15 Earnings Claims 4.97 7.29 ● ● ● ● ● ● ● ● ● ● ● ● ● ● ● ● ● ● ● ● ● ● ● ● ● ● ● ● ● ● BASE Claim
0 2 4 6 8 10
0 5 10 15 Earnings Claims 4.77 7.63
On the x-axis (Earnings), the amount earned in the slider task. On the y-axis (Claims), the amount claimed in the DG. Points above (below) the45◦line identify claims larger (smaller) than the amount contributed. Average values are reported along the axis. To improve visualization, a small random noise is added to the graph.
1.4. RESULTS
1.4.2
Perceptions of Fairness
Table 1.2 provides a representation of the shared perception of fairness in the popula-tion, as collected in theSocial Normtask. Participants are presented with a scenario resembling a dictator game and asked to assess the degree of social acceptability of each potential allocation.
Table 1.2: Perceptions of fairness Freq (%)
Allocation Average −− − + ++
0|6 -0.312 41.1 25.0 23.4 10.4
1|5 0.420 10.4 18.8 18.2 52.6
2|4 0.250 3.6 17.7 66.1 12.5 3|3 0.299 4.7 22.4 46.4 26.6 4|2 -0.295 22.9 51.0 23.4 2.6 5|1 -0.671 62.0 30.2 4.2 3.6 6|0 -0.861 88.0 6.80 1.6 3.6
The column Allocation reports potential allocations to two individuals, with1|5 being the allocation respecting the proportionality principle (bold font). Participants face four assessments for each allocation: “Very unacceptable” (−−), “Quite unacceptable”(−),“Quite acceptable”(+) and “Very acceptable” (++). Frequency of choice for each of the assessment is reported in the table (Freq %). Similarly, to Krupka & Weber (2013), the column “Average” is computed by assigning values -1, -1/3, 1/3, and 1 to the evaluations of acceptability of the allocation in increasing order of acceptability.
As the table illustrates, the allocation deemed as the most acceptable is the one reflect-ing proportionality (1|5), with an average of 0.420. All other allocations are judged, on average, unacceptable. This result allows us to rule out the possibility that participants engage in dishonest behavior to restore a different fairness criterion from proportionality, such as inequality.
Table 1.3 reports self-reported measures about the perceived fairness of dictator’s choices. Larger values capture a stronger perception of fairness.
Table 1.3: Perception of fairness
Mean(SD) Dictator Recipient BASE
Fair 4.133 (2.145) 3.100 (2.369) Fair|Outcome 3.600 (2.078) 2.633 (2.312) Fair|Effort 3.800 (1.864) 2.367 (2.042)
IN
Fair 4.625 (1.963) 3.125 (2.366) Fair|Outcome 4.500 (2.125) 2.688 (2.132) Fair|Effort 4.875 (1.930) 2.375 (1.963)
OUT
Fair 3.971 (2.249) 3.353 (2.650) Fair|Outcome 3.824 (2.355) 2.882 (2.459) Fair|Effort 3.941 (2.074) 2.676 (2.371)
For dictators (recipients), the row labeledFairrefers to the statement “I feel that I treated the other fairly” (“I feel that the other treated me fairly”). The rowFair|Outcome refers to the statement “I feel that I treated the other fairly given the outcome in the slider task” (“I feel that the other treated me fairly given the outcome in the slider task”). The rowFair|Effortrefers to the statement “I feel that I treated the other fairly given the effort in the slider task” (“I feel that the other treated me fairly given the effort in the slider task”). Answers are collected on a Likert scale 1–7, with 1 meaning “I totally disagree” and 7 meaning “I totally agree”.
conditions given the role, no statistically significant differences are observed (Wilcoxon Rank Sum test, all p-values≥0.110).
To gain insights into the source of feelings of fairness, we compute correlations be-tween average feelings of fairness in the statements of Table 1.3 and the proportionality index of Table 1.1 (Spearman’s rank correlation). We expect to observe a negative correla-tion between the index capturing violacorrela-tions of proporcorrela-tionality and percepcorrela-tion of fairness. The strongest correlation is observed for the dictators in condition OUT (ρ=-0.830), while the lowest correlation is observed for dictators in condition IN (ρ=-0.418).
1.4. RESULTS
Figure 1.2: Self-reported numbers
0 1 2 3 4 5 6 7 8 9
Dictators
0.0
0.1
0.2
0.3
0.4
0.5 IN OUT BASE
Reported Number
Frequency (rel.)
0 1 2 3 4 5 6 7 8 9
Recipients
0.0
0.1
0.2
0.3
0.4
0.5 IN OUT BASE
Reported Number
Frequency (rel.)
Self-reported last digit number of the last phone call made by dictators (leftward panel) and recipients (rightward panel), in each of the three experimental conditions separately. The dashed horizontal line provides a reference for the ideal uniform distribution of values. To improve visualization, a small random noise is added to the graph.
reduce their discomfort by re-assessing the fairness of their behavior.
1.4.3
Dishonesty
Figure 1.2 shows a description of behavior in the dishonesty task embedded in the questionnaire. Larger numbers are associated to higher gains.
also by averages of the distributions, with values ranging from 6.233 (Recipients, BASE) to 7.206 (Recipients, OUT). The central tendency of the distributions is significantly larger than the expected average value of 4.5, in all three conditions and for both roles (Wilcoxon Signed Test, all p-values<0.001).
A comparison of the distributions across experimental conditions for each role shows that there are no significant differences in the central tendencies of the distributions (Wilcoxon Rank Sum Test, all p-values>0.253). When given the opportunity, participants dishonestly manipulate reported numbers to increase their earnings.
1.4.4
Is dishonesty influenced by unfair decisions?
Individuals might report dishonestly not only because of low monitoring, but also because they do not tolerate the unfairness experienced. In particular, we predict that recipients’ dishonest behavior is affected by the unfair dictator’s group identity. At this aim, we look at the relationship between reported values and allocations across group conditions and roles.
Figure 1.3 shows that for dictators, a positive correlation between unfairness and reported values is registered in all conditions, though the relation is not statistically significant (Spearman’s rank correlation, all p-values≥0.113). This suggests that dicta-tors were not affected by the group identity manipulation, but they behaved as unfairly as dishonestly throughout all conditions8. For the recipients, a negative and slightly positive correlation is observed in BASE and IN, respectively. However, these correlations are not statistically significant (all p-values ≥0.581). In contrast, in condition OUT a positive and marginally significant correlation is observed (p-value=0.080).
To address the causal relationship between unfairness and dishonest behavior given different types of salient group identity we run a regression model9. Table 1.4 reports on the outcomes of a regression estimate about determinants of dishonest behavior of those acting as recipients in theDictator game. The dependent variableR e ported.value is given by the integer reported in the dishonesty task described above10. When reports are 8In Appendix A, a discussion of results of an Ordered Probit Regression model of dictators’ dishonest
behavior supports this insight.
9We relied on the randomness of unfair claims by individuals who have been randomly assigned to the
dictator role.
10We employed an Ordered Probit model to account for the heterogeneous attitude individuals display
1.4. RESULTS
Figure 1.3: Self-reported numbers and unfairness
c(−1, 1) c(−1, 1)
c(−1, 1) Dictator c(−1, 1) Recipient c(−1, 1) Base c(−1, 1) Repor ted V alue ● ● ● ● ● ● ● ● ● ● ● ● ● ● ● ● ● ● ● ● ● ● ● ● ● ● ● ● ●
0.0 0.2 0.4 0.6 0.8 1.0
0 2 4 6 8 rho=0.332 (p=0.079) ● ● ● ● ● ● ● ● ● ● ● ● ● ● ● ● ● ● ● ● ● ● ● ● ● ● ● ●
0.0 0.2 0.4 0.6 0.8 1.0
0 2 4 6 8 rho=−0.159 (p=0.418) c(−1, 1) IN c(−1, 1) Repor ted V alue ● ● ● ● ● ● ● ● ● ● ● ● ● ● ● ● ● ● ● ● ● ● ● ● ● ● ● ● ● ● ● ●
0.0 0.2 0.4 0.6 0.8 1.0
0 2 4 6 8 rho=0.321 (p=0.073) ● ● ● ● ● ● ● ● ● ● ●● ● ● ● ● ● ● ● ● ● ● ● ● ● ● ● ● ● ● ● ●
0.0 0.2 0.4 0.6 0.8 1.0
0 2 4 6 8 rho=−0.016 (p=0.932) c(−1, 1) OUT c(−1, 1) Repor ted V alue ● ● ● ● ● ● ● ● ● ● ● ● ● ● ● ● ● ● ● ● ● ● ● ● ● ● ● ● ● ● ● ● ● ●
0.0 0.2 0.4 0.6 0.8 1.0
0 2 4 6 8 rho=0.138 (p=0.437) ● ● ● ● ● ● ● ● ● ● ● ● ● ● ● ● ● ● ● ● ● ● ● ● ● ● ● ● ● ● ● ● ●
0.0 0.2 0.4 0.6 0.8 1.0
0 2 4 6 8 rho=0.324 (p=0.066)
c(−1, 1) c(−1, 1) c(−1, 1)
% Taken of Other's
c(−1, 1)
% Taken of Other's
On the x-axis, the proportionality indexφ=πD−eD
eR . On the y-axis the value reported in the
Dis-honesty task. For dictators, higher values on the horizontal axis imply more unfairness favoring them. Conversely, for recipients higher values on the horizontal axis imply more unfairness damaging them. In each panel, a Spearman’s rank correlationρis presented.
truthful, the dependent variable and explanatory variables are orthogonal. When this is
not the case, we obtain evidence of distorted behavior.
Among explanatory variables, we have dummy variables controlling for group identity conditions: I N is equal to one when the recipient belongs to the same group and zero otherwise;OU T is equal to one when the recipient belongs to the other group and zero otherwise. BASE is the baseline condition.
We enrich the model with fairness-related variables: the proportionality index φ (pro p.ind ex, see Table 1.1) of matched dictator’s choices and the extent according to which proportionality is perceived as appropriate in theSocial Normtask (pro p.norm, see Table 1.2). The interactions between the fairness-related variables and the group experimental conditions are also added. Finally, we consider a few control variables: re port.time (the time in seconds required to report the value); a ge; f emal e, and civic.score (a categorical variable of individuals’ participation to collective activities, such as political parties and NGOs).
Table 1.4: Recipients’ self-reported values (Ordered Probit regression)
(1) (2) (3)
re p.value re p.value re p.value pro p.ind ex 0.011(0.249) -0.57(0.543) 0.648(0.545) pro p.norm -0.187(0.244) -0.637(0.489) -0.681(0.493)
I N -0.365(0.645) -0.466(0.65)
OU T -0.781(0.671) -0.725(0.673)
pro p.ind ex×I N 0.427(0.645) 0.559(0.667) pro p.ind ex×OU T 1.486(0.489)∗ 1.60(0.769)∗∗ pro p.norm×I N 0.352(0.628) 0.374(0.639) pro p.norm×OU T 0.837(0.647) 0.689(0.659)
re port.time 0.00398(0.007)
f emal e -0.2689(0.249)
a ge -0.0144(0.045)
civic.score 0.013(0.111)
Observations 93 93 93
Standard errors in parentheses
∗ p<0.10,∗∗ p<0.05,∗∗∗ p<0.01
An Ordered Probit regression model is adopted to account for the different attitude individuals display when they report increasingly high values.
1.5. CONCLUSIONS
proportionality by the dictator positively impacts on the reported value. This does not happen in BASE and IN11.
The regression analysis shows that experiencing higher unfairness induces more dishonest behavior only in condition OUT: when dictators and recipients belong to different groups, dishonest behavior significantly increases to restore fairness.
1.5
Conclusions
In this study, we investigated dishonest behavior as a way to restore fairness when different types of unfair individuals’ group identity are salient. We ran a laboratory experiment to mimic the situation in which two employees work for the same organi-zation but only one can control the joint allocation of rewards. In this situation, the employee facing unfairness cannot directly react against the unfair supervisor, but she can react opportunistically outside the organization, without any credible threat of being sanctioned. We find that unfair individuals’ group affiliation significantly affects the likelihood of undertaking dishonest behavior to restore fairness, with conflicting group affiliations fostering fairness-restorative dishonest behavior.
To investigate dishonest behavior as a reaction to unfairness we needed to ensure that participants shared the same perception of fairness. Consistent with previous research (Cappelenet al., 2014), we find that the real-effort task was effective to prime perceptions of fairness in the proportionality principle. This was confirmed by responses to theSocial Norm task.
Crucial for addressing our hypotheses was designing a setting that allowed recipients to experience unfair decisions. Consistent with previous findings (Konow, 2000; Dengler-Roscheret al., 2015), we observed that dictators allocated to themselves more than what they believe is fair. Across all group conditions the index of proportionality revealed that allocations were self-oriented. Therefore, our modified dictator game was an effective setting to impose experiences of unfairness on recipients and to prepare a propellant for fairness-restorativedishonest behavior.
Consistent with previous research on dishonest behavior, we find that individuals behave dishonestly to increase their earning when they are given the opportunity (Fis-chbacher & Föllmi-Heusi, 2013; Ploner & Regner, 2013). Although across all conditions responses to the survey on perceptions of experienced unfairness confirmed that
re-11Results are confirmed by a Tobit model to account for potential censoring in the data from the
cipients acknowledged that dictators allocated unfairly, dishonest behavior increases only when individuals experience unfair decisions made by an out-group member. Re-gression results suggest that group identity enters the way unfairness is tolerated and, thus, moderatesfairness-restorativedishonest behavior. Recipients were more willing to engage in dishonest behavior to restore fairness after experiencing unfair decisions made by an outgroup member. Contrary to our prediction, unfairness was irrelevant to purge dishonest behavior when recipients received unfair allocations from an ingroup member compared to when recipients received unfair allocations from a dictator without a specified group identity.
Why should recipients react to unfairness when they are matched with an outgroup while refraining from the attempt to restore fairness when they are matched with an ingroup? The explanation lies at the roots of SIT. Conditional on which group identity is salient, individuals engage in different mentalizing processes of the norm violation (Baumgartneret al., 2013). Recipients interacting with an unfair dictator with a differ-ent group iddiffer-entity have no reasons to put themselves in her shoes. They do not need to preserve their beliefs about their group identity and, thus, mentalize toward the unfair dictator. Instead, they perceive norm violations intolerable and attempt to restore fairness by becoming more inclined to dishonest behavior. In contrast, when a shared group identity is salient, recipients easily mentalize toward unfair dictators to maintain intact their beliefs about the group. A shared group identity would call for fair allocations, and when this is not the case, recipients may avoid potential discomfort by justifying dictator’s behavior.
In contrast with Houseret al.(2012)’s finding, we did not observe dishonest behavior motivated by unfairness in the Baseline. This might explain why we do not find that ingroup recipients engage in lessfairness-restorativedishonest behavior than recipients in the Baseline. Our intuition is that the fact that both the recipient and the dictator exerted effort, made salient the idea ofasset legitimacy(Mittone & Ploner, 2012) and mediated reactions to unfairness. Recipients in Baseline accept unfairness from a dictator because they acknowledge the additional effort exerted by the dictator to decide how to allocate the co-produced endowment.
1.5. CONCLUSIONS
In this study, we addressed the hidden danger of allowing for the coexistence of conflicting group identities: this latter is likely to prompt extreme sensitivity to unfair distributions that translates in determining negative externalities outside organizational borders.
C
H
A
P
T
E
R
2
P
ERCEPTIONS OF OTHERS
’ R
ISK
A
TTITUDE AND
G
ENDER
S
TEREOTYPE
with Caleb Cox - Virginia Commonwealth University
and Morten I. Lau - Durham Business School and Copenhagen Business School
I
ndividual risk attitudes and perceptions of others’ risk attitudes might influence many economic outcomes, such as occupational segregation and job promotions. We conduct an incentivized laboratory experiment to assess how individual risk attitudes and perceptions of others’ risk attitude are biased by gender stereotype. We structurally estimate coefficients of risk attitudes under the Expected Utility and Rank Dependent models of choice and find no gender difference in the curvature of the utility function. We find evidence of gender stereotype bias: males use gender information for stereotyping others’ risk attitude.Keywords: Risk Preferences; Gender Stereotype; Laboratory Experiment
2.1
Introduction
Different individual risk attitudes and different perceptions of others’ risk attitudes are potential sources of conflict in many social interactions. In particular, if females (males) are wrongly perceived to be more risk averse (taking) than males (females), females or males may be disadvantaged in situations where incorrect perceptions of their risk attitudes have an influence on the decision making process. As an example, employers might base corporate promotions on gender stereotypes if the candidate’s gender is known to the decision maker (Wyer Jr & Wyer Jr, 1998). Furthermore, when inaccurate beliefs are internalized, they might channel decisions involving risk, such as occupational choices, and lead to selection into jobs that require less (more) risky decisions (Akerlof & Kranton, 2000).
We conduct a laboratory experiment with students at Durham University and elicit their individual risk attitudes and beliefs about the risk attitudes of other students who participated in the experiment. The experiment consists of two parts. In the first part, we use an existing experimental design and elicit individual risk attitudes over real monetary outcomes. A set of 40 lottery pairs allows us to study several dimensions of individual risk attitudes and compare Expected Utility Theory (EUT) to the alternative Rank-Dependent Utility Theory (RDU). This set of decision tasks is based on the lotteries in Harrison & Swarthout (2012, 2014) and Harrisonet al.(2015).
2.2. EXISTING LITERATURE
we find that perceptions of others’ risk attitude are biased by the inaccurate stereotype that females are more risk averse than males.
2.2
Existing literature
Surprisingly little work has been done on the association between individual risk at-titudes and stereotyped perceptions of others’ risk atat-titudes in controlled laboratory settings. Hsee & Weber (1997, 1998, 1999) were the first to address this issue. They present subjects with seven hypothetical decision tasks in which they are asked to select a sure amount or a lottery with a 50-50 probability distribution over two outcomes. Subjects are then asked to predict the choices made by others in similar decision tasks, where the reference to others differs across the three studies, from "somebody somewhere in the US" to "an average student on campus" to "the individual sitting next to them." One concern in this study is that the decision tasks are not incentive compatible1. The subjects are not paid according to their decisions, and both observed risk attitudes and subjective beliefs may be influenced by hypothetical bias2.
This early work provided inspiration for later studies with incentive compatible deci-sion tasks, and two elicitation methods in particular have been used to elicit individual risk aversion and stereotyped beliefs: in the Multiple Price List (MPL) design the subject is presented with an ordered array of binary lottery choices, whereas in the Ordered Lottery Selection (OLS) design the subject chooses one lottery from an ordered set of several lotteries.
In the MPL, popularized by Holt & Laury (2002), subjects are presented with an array of binary choice tasks between two lotteries, where each lottery typically has two outcomes. The subjects are asked to select one of the two lotteries in each decision task and one decision task is randomly selected for payment. This method has been widely 1Subjects are paid $50 in the third experiment by Hsee & Weber (1997) if all predictions are accurate. 2Other studies have used hypothetical decisions tasks to elicit individual risk attitudes and stereotyped
beliefs with respect to the risk attitudes of others.
Siegristet al.(2002) use the same design as the first and second experiment in Hsee & Weber (1997), but instead of referring to "most other students in the US" they also look at gender differences and refer to "most other female students in the US" and "most other male students in the US".
used to elicit individual risk attitudes since the reward structure is transparent and simple, and one can easily derive measures of absolute and relative risk aversion from observed choices. Despite the simplicity of the elicitation method there is some concern about possible framing effects in this design, although it is possible to identify and correct for possible framing effects (Andersenet al., 2006).
The MPL was adopted by Roth & Voskort (2014) who conducted an artefactual field experiment with senior and junior financial advisors and students. First, they present subjects with the MPL task. Then, they ask subjects to predict the choices made in the same MPL task by some profiles of respondents to a web-based survey 3. They can base their predictions on information about the profile which varied according to two conditions. Subjects assigned to the "Rank" condition are, first, asked to assign a preference ranking to each of the profile’s attributes and, then, to predict the risky choices of four profiles. Subjects assigned to the "Pay" condition are, first, asked to pay for disclosing each profile’s attributes and, then, to predict the risky choices of four profiles. The prediction task in both conditions is incentivized4. The authors find that on average professionals are more risk seeking in their decisions than when making predictions on the profile. The authors report evidence of stereotype bias. Subjects use available information about the profile to form their beliefs. Particularly, they find that predicted number of safe choices increases when the profile is female5.
3Web-survey respondents are recruited via E-mail and are asked to circulate the survey. They are
presented the same MPL task used in the experiment. However, they are not paid according to their choices. The authors mention that participants who complete the web-based survey are given the opportunity to winAC50. From the web-survey the authors create eight profiles, each characterized by a different combination of seven attributes, such as sex, age, marital status, level of education, number of children and income.
4In the "Rank" condition, for each profile the computer assigns a random number to the preference
ranking and determines the number of attributes to disclose to subjects. In the "Pay" condition, for each attribute and for each profile, subjects choose which characteristics are uncovered by paying according to a scoring rule (e.g., the first attribute costsAC0.01 and all attributes costAC0.99). In both conditions, if the prediction for a profile is correct the subject receivesAC0.50.
5In addition to the MPL, Roth & Voskort (2014) adopt another incentivized mechanism to elicit risk
preferences and beliefs about risk attitude of others. They ask subjects to hypothetically invest up to
AC100.000 into a lottery that doubles or halves the amount invested with 50/50 probability. To provide incentives, the high stake amounts are divided by 4 for the actual payment. Then, they ask subjects to predict the amount invested by each profile. As for the MPL, web-survey respondents are presented with the same investment question. However, they are not paid according to their choices. According to the "Rank" and "Pay" conditions, subjects can base their predictions on available attributes of each target profile. If the prediction for a profile is correct, subjects receivedAC0.50.
2.2. EXISTING LITERATURE
The second method adopted to derive stereotyped beliefs over others’ risk attitudes is the OLS developed by Binswanger (1980, 1981). In particular, Eckel & Grossman (2002, 2008) use an OLS-based design in which subjects are presented with a choice of five lotteries and asked to pick one. Each lottery has two possible outcomes, each with a 50-50 chance. While the instrument is easy to understand, it restricts the probabilities to 12. This way, it does not allow to make inferences about non-EUT models of choice behavior, such as probability weighting. To investigate predictions of risk attitude of others, they conduct an experiment in which they ask 261 students to predict each other’s choices. Subjects are distributed across loss and gain treatments and are seated at tables with unobstructed views of all session participants. Subjects are asked to select one lottery from a set of five gambles. Then, they are asked to predict how each participant in the session would choose in the same task. First, they report gender difference in risky choices: on average males choose riskier alternatives than females in all treatments. Then, they report gender difference in predicting risk attitudes of others: males are predicted by both males and females to be less risk averse than females. Finally, they do not find gender difference in the accuracy of predictions made by females and males.
Other studies took inspiration from Eckel & Grossman (2002, 2008)’s design to investigate stereotyped predictions of others’ risk attitude. Ballet al.(2010) recruit 182 students to investigate how predictions of risk attitudes of others are influenced by targets’ physical appearance. Subjects are first asked to select a gamble from a set of six alternative gambles and, then, to predict the gamble chosen by each session participant. Each subject is also asked to use a dynamometer to collect a measure of individual physical prowess. They find that predictions reflect gender stereotype. Particularly, they find that observable characteristics associated to gender stereotyping, such as attractiveness for females and strength for males, affect predictions of females’ and males’ risky choices.
are asked to predict the gamble chosen by each session participant the first time by having unobstructed view of each participant; next, they are told they can revise the first predictions after being provided each target’s responses to a question about social risk and financial statement. Those assigned to the "Info/Visual" condition are asked to predict each sessions’ gamble choice only being provided each target’s responses; then, they are told they can revise their prediction by directly observing the target. While they do not find that choices differ by treatment, they find evidence of gender stereotype in predictions of others’ risk attitude when subjects are provided with the visual clues. Particularly, predictions in the "Info/Visual" condition are significantly revised as more risk taking for males and more risk averse for females.
Previous studies inferred gender difference in risk preferences and stereotyping in predictions of others’ risk attitude from observed choices. However, none directly esti-mated the risk attitude coefficients underlying a latent model of choice in a prediction task. Chakravartyet al.(2011) structurally estimate risk attitude, however, they investi-gate how individual risk preferences affect risky choices made on behalf of others, and not how the formers affect predictions of risk attitude of others. Subjects are presented with two MPLs in which they have to make choices having consequences on themselves and on behalf on others. They find a widespread highe