Particle Size Distributionof Fine Aggregate of Mahakali River,
Nepal
Subik Shrestha
1and Shubhechha Paudyal
21
Engineer, Department of Water Resources and Irrigation, Government of Nepal
2Department of Civil, Geo and Environmental Engineering, Technical University of Munich, Germany
1.
Introduction
Mahakali River, known as Sarada River in India, is an international river that acts as a natural boundary between the western part of Nepal and India. This river descendsfrom the Kalapani mountain at 3,600m elevation andflows southeast merging with the Ghagra River of India. Mahakali river is one of the five major river basins of Nepal with an area of 14,871 sq. km[1] andhas also been proposed asthe source for one of the many projects in the Himalayan component of the Indian Rivers Inter-link project [2]. Chameliya and Rangun Rivers of Nepal and Kuti, Dhauli, Gori, Sarju and Ladhiya are the main tributaries of this river with an average discharge of 730 cumecs [3]. This river also possesses huge hydropower potential of 5600 MW of electricity for the Pancheshwor Multipurpose Dam Project [4]. At present, the major water storage projects of this river include the Upper Sarada Irrigation Barrage, Lower Sarada Barrage and Tanakpur Barrage and Hydroelectric Project [2].
Figure 1: Mahakali Basin
Abstract:
This study was carried out during the period of 2017-2019 in order to find out the characteristicsof fine aggregates dredged from the Mahakali River of Nepal. The Mahakali River acts as an international border between the western part of Nepal and India. For this study, sand samples from different parts of the Mahakali River were sampled and tested in the laboratory of Far Western Irrigation Directorate in Dhangadhi, Kailali. It was found out that the D50 value of fine aggregates of the Mahakali River was 0.32 mm with afineness modulus of 1.88 which means that the particles are fine and not well graded.
The distribution of particle sizes or Particle Size Distribution (PSD) is a fundamental characteristic of fine aggregates and accurate PSDsare required to design hydraulic structures [5]. In general, the PSD of aggregates affects various properties such as the setting time of cement, the hiding power of pigments, the activity of catalysts, the taste of food and the sintering shrinkage of metallurgical compositions to name a few [6]. It also plays a vital role in identifying other factors such as the silt factor of a riverbed, its scour depth, Froude Number etc.
2.
Material and Methods
Fine aggregates were collected from different parts of the Mahakali River from 28°57'21.22"N, 80° 6'21.33"E to 28°53'42.55"N, 80° 6'52.01"E. PSD of these aggregates was analyzed using Sieve Analysis, one of the many methods commonly used to find out PSD. Collected samples were washed thoroughly and dried in the oven at 34ºC for 4 hours. Then, they were cooled and sieved in a sieve shaker. The sieves of the sieve shaker were cleaned using a brush to remove any particles stocked in the openings. Indian Standard Sieves of sieve sizes 4.75mm, 2.36mm, 2mm, 1.18mm, 0.6mm, 0.3mm, 0.15mm, 0.075mm and pan were used for analysis, each weighing 431gm, 299 gm, 404gm, 381 gm, 370gm,370gm, 339 gm, 354gm, and 309gm respectively. The sieves were arranged in order from larger to smaller opening. The sieve shaker was allowed to shake electrically for 8-10 minutes and the weight of each particle retained in sieve was recorded.
Figure 2: Site of Sampling of Fine Aggregate
The same procedure was used for each of the ten samples and a semi-log graph was plotted between the particle size, in mm and the percentage finer of the material passing through each measured sieve, known as the PSD Curve. The values of D60, D50, D30, D10were obtained from the PSD curve and the Coefficient of Uniformity (Cu), Coefficient of Curvature (Cc), the Fineness Modulus (FM)and the Silt factor (f) were calculated using the following formulae:
Cu =D60
D10 Formula-1
Cc = D30
2
D60∗D10 Formula-2
FM = Cumulative percentage retained in each Sieve
100 Formula-3
3.
Result and Discussion
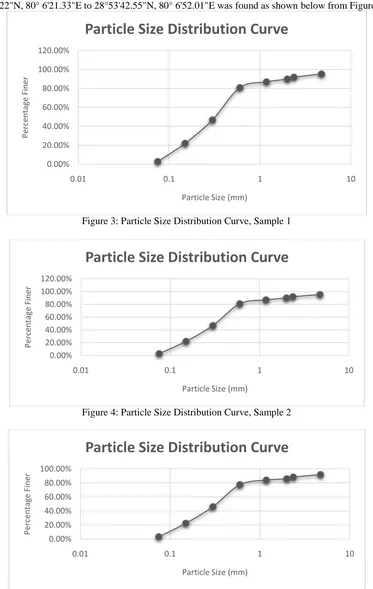
The particle size distribution of the fine aggregates obtained from the Mahakali River at Range 28°57'21.22"N, 80° 6'21.33"E to 28°53'42.55"N, 80° 6'52.01"E was found as shown below from Figure 3-12.
Figure 3: Particle Size Distribution Curve, Sample 1
Figure 4: Particle Size Distribution Curve, Sample 2
0.00% 20.00% 40.00% 60.00% 80.00% 100.00% 120.00%
0.01 0.1 1 10
Per
ce
n
tag
e F
in
er
Particle Size (mm)
Particle Size Distribution Curve
0.00% 20.00% 40.00% 60.00% 80.00% 100.00% 120.00%
0.01 0.1 1 10
Per
ce
n
tag
e F
in
er
Particle Size (mm)
Particle Size Distribution Curve
0.00% 20.00% 40.00% 60.00% 80.00% 100.00%
0.01 0.1 1 10
Per
ce
n
tag
e F
in
er
Particle Size (mm)
Figure 6: Particle Size Distribution Curve, Sample 4
Figure 7: Particle Size Distribution Curve, Sample 5
Figure 8: Particle Size Distribution Curve, Sample 6
0.00% 20.00% 40.00% 60.00% 80.00% 100.00%
0.01 0.1 1 10
Per
ce
n
tag
e F
in
er
Particle Size (mm)
Particle Size Distribution Curve
0.00% 20.00% 40.00% 60.00% 80.00% 100.00% 120.00%
0.01 0.1 1 10
Per
ce
n
tag
e F
in
er
Particle Size (mm)
Particle Size Distribution Curve
0.00% 20.00% 40.00% 60.00% 80.00% 100.00%
0.01 0.1 1 10
Per
ce
n
tag
e F
in
er
Particle Size (mm)
Figure 9: Particle Size Distribution Curve, Sample 7
Figure 10: Particle Size Distribution Curve, Sample 8
Figure 11: Particle Size Distribution Curve, Sample 9
0.00% 20.00% 40.00% 60.00% 80.00% 100.00%
0.01 0.1 1 10
Per
ce
n
tag
e F
in
er
Particle Size (mm)
Particle Size Distribution Curve
0.00% 20.00% 40.00% 60.00% 80.00% 100.00% 120.00%
0.01 0.1 1 10
Per
ce
n
tag
e F
in
er
Particle Size (mm)
Particle Size Distribution Curve
0.00% 20.00% 40.00% 60.00% 80.00% 100.00% 120.00%
0.01 0.1 1 10
Per
ce
n
tag
e F
in
er
Particle Size (mm)
Figure 12: Particle Size Distribution Curve, Sample 10
The values for D10, D30, D50, D60 were obtained from interpolation of this curve whereas the values for the Coefficient of Uniformity (Cu), Coefficient of Curvature (Cc) and Fineness Modulus (FM) were calculated using Formula 1-3 (see Section 2). All values are shown below in Table 1.
Table 1: Sample Values from each Analysis on Samples (in mm)
Sample D60 D50 D30 D10 Cu Cc FM
S-1 0.42 0.33 0.20 0.10 4.04 0.91 1.86
S-2 0.42 0.32 0.20 0.10 4.06 0.92 1.89
S-3 0.43 0.34 0.20 0.10 4.26 0.89 2.04
S-4 0.41 0.29 0.18 0.09 4.33 0.80 1.91
S-5 0.40 0.31 0.19 0.10 4.03 0.90 1.77
S-6 0.40 0.31 0.19 0.10 4.01 0.91 1.87
S-7 0.41 0.32 0.19 0.10 4.22 0.88 1.85
S-8 0.41 0.32 0.20 0.10 3.92 0.92 1.78
S-9 0.42 0.32 0.19 0.10 4.15 0.88 1.89
S-10 0.42 0.32 0.19 0.10 4.16 0.88 1.90
Average 0.41 0.32 0.19 0.10 4.12 0.89 1.88
(Source: Sieve Analysis)
4.
Conclusion
This study found out the values of D60as 0.41mm, D50as 0.32mm, D30as 0.19mm, D10as 0.10mm, Cu 4.12, Cc 0.89 and FM 1.88, This shows that the particles of the Mahakali River at this location are fine and not well graded. This D50was used to calculate Silt factor (f) of 0.996 using the Formula-4 (see section 2). This is also a useful data for calculating scour depth of river and for designing the launching apron in river training works and other hydraulics structures at the Mahakali River.
Acknowledgement
We are thankful to Mr. Meghraj Awasthi, Divisional Chief of WRIDDO-Dadeldhura, Mr. Amar B. Pal, Divisional Chief of WRIDDO-Kailali, Mr. Bhagat Raj Acharya, Engineer, Government of Nepal and Mr. Harka Rana Magar of Ministry of Physical Infrastructure Development, Kailali for assisting us during the lab work and preparation of this article.
0.00% 20.00% 40.00% 60.00% 80.00% 100.00% 120.00%
0.01 0.1 1 10
Per
ce
n
tag
e F
in
er
Particle Size (mm)
References
[1]. World Bank (1987). Nepal and International Inland Waterways issues, Legal Department, Asian Division: World Bank.
[2]. Tiwary, R. (2006). Indo-Nepal Water Resource Negotiation: Deepening Divide over Border Project South Asia Journal, January – March 2006. Archived 11 January 2011 at the Wayback Machine [3]. Himalayan Component Link Proposal NWDA, Govt of India, Accessed: June 2014
[4]. Available at: http://articles.economictimes.indiatimes.com/2013-09-4/news/42062420_1_mahakali-treaty-nepalese-delegation-nepal-and-india
[5]. Ferraris, C.F., HAckley, V. A., Aciles, A.I. "Measurement of Particle Size Distribution in Portland Cement Powder: Analysis of ASTM Round Robins Studies", Cement, Concrete and Aggregate, www.astm.org, Vol.26, No.2, Dec, 2004
[6]. David Fairhurst," A Guide to Determination of Particle Size – Making an Effective and Reliable Measurement", Brook heaven Instruments,