Volume: 04, Issue: 03
(May- June, 2018)
190
Ornamental Medium Access Control Protocol (Orn-MAC) for Wireless
Sensor Network
Prashant Chourasiya1, Prof. Vimal Tiwari2 Department of Computer Science & Engineering Bhopal Institute of Science & Technology, RGPV, Bhopal
Abstract:-Wireless Sensor Network (WSN) is one of the emerging paradigms from last few decades. The small sensor nodes monitor the environmental events and transmit gathered information to sink. Wireless Sensor Network has wide range of applications in both defence and civil environment. Since the sensor nodes have finite battery, therefore battery consumption is one of the major challenges in Wireless Sensor Network. As all knows that wireless sensor network is a network of tiny sensors spatially distributed to monitor the environmental conditions. Sensors are the building block of wireless sensor networks with sensing, congregation and communication abilities. The main challenge in wireless sensor network’s practical application is network’s life time which depends on the energy consumption by the sensor nodes and calculated on the basis of its performance parameters i.e. Throughput, PDR, End-to-End Delay, and Routing Overhead. Since the sensors are obviously have limited battery therefore they restricts the lifetime of wireless sensor networks. To overcome this, cooperative communication has emerged as a recent trend in WSN which uses relay node to transmit data to the destination node. Here in this work an Orn-MAC have been designed to overcome the problem associated with CR-MAC and the improvement have been noticed in the terms of Throughput, PDR, End-to-End Delay, Routing Overhead.
Keywords: WSN, MAC, Performance, Energy Efficiency.
I. INTRODUCTION
Wireless sensor network [1] is gaining popularity now a day, due to vast potential usage of sensor networks in different areas. A Wireless sensor network is a collection of small tiny autonomous sensors distributed spatially to supervise the physic1al conditions. The physical condition includes temperature, humidity, pressure, sound etc. a Wireless sensor network is independently configure itself and sensor nodes uses radio signals to communicate with each other. They are deployed in large number in environment to sense and monitor the physical world. A sensor in Wireless sensor network has computational power and sensing capability. These tiny sensor nodes, which consist of sensing, data processing, and communicating components, leverage the idea of sensor networks based on collaborative effort of a large number of nodes. Sensor networks represent a significant improvement over traditional sensors. Wireless sensor network enables to connect the physical world to environment. It is easy to obtain the data about
physical phenomena by using tiny sensor nodes, which was very much difficult with conventional ways. Wireless sensor network [2] made up of large number of nodes approx ten thousands. These nodes collect process and cooperatively pass this collected information to a central location. The more advance Wireless sensor networks are bidirectional. They allow the data transfer in both the direction. Hence there is a control over the sensors [3].
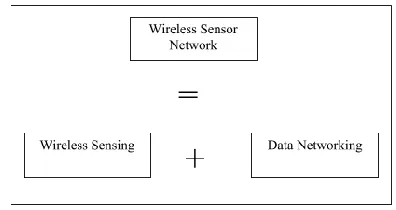
Fig 1 Components of Wireless Sensor Network
II. PROPOSED WORK
Before initiating this work, a substantial amount of time is spent on studying algorithms related to improving performance of and MAC protocol [4] in Wireless Sensor Network by selecting a best relay node based on following parameters, Optimal Data Rate, No. of Retry<Threshold, Minimum Contention Window Size, Minimum RTS/Frame, Minimum Node Delay Time, Minimum Node Buffer Size and Maximum PDR. The major objectives of the work are: - To implement an algorithm for increasing the performance of WSN by selecting best of sensor node relays. To simulate a proposed model in NS.2.34 and to validate &analyzes the performance of proposed OrnMAC with the help of a number of parameters like Throughput, PDR, End-to-End delay, Overhead. Comparison of the Performance of Proposed an OrnMAC with respect to normal scenario.
2.1 Ornamental Medium Access Control Protocol (OrnMAC) For WSN OrnMAC-Protocol
1. BEGIN, JTH
2. INITIALIZE NODE = IDLE 3. CHANEL SENSING
4. If (NODE_BUFFER == EMPTY) GOTO 2 5. NODE HAS DATA TO SEND
6. If (CHANNEL == BSY) Random Back-off 7. If (CHANNEL == IDLE for DIFS duration) 8. { send RTS to DEST_NODE
191 10. If ( CTS_RECEIVED == FALSE) THEN Random
Back-off GO TO 3
11. Else Wait for ORF_FRAME
12. If(ORF_FRAME_RECEIVED == FALSE) 13. { Send DATA to DEST_NODE
14. If (CHK_SUCCESS == TRUE) GO TO END 15. Else FAILURE GOTO 3
16. } Else
17. { SELECT 2_BEST_ RELAYS such that
18. ((DATA RATE == REQ) && (NO_OF_FAILLURE <THRESHOLD) && (NODE BUFFER SIZE< THRESHOLD) && (DELAY < Avg. DELAY) && (PDR> Avg.PDR) && (Battery Life > Avg. Battery Life) && Contention Window Size<Minimum && PDR>Threshold.
19. If(2_BEST_ RELAYSS_SELECTED == TRUE) 20. { Send DATA to 2_BEST_ RELAYS
21. RELAY send DATA to DEST_NODE 22. If (CHK_SUCCESS == TRUE) GOTO END 23. Else send DATA via RELAY
24. If (CHK_SUCCESS == TRUE) GOTO END 25. Else { NO_OF_FAIL ++
26. If (RETRY_LIMIT_EXCEEDED == TRUE) 27. { DELETE packet from BUFFER
28. GOTO 1 29. } Else GOTO 6 30. }
31. Else If(1 RELAY FOUND == TRUE) 32. { Send DATA to DEST_NODE
33. If (CHK_SUCCESS == TRUE) GOTO END 34. Else{ Send DATA via RELAY
35. If (CHK_SUCCESS == TRUE) GOTO END 36. Else { NO_OF_FAIL ++
37. If (RETRY_LIMIT_EXCEEDED == TRUE) 38. { DELETE packet from BUFFER
39. GOTO 1 40. } Else GOTO 6 41. }}}}}
42. END
CHK_SUCCESS
1. If (ACK_RECEIVED after SIFS == TRUE) 2. {SUCCESS
3. RETURN TRUE}
Using above algorithm in MAC layer we find best relay nodes in WSN for improving the performance of WSN over following parameters
1. Throughput 2. PDR
3. End-t-End Delay 4. Routing Overhead
III. RESULT AND ANALYSIS 3.1 SIMULATION PARAMETERS
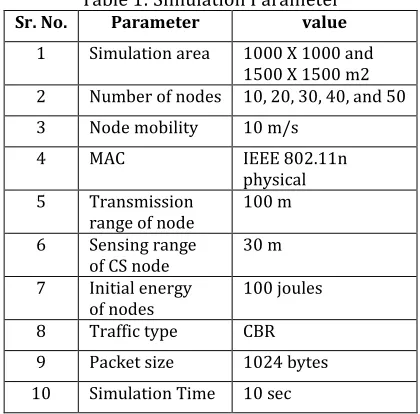
The performance of proposed relay selection framework is analyzed by different test scenarios and it is simulated using network simulator NS-2 tool. In the simulation run, we have used the parameter values are shown in Table 1.
We consider a large amount of nodes within the 1000×1000 and 1500×1500 m2 for different test scenarios. The transmission range of user is 100 m. The sensing range of users is 30 m and an initial energy of nodes is 100 joules respectively and the initial power consumption of transmitting circuit is 15.9mW and the receiving circuit is 22.2mW. Two different testing scenarios used to analyze the performance of proposed relay selection framework OrnMAC. In first scenario, we vary number of nodes 10 to 50 with two different traffic and network sizes. At the same time, we varying network size 1000×1000 and 1500×1500 m2 with fixed traffic are described in second scenario. Two different traffic models consider for our simulation i.e. derived from constant bit rate (CBR) traffic, with packet size 1024 bytes. Two sorts of progress models are viewed as: traffic type 1 (TT-1) in which the simulation time as 100 seconds correspondingly isolated among the flexible fixation focuses; in these availabilities, taking an interest focuses transmit one by one; i.e., just a single fixation transmits at each open passage. Strikingly, in traffic type 2 (TT-2), focus point 1 transmits from opening 1 onwards; focus 2 transmits from space 2 onwards; and so on. That is, at the last open door, every single focus point is transmitting.
Table 1: Simulation Parameter
Sr. No. Parameter value
1 Simulation area 1000 X 1000 and
1500 X 1500 m2 2 Number of nodes 10, 20, 30, 40, and 50
3 Node mobility 10 m/s
4 MAC IEEE 802.11n
physical
5 Transmission
range of node 100 m
6 Sensing range
of CS node 30 m
7 Initial energy
of nodes 100 joules
8 Traffic type CBR
9 Packet size 1024 bytes
10 Simulation Time 10 sec
The performance of proposed OrnMAC framework compared with the existing Energy Aware Cooperative Relay selection in CWNs (EACR). The two performance metrics used to prove our proposed relay selection framework perform better than existing one.
3.2 RESULT & ANALYSIS
Volume: 04, Issue: 03
(May- June, 2018)
192 3.2.1 Throughput
It is defined as average rate of successful message delivery [12] over a communication channel, or the expanse of data transferred per unit time. The throughput is commonly restrained in bits per second (bps), and sometimes in data packets per second.
Throughput = P / (TStop – TStart) KB/Sec
Where P = Total Received Packet, TStop= Stop Time, TStart = StartTime, Thr- Throughput.
(i) For Orn-MAC
At N=10, Pr10=108, TStop=4,
TStart=2 Thr05 =108/ (4-2) =108/2=54
At N=20, Pr10=118, TStop=7,
TStart=5 Thr10=118/ (7-5) =116/2=58
and so on…
Where N= Number of Nodes, TStop= Time at which simulation stops and TStart= Time at which simulation starts, Thr= Throughput of the network.
Here We have shown calculations of Throughput at 10 & 20 nodes which produces output after simulation as a results we get Throughput at 10 Nodes=54 & Throughput at 20 Nodes=58, Throughput at other nodes i.e. .for 30-100 Nodes values can be premeditated in the same manner using TR (Tabulation Results) & AWK Files.
Table: 2 Throughputs
S. No No. of
Nodes C-MAC Orn-MAC Improvement (in %)
1 5 2.3 2.8 (2.8-2.3)/(2.3)*100
=21.7%
2 10 2.24 2.48 (2.48-2.24)/(2.24)*100
=10.71%
3 15 2.56 2.98 (2.98-2.56)/(2.56)*100
=16.4%
4 20 2.0 2.3 (2.3-2.0)/(2)*100
=15%
5 30 2.5 2.7 (2.7-2.5)/(2.5)*100
=8%
6 40 2.7 2.85 (2.85-2.7)/(2.7)*100
=5.56%
7 50 2.82 2.93 (2.93-2.82)/(2.82)*100
=3.9%
8 60 2.84 2.96 (2.96-2.84)/(2.84)*100
=4.96%
9 70 2.80 2.90 (2.9-2.8)/(2.8)*100
=3.57%
10 80 2.76 2.88 (2.88-2.76)/(2.76)*100
=4.34%
11 90 2.79 2.92 (2.92-2.79)/(2.79)*100
=4.66%
12 100 2.82 3.0 (3-2.82)/(2.82)*100
=7.1%
Avg. Improvement in Throughput
=(21.7+10.71+16.4+15+8+5.56+3.9+4.96+3.57+4.34+4.6 6+7.1)/(12)
=8.825%
As per the Table 2 and Figure 1 it can be seen that throughput has been increases because of using the relay concept. Better alternative paths have been obtainable using relay nodes and relay paths. Number of nodes has been increases from 5 to 100 and HFMAC and C-MAC performance have been compared in terms of Throughput. In the case of modified relay throughput have been increases considerably because handiness of alternate paths through relay nodes.
Figure 1: Throughput
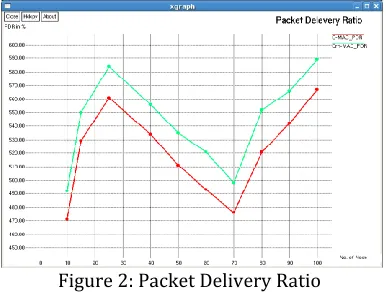
3.2.2 PACKET DELIVERY RATIO
Packet delivery ratio is defined as the ratio of data packets acknowledged by the destinations to those generated by the sources. This performance metric articulates us how well the protocol is performing in terms of packet delivery at dissimilar speeds when we use different traffic models.
Packet Delivery Ratio (PPDR) = (Pr/Ps)*100
Where PPDR = Packet Delivery Ratio, Pr= Packet Received, Ps = Packet Send.
(ii) For Orn-MAC At N=10, Pr=471, Ps=492 Ppdr10 =471/492 =95.73%
and so on…
Where N=Number of Nodes, Pr = packets received after simulation and Ps= Packets transmitted by sources, Ppdr =packet delivery ratio at the destination among 10 or 20 nodes. Here We have shown calculations of PDR at 10 & 20 nodes which produces output after simulation as a results we get PDR at 10 Nodes=64&PDR at 20 Nodes=65. PDR at other nodes i.e. 30-50 Nodes can be calculated in the same manner using TR (Tabulation Results) & AWK Files.
Table 3: Packet Delivery Ratio S. No. No. of
nodes C-MAC Orn-MAC Improvement (in %)
1 10 471 492 (492-471)/(471)
=4.45%
193 = 3.97%
3 25 561 584 (584-561)/(561)
= 4.1%
4 40 534 556 (534-556)/(534)
= 4.12%
5 50 511 535 (535-511)/(511)
= 4,7%
6 60 493 521 (521-493)/(493)
= 5.684.62%
7 70 476 498 (498-476)/(476)
= 4.62%
8 80 521 552 (552-521)/(521)
= 5.95%
9 90 542 566 (556-542)/(542)
=2.58%
10 100 567 589 (589-567)/(567)
=3.89%
Avg. improvement in pdr
=(4.45+3.97+4.1+4.12+4.7+5.68+4.62+5.95+2.58+3.89)/ (10)
=4.4%.
Figure 2: Packet Delivery Ratio
As per the Table 3 and Figure 2 It can be seen that Packet Delivery Ratio (PDR) has been growths because of using the relay concept Better alternative paths have been available using relay nodes and relay paths. Number of nodes has been increases from 10 to 100 and HFMAC and C-MAC concert have been associated in terms of Packet Delivery Ratio (PDR). In the case of modified relay throughput have been increases considerably because availability of alternate paths through relay nodes. More number of packets has been received as equaled to basic MAC protocol.
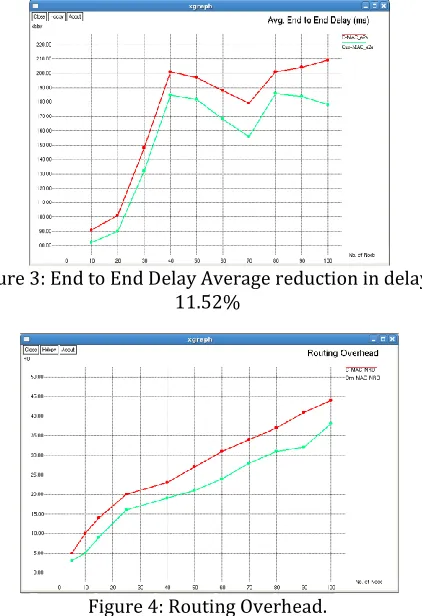
3.2.3END TO END DELAYS (ms):
End-to-end delay [19] refers to the time taken for a packet to be transmitted across a network from source to destination.
DEE= (DR--DT) Where DEE= End-to-End Delay,
DR=Delay at the Receiver/Destination, DT=Delay at the Transmitter/Source. (iii) For C-MAC
At N=10, DR=112, DT=21
DEE05 =(112-21) =91 For Orn-MAC
At N=10, DR=109,
DT=27 DEE10 =(109−27)=82 and so on…
Where
N=Number of Nodes, DEE = End-to-end Delay,
DR = Delay at the receiver/Destination, DTr =Delay at the Source at 10 nodes.
Here calculations of DEE at 10 nodes are shown which produces output after simulation as a results we get DEE at 10 Nodes =82 msec in Orn-MAC & Nodes=91 msec in C-MAC. However DEE at other nodes i.e. 30-100 Nodes can be calculated in the same manner using TR (Tabulation Results) & AWK Files.
Table 4: End to End Delay S, No, No. of
nodes C-MAC
Orn-MAC
Improvement (in %)
1 10 91 82 (91-82)/(82)
=10.97%
2 20 101 90 (101-90)/(90)
= 12.22%
3 30 148 132 (148-132)/(132)
= 12.12%
4 40 201 185 (201-185)/(185)
=8.65%
5 50 197 182 (197-182)/(182)
=8.24%
6 60 188 168 (188-168)/(168)
= 11.9%
7 70 179 156 (179-156)/(156)
=14.74%
8 80 201 186 (201-186)/(186)
=8.1
9 90 204 184 (204-184)
/(184) = 10.87
10 100 209 178 (209-178)/(178)
= 17.4
Avg. improvement in pdr
=(10.97+12.22+12.12+8.65+8.24+11.9+14.74+8.1+10.87 +17.4)/(10)
=11.52%
Volume: 04, Issue: 03
(May- June, 2018)
194 In the case of modified relay end-to-end delay have been decreases considerably because availability of alternate paths through relay nodes. More number of packets has been received as compared to basic MAC protocol with minimum delay. Reduction in delay is because of alternative relay path.
Figure 3: End to End Delay Average reduction in delay = 11.52%
Figure 4: Routing Overhead.
3.2.4 ROUTING OVERHEAD
From the table 5.5 and figure 5.4 we can see the routing overheard of CMAC using relay nodes reductions to 10.37% when compared with the basic MAC protocol (2 rcmac ).
Table 8.5: Routing Overhead No. of
nodes
C-MAC Orn- MAC
Improvement (in %)
5 5 3 (5-3)/3=67%
10 10 5 (10-5)/5*100=50%
15 14 9 (14-9)/9*=55/5%
25 20 16 (20-16)/16*100=25%
40 23 19 (23-19)/19*100=215
50 27 21 (27-21)/21*=28.57
60 31 24 (31-24)/24*100=29%
70 34 28 (34-28)/28=21.42%
80 37 31 (37-31)/31*100
=19.35%
90 41 32 (41-32)/32=28%
IV. CONCLUSION & FUTURE WORK
As all knows that wireless sensor network is a network of tiny sensors spatially distributed to monitor the environmental conditions. Sensors are the building block of wireless sensor networks with sensing, congregation and communication abilities. The main challenge in wireless sensor network’s practical application is network’s life time which depends on the energy consumption by the sensor nodes and calculated on the basis of its performance parameters i.e. Throughput, PDR, End-to-End Delay, and Routing Overhead. Since the sensors are obviously have limited battery therefore they restricts the lifetime of wireless sensor networks. To overcome this, cooperative communication has emerged as a recent trend in WSN which uses relay node to transmit data to the destination node. Here in this work an Orn-MAC have been designed to overcome the problem associated with CR-MAC and the improvement have been noticed in the terms of Throughput, PDR, End-to-End Delay, Routing Overhead. In future newly designed algorithm will be applied on VANET, Wi-MAX, cognitive Network and also for 5G Network.
REFERENCE
[1]. I. Hwang, J. Kim and S. Lee, "Performance Analysis of Wireless Sensor Networks with Non-coherent Cooperative Relay Nodes", Wireless Personal Communications, vol. 86, no. 3, pp. 1201-1212, 2015..
[2]. Qabas Ali Hikmat, Bin Dai, Rokan Khaji and Benxiong Huang, “Performance Analysis of Best Relay Selection in Cooperative Wireless Networks “, International Journal of Future Generation Communication and Networking Vol. 8, No., pp. 43-56 2015.
[3]. Shamna H R and Lillykutty Jacob, “Efficient Cooperative MAC and Routing in Wireless Networks”, Transactions on Networks and Communications, Volume 3 No. 5, October; pp: 79- 95, 2015.
[4]. Hongyu Cui, Lingyang Song, and Bingli Jiao, “Weighted Bidirectional Relay Selection for Outdated Channel State Information”, IEEE Transactions on Communications, Vol. 62, No. 2, Pages: 500-February 2014.
[5]. Bin Cao, Gang Feng, Yun Li, and Chong gang Wang, “Cooperative Media Access Control With Optimal Relay Selection in Error-Prone Wireless Networks”, IEEE Transactions on Vehicular Technology, Vol. 63, No. 1, January 2014.
195 with Optimal Relay Selection in Error-Prone Wireless Networks”, IEEE Transactions on Vehicular Technology, VOL. 63, NO. 1, JANUARY, pp 252—265 2014
[7]. Hongyu Cui, Lingyang Song, and Bingli Jiao, “Weighted Bidirectional Relay Selection for Outdated Channel State Information”, IEEE Transactions on Communications, VOL. 62, NO. 2, FEBRUARY, pp 500-509 2014
[8]. Andres Garcia-Saavedra and Balaji Rengarajan and Pablo Serrano and Daniel Camps-Mur and Xavier Costa-P´erez, “SOLOR: Self-Optimizing WLANs with Legacy-Compatible Opportunistic Relays” IEEE/ACM Transactions on Networking, VOL. XX, NO. X, XXXXXXX XXXX, pp 1-15.
[9]. Yogesh Bhute and A. R. Raut, “A Survey on Relay Selection Strategies in Cooperative Wireless Network for Capacity Enhancement”, International Journal of Computer Applications, ISSN: 0975 – 8887, Volume 65, No.25, Pages: 12-17, March 2013.
[10]. Biao Han, Jie Li, and Jinshu Su, “Optimal Relay Node Placement for Multi-pair Cooperative Communication in Wireless Networks”, 2013 IEEE Wireless Communications and Networking Conference Services & Applications, Pages: 4724-4729, 2013.
[11]. Yaming Luo, Jun Zhang, and Khaled B. Letaief, “Relay Selection for Energy Harvesting Cooperative Communication Systems”, IEEE Global Communications Conference (GLOBECOM), Atlanta, pp. 2514 - 2519, 2013 [12]. Poorvi Behre, Pankaj Sahu, “Customized Medium